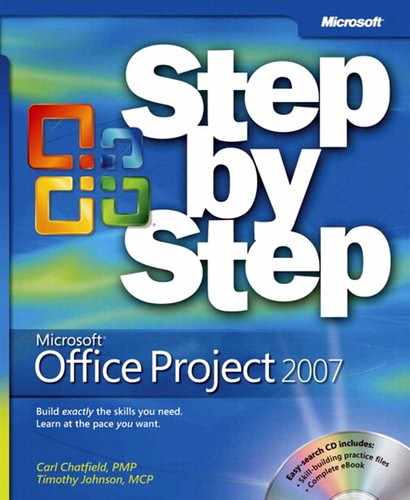
Chapter 5. Formatting and Printing Your Plan
In this chapter, you will learn how to: | |
✓ | Customize a view and preview the way it will look when printed. |
✓ | Draw on the chart portion of a Gantt Chart view. |
✓ | Change the formatting of text in a project plan. |
✓ | Edit and print reports. |
Tip
Do you need only a quick refresher on the topics in this chapter? See the Quick Reference entries in Formatting and Printing Your Plan.
In this chapter, you use some of the formatting features in Microsoft Office Project 2007 to change the way your data appears and then preview the results in the Print Preview window. As you might recall from Chapter 1, a Project plan is really a database of information, not unlike a Microsoft Office Access database file. You don’t normally see all of the data in a project plan at one time. Instead, you focus on the aspect of the plan that you’re currently interested in viewing. Views and reports are the most common ways to observe or print a project plan’s data. In both cases (especially with views), you can substantially format the data to meet your needs.
The primary way in which Project represents tasks graphically is as bars on the chart portion of a Gantt Chart view. These are called Gantt bars. On a Gantt chart, tasks, summary tasks, and milestones all appear as Gantt bars or symbols, and each type of bar has its own format. Whenever you work with Gantt bars, keep in mind that they represent tasks in a project plan.
Tip
This chapter introduces you to some of the simpler view and report formatting features in Project. You’ll find quite a bit more material about formatting, printing, and publishing your project plans in Chapter 10, Chapter 11, and Chapter 12. Of particular note are the visual reports introduced with this release of Project. You work with visual reports in Part 2.
Important
Before you can use the practice files provided for this chapter, you need to install them from the book’s companion CD to their default locations. See "Using the Book’s CD" for more information.
Creating a Custom Gantt Chart View
The Gantt chart became a standard way of visualizing project plans when, in the early twentieth century, American engineer Henry Gantt developed a bar chart showing the use of resources over time. For many people, a Gantt chart is synonymous with a project plan. In Project, the default view is the Gantt Chart view. You are likely to spend a lot of your time in this view when working in Project.
The Gantt Chart view consists of two parts: a table on the left and a bar chart on the right. The bar chart includes a timescale band across the top that denotes units of time. The bars on the chart graphically represent the tasks in the table in terms of start and finish dates, duration, and status (for example, whether work on the task has started or not). Other elements on the chart, such as link lines, represent relationships between tasks. The Gantt chart is a popular and widely understood representation of project information throughout the project management world.
Tip
By default, Project displays the Gantt Chart view when you start the program. However, you can change this setting to display any view you want at startup. On the Tools menu, click Options. In the Options dialog box, click the View tab. In the Default View box, click the view you want. The next time you start Project and create a new project plan, the view you have chosen will appear.
The default formatting applied to the Gantt Chart view works well for onscreen viewing, sharing with other programs, and printing. However, you can change the formatting of almost any element on the Gantt chart. In this exercise, we will focus on Gantt bars.
There are three distinct ways to format Gantt bars:
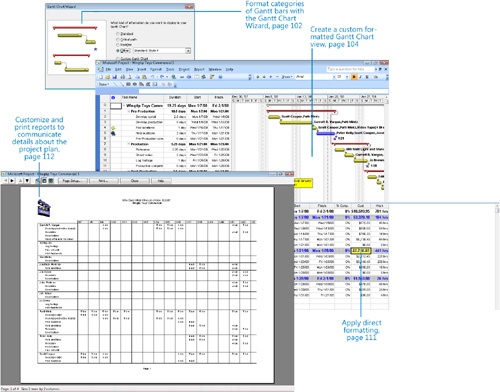
Format whole categories of Gantt bars in the Bar Styles dialog box, which you can open by clicking the Bar Styles command on the Format menu. In this case, the formatting changes you make to a particular type of Gantt bar (a summary task, for example) apply to all such Gantt bars in the Gantt chart.
Format whole categories of Gantt bars using the Gantt Chart Wizard, which you can start by clicking the Gantt Chart Wizard command on the Format menu. This wizard contains a series of pages in which you select formatting options for the most commonly used Gantt bars on the Gantt chart. Use the Gantt Chart Wizard to step you through some of the formatting actions that you can perform in the Bar Styles dialog box.
Format individual Gantt bars directly. The formatting changes you make have no effect on other bars in the Gantt chart. You can double-click a Gantt bar on the Gantt chart to view its formatting options, or click Bar on the Format menu.
In this exercise, you create a custom Gantt chart and apply predefined formatting to it using the Gantt Chart Wizard. You then preview the results for printing.
Important
If you are running Project Professional, you may need to make a one-time adjustment to use the Computer account and to work offline. This ensures that the practice files you work with in this chapter do not affect your Project Server data. For more information, see "Starting Project Professional“.
Note
OPEN Wingtip Toys Commercial 5a from the DocumentsMicrosoft PressProject 2007 SBSChapter 5 Simple Formatting folder. You can also access the practice files for this book by clicking Start, All Programs, Microsoft Press, Project 2007 Step by Step, and then selecting the chapter folder of the file you want to open.
On the File menu, click Save As.
The Save As dialog box appears.
In the File name box, type Wingtip Toys Commercial 5, and then click Save.
Next, you will display the project summary task to see the top-level or rolled-up details of the project. Project automatically generates the project summary task but doesn’t display it by default.
On the Tools menu, click Options.
In the Options dialog box, click the View tab.
Under the Outline options for label, select the Show project summary task check box, and then click OK.
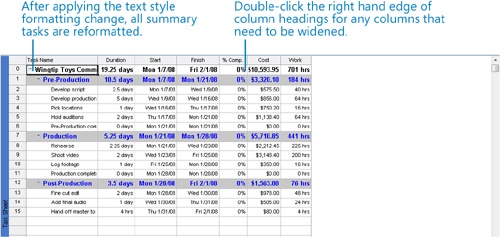
Project displays the project summary task at the top of the Gantt Chart view. You might see pound signs (##) or only part of the value in the project summary task’s Duration field. If so, complete step 6.
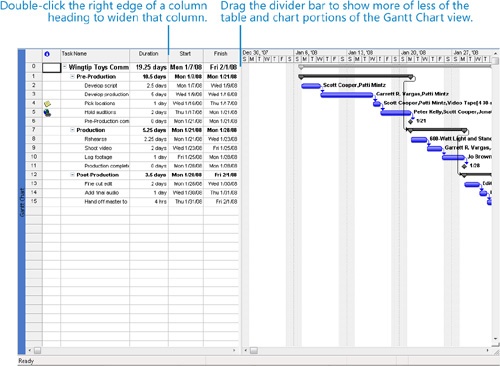
Double-click the right edge of the Duration column in the column heading to expand the column so that you can see the entire value.
Tip
You can also double-click anywhere in a column heading and, in the Column Definition dialog box that appears, click the Best Fit button. To quickly move the vertical divider bar to the edge of the nearest column in the table, double-click the divider bar.
The Duration column widens to show the widest value in the column.
Next, you will create a copy of the Gantt Chart view so that the formatting changes you make will not affect the original Gantt Chart view.
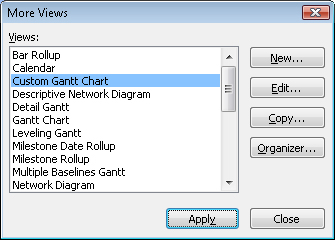
On the View menu, click More Views.
The More Views dialog box appears, with the current view (the Gantt Chart view) selected.
Click the Copy button.
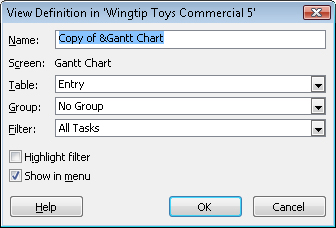
The View Definition dialog box appears.
The Name field contains the proposed name of the new view as it will appear in the More Views dialog box and, if you specify, on the View menu. Note the ampersand (&) in the Name field. This is a code that indicates the keyboard shortcut character of the new view name, should you wish to include one.
In the Name field, type Custom Gantt Chart, and then click OK.
The View Definition dialog box closes. The Custom Gantt Chart view appears and is selected in the More Views dialog box.
In the More Views dialog box, click the Apply button.
On the Standard toolbar, click Scroll to Task.
At this point, the Custom Gantt Chart view is an exact copy of the original Gantt Chart view, so the two views look alike. Note, however, that the view title on the left edge of the view is updated.
Next, you will use the Gantt Chart Wizard to format the Gantt bars and milestones in the chart portion of the Custom Gantt Chart view.
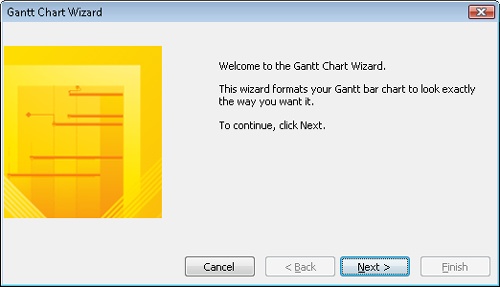
On the Format menu, click Gantt Chart Wizard.
The welcome page of the Gantt Chart Wizard appears.
Click Next.
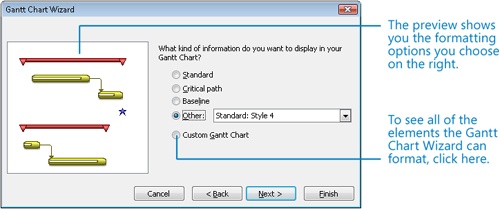
The next screen of the Gantt Chart Wizard appears.
Click Other, and on the drop-down list next to the Other option, click Standard: Style 4.
This is the only selection you’ll make in the Gantt Chart Wizard for now, so click the Finish button.
The final page of the Gantt Chart Wizard appears.
Click the Format It button, and then click the Exit Wizard button.
The Gantt Chart Wizard applies the Standard: Style 4 formatting to the Custom Gantt Chart view and then closes.
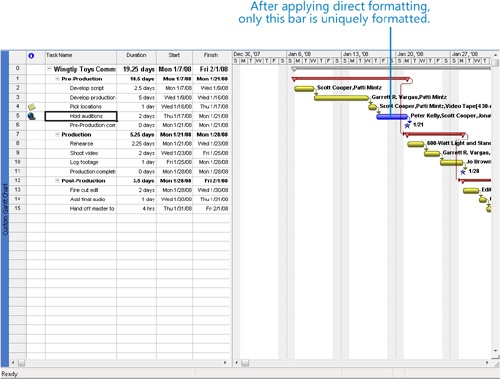
Here you can see the effects of the Standard: Style 4 formatting applied to the project plan. Note that none of the data in the project plan has changed; only the way it is formatted has changed. These formatting changes affect only the Custom Gantt Chart view; all other views in Project are unaffected.
Next, you will format an individual Gantt bar. You’d like to give more visual attention to the Gantt bar for the Hold auditions task.
Click the name of task 5, Hold auditions.
On the Format menu, click Bar.
On the Bar Shape tab, under Middle, click the Color box.
Click Blue, and then click OK.
Project applies the blue color to the Task 5 Gantt bar.
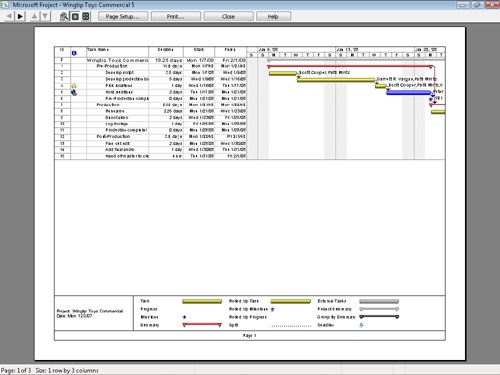
To conclude this exercise, you will preview the Custom Gantt Chart view. What you see on the screen closely approximates what you’d see on the printed page, and you’ll verify this now.
On the File menu, click Print Preview.
Project displays the Custom Gantt Chart view in the Print Preview window. You will do more work in the Print Preview window later in this chapter and in Chapter 11.
On the Print Preview toolbar, click Close.
You can now print the project plan if desired, but previewing it is adequate for the purposes of this chapter. When printing in Project, you have additional options in the Print dialog box, which you can open by clicking the Print command on the File menu. For example, you can choose to print a specific date range of a timescaled view, such as the Gantt Chart view, or you can print a specific page range.

Drawing on a Gantt Chart
Project includes a Drawing toolbar with which you can draw objects directly on the chart portion of a Gantt chart. For example, if you would like to note a particular event or graphically call out a specific item, you can draw objects, such as text boxes, arrows, and other items, directly on a Gantt chart. You can also link a drawn object to either end of a Gantt bar or to a specific date on the timescale. Here’s how to choose the type of link you need:
Link objects to a Gantt bar when the object is specific to the task the Gantt bar represents. The object will move with the Gantt bar if the task is rescheduled.
Link objects to a date when the information the object refers to is date sensitive. The object will remain in the same position relative to the timescale no matter which part of the timescale is displayed.
Tip
If the Drawing toolbar does not have the type of item you would like to add, you can add bitmap images or documents using the Object command on the Insert menu.
In this exercise, you display the Drawing toolbar and add a text box to the Custom Gantt Chart view.
On the View menu, point to Toolbars, and then click Drawing.
The Drawing toolbar appears.
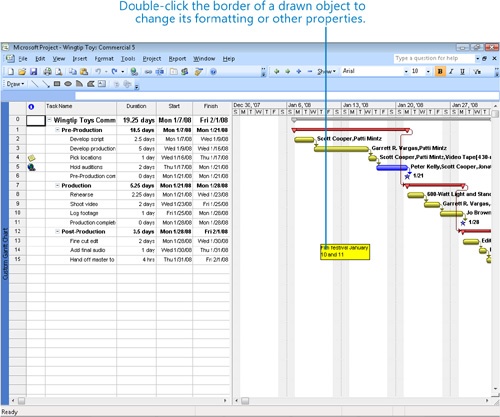
On the Drawing toolbar, click the Text Box button, and then drag a small box anywhere on the chart portion of the Custom Gantt Chart view.
In the box that you just drew, type Film festival January 10 and 11
On the Format menu, point to Drawing, and then click Properties.
The Format Drawing dialog box appears.
Click the Line & Fill tab if it is not already selected.
In the Color box under the Fill label, click Yellow.
Next, you’ll attach the text box to a specific date on the timescale.
Click the Size & Position tab.
Make sure that Attach To Timescale is selected, and in the Date box, type or click 1/10/08.
In the Vertical box under Attach To Timescale, type 2.75 (this is the number of inches below the timescale where the top of the box will be positioned), and then click OK to close the Format Drawing dialog box.
Project colors the text box yellow and positions it below the timescale near the date you specified.
Click in an empty area of the Gantt Chart view to unselect the text box.
Because you attached the text box to a specific date on the timescale, it will always appear near this date even if you zoom the timescale in or out or scroll the chart left or right. Had you attached the text box to a Gantt bar, it would move with the Gantt bar if the task were rescheduled. To conclude this exercise, you will hide the Drawing toolbar.
On the View menu, point to Toolbars, and then click Drawing.
The Drawing toolbar is hidden.
Formatting Text in a View
You can format text in tables, such as task names in a Gantt Chart view. There are two distinct ways to format text:
Format whole categories of text in the Text Styles dialog box, which you can open by clicking the Text Styles command on the Format menu. The formatting changes you make to a category (such as milestones or summary tasks) apply to all cases of that category in the active view. You can view the categories for which you can change text formatting in the Item to Change box in the Text Styles dialog box.
Format individual selections of text directly. The formatting changes you make have no effect on other text in the view.
Tip
You might notice some similarities between Project and Word in how you can format text. In Project, style-based formatting (available through the Text Styles command on the Format menu) is similar to applying paragraph styles in Word. Likewise, the direct formatting of text (available through the Font command on the Format menu) is similar to direct text formatting in Word.
As with all formatting options in Project, the formatting changes you make to any view or report affect only that view or report and only the active project plan. Later chapters will introduce methods of copying custom views or reports between project plans.
In this exercise, you switch to a different view and then use text styles and direct formatting to change the appearance of the text in that view.
On the View menu, click More Views.
The More Views dialog box appears, with the current view (the Custom Gantt Chart view) selected.
In the Views box, click Task Sheet, and then click Apply.
The Task Sheet view appears. Unlike Gantt Chart views, this view does not include a chart component; it consists of a single table.
Next, you will change the table displayed in the Task Sheet view.
On the View menu, point to Table: Entry, and then click Summary.
Tip
You also can right-click the Select All button in the upper left corner of the active table to switch to a different table.
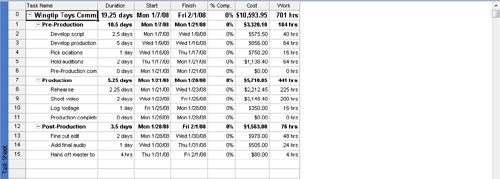
The Summary table appears in the Task Sheet view. Like the Entry table, this table focuses on task details, but it includes a different set of fields. The field of most interest to us now is the Cost field.
Next, you’ll change the way in which Project formats an entire category of information—in this case, summary tasks.
On the Format menu, click Text Styles.
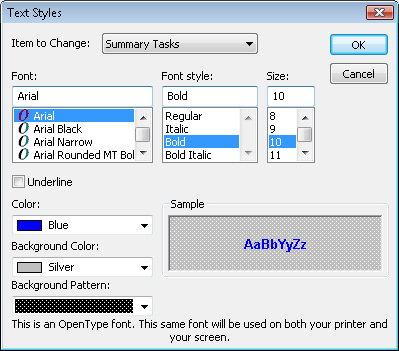
The Text Styles dialog box appears.
On the Item to Change list, click Summary Tasks.
The current format settings of summary tasks appear in the dialog box, and a preview appears in the Sample box.
Next, you will change the formatting so that the summary task text stands out.
In the Size box, click 10.
In the Color box, click Blue.
In the Background Color box, click Silver.
In the Background Pattern box, click the dark dot pattern at the bottom of the drop-down list.
Click OK.
Project applies the new format settings to all summary task text in the project (except for the project summary task, which appears separately on the Item To Change list). Any new summary tasks added to the project plan will also appear with the new formatting.
The format changes you’ve made apply only to the active view (in this case, the Task Sheet view) and not to the table. If you displayed the Summary table in the Gantt Chart view, for example, these format changes would not appear there.
To conclude this exercise, you will apply direct formatting to a specific item in a view. As with styles in Word, you can use direct formatting in conjunction with text style formatting. In this project plan, you’ll apply italic formatting to the production phase’s cost.
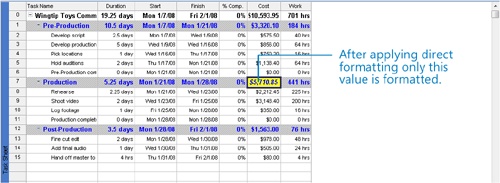
In the Summary table, click the Cost field for task 7, the Production summary task.
On the Format menu, click Font.
The Font dialog box appears, which is similar to the Text Styles dialog box that you worked with earlier. However, the options you choose here apply only to the selected text.
In the Font Style box, click Bold Italic.
In the Background Color box, click Yellow.
Click OK.
Project applies bold italic and background color formatting to the Cost field of task 7.
Troubleshooting
You can remove direct formatting that’s been applied to text and restore that text to the formatting defined by the Text Styles dialog box (Format menu). First, select the cell containing the formatted text. Next, on the Edit menu, point to Clear, and click Formats.
In conclusion, use the Text Styles command on the Format menu to change the formatting of entire categories of information, such as all summary tasks. When you want to reformat a specific item (such as the cost value of one task) to draw attention to it, use the Font command on the Format menu. Note that the Font command is not available in some views, such as the Calendar view.


Formatting and Printing Reports
Reports are intended for printing Project data. Unlike views, which you can either print or work with on the screen, tabular reports are designed only for printing or for viewing in the Print Preview window. You do not enter data directly into a report. Project includes several predefined task, resource, and assignment reports that you can edit to obtain the information you want.
In this exercise, you view a report in the Print Preview window and then edit its format to include additional information. You will work with visual reports, a new feature introduced with this release of Project, in Part 2.
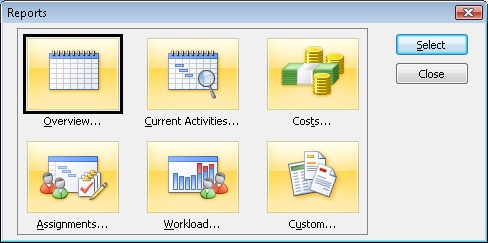
On the Report menu, click Reports.
The Reports dialog box appears, showing the categories of reports available.
Click Overview, and then click the Select button.
The Overview Reports dialog box appears, listing the five predefined reports in Project that provide project-wide overview information.
In the Overview Reports dialog box, click Project Summary, and then click Select.
Project displays the Project Summary report in the Print Preview window. This is a handy summary of the project plan’s tasks, resources, costs, and current status. You could use this report, for example, as a recurring status report that you share with the clients or other stakeholders of the project.
Depending on your screen resolution, the text in the report might not be readable when you view a full page.
In the Print Preview window, click the upper half of the page with the mouse pointer.
Project zooms in to show the page at a legible resolution.
At this point in the project life cycle, the most pertinent pieces of information in the report are the planned start and finish dates and the total cost. If any of these values did not fit within the expectations of the project sponsor or other stakeholders, now would be a good time to find out this information.
On the Print Preview toolbar, click Close.
The Print Preview window closes, and the Reports dialog box reappears.
Next, you will preview and edit a different report. For a small, simple project such as the TV commercial, a report is a simple way to communicate assignments to the resources involved. To do this, you will work with the Who Does What When report.
Tip
This tip describes enterprise project management (EPM) functionality. For more detailed projects, communicating resource assignments (and subsequent changes) as well as other project details can be a significant responsibility for a project manager. Project Server offers an intranet-based solution for communicating such project details in conjunction with Project Professional. For more information, see Part 4.
Click Assignments, and then click Select.
The Assignment Reports dialog box appears, listing four predefined reports in Project that provide resource assignment information.
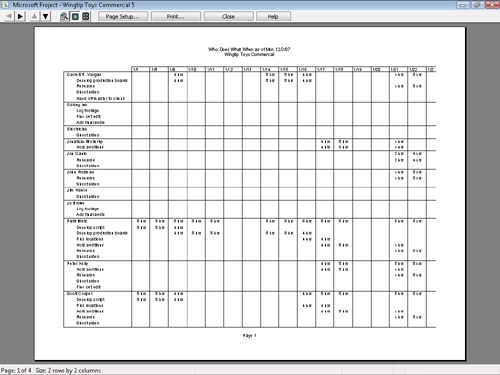
In the Assignment Reports dialog box, click Who Does What When, and then click Select.
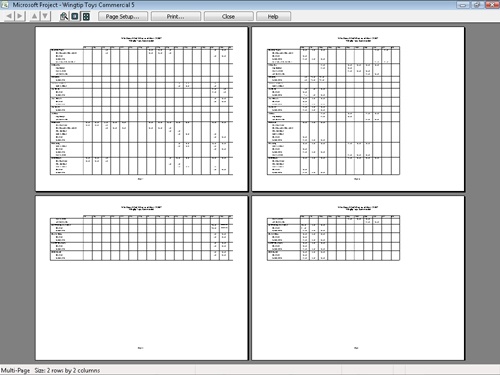
Project displays the first page of the Who Does What When report in the Print Preview window.
Note that the status bar message informs you that this report spans four pages. To get a broader view of the output, you will switch to a multipage view.
On the Print Preview toolbar, click the Multiple Pages button.
The entire report appears in the Print Preview window.
To conclude this exercise, you will customize the header that appears at the top of each printed page so that it includes a logo graphic.
On the Print Preview toolbar, click the Page Setup button.
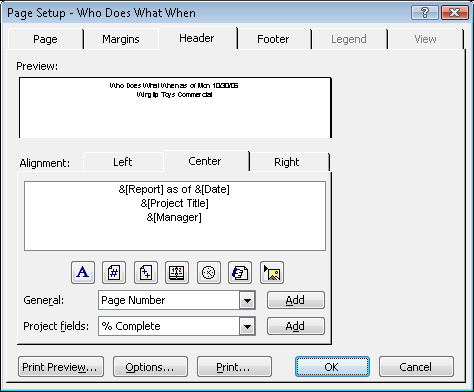
The Page Setup dialog box for the Who Does What When report appears.
Click the Header tab.
As you can see in the Preview and Alignment boxes, codes such as &[Date] determine the specific text that appears in the header. You will add a logo to the left side of the header.
Next to Alignment, click the Left tab.
As with all regions of the header and footer, you can insert standard elements, such as page numbers, as well as any Project field. In this exercise, you’ll insert a logo graphic that’s supplied for you.
Click the Insert Picture button.
Navigate to the Chapter 5 Simple Formatting folder and double-click the Logo file.
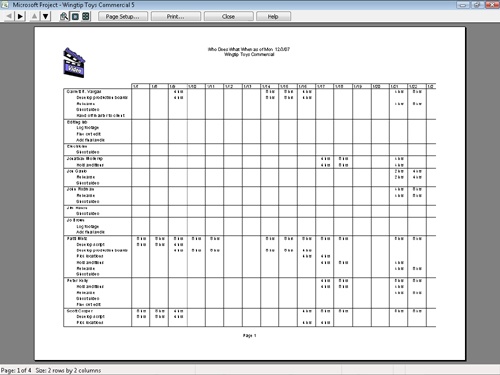
The logo image appears on the left side of the header in the Page Setup dialog box.
Click OK to close the Page Setup dialog box.
The updated header appears on each page in the Print Preview window.
For a closer look at the updated header, on the Print Preview toolbar, click the One Page button.
Project displays the first page of the report.
On the Print Preview toolbar, click Close.
Click Close again to close the Reports dialog box. The Task Sheet view reappears.

Key Points
To format whole categories of Gantt bars, you can use either the Bar Styles dialog box or the Gantt Chart Wizard, both found on the Format menu. To format individual Gantt bars, use the Bar command on the Format menu.
You can redefine the formatting of a built-in view, or copy a view first and then reformat it.
You can draw or insert graphic objects on the chart portion of a Gantt chart view, but not on the table portion.
Reports are intended for print-previewing or printing only; you cannot enter or edit data directly in a report.