
Power Line Communication Electromagnetic Compatibility Regulations
CONTENTS
6.2 Creation of EMC Regulations
6.4 Broadband PLC Feeding Levels
6.4.4 Feeding Level Comparison
6.5 PSD Masks in BB-PLC Specifications
This chapter introduces power line communication (PLC)-related electromagnetic compatibility (EMC) regulations worldwide. In particular, it introduces the feeding levels used in the PLC capacity and throughput analysis found in Chapter 9.
Regulations are one of the fundamental means to enable or simplify business and the exchange of products. Early civilisations in China, Egypt, Greece, India and the Roman Empire had established regulations. Weights and measures were regulated first; currency was probably the next issue where people felt harmonisation to be mandatory. Historically, only non-competitive producers created trade barriers to protect their market. Furthermore, non-transparent regulations tend to favour cheats. With the formation of the EU, there is a movement to deregulate national laws to enable seamless transit of people, products and services. Deregulating national laws requires agreement on an international level, which is not easily negotiated in most cases. Globally operating organisations, like the International Organization for Standardization (ISO), the International Electrotechnical Commission (IEC) and the International Telecommunication Union (ITU), create standards to harmonise products. ISO focuses on mechanical engineering, IEC focuses on electric and electronic technologies and ITU addresses various forms of telecommunication. Each international organisation is mirrored by local committees. For example, the Comité Européen de Normalisation (CEN, in English: European Committee for Standardization) mirrors ISO. The Comité Européen de Normalisation Électrotechnique (CENELEC, in English: European Committee for Electrotechnical Standardization) mirrors IEC and the European Telecommunications Standards Institute (ETSI) mirrors ITU. In addition, there are national organisations like the Deutsches Institut für Normung (DIN) and the Deutsche Kommission Elektrotechnik (DKE) in Germany that delegate their experts to the international committees, often also submitting proven national proposals to a larger audience.
Market introduction of a new product requires a certification process. In the United States, this is called the ‘FCC marking’ (FCC for Federal Communications Commission). In Europe, this process is called ‘CE marking’ (CE for Conformité Européenne). Generally, the manufacturer declares that the product conforms to the essential applicable requirements, for example, European Commission (EC) directives. In addition to several other tests, EMC is verified, which examines the immunity and level of interference caused by a device. An immunity test, for example, of a TV, ensures the safety of the users in the room, should the rooftop antenna be struck by lightning. Emission tests basically guarantee that all devices in the vicinity of the product operate as intended. EMC tests are standardised by the Comité International Spécial des Perturbations Radioélectriques (CISPR, in English: Special International Committee on Radio Interference) which is part of the IEC. Additionally, the ITU can issue EMC-related recommendations.* Usually, all nations follow the EMC standards from CISPR. Of course, there are exceptions: for example, in the case of PLC EMC in the United States and JP, national authorities specified individual processes.
Historically, shortly after S. Morse sent his message over a telegraph line between Washington and Baltimore in 1844, the demand for borderless communications arose and the ITU, founded in 1865 – at that time called the International Telegraph Union – was the first international organisation to fill that gap. Standardisation is an obviously successful practice because – we can remember – 15 agreements were required in Prussia to link Berlin and frontier localities by telegraph. Since the invention of information transmission, engineers have continuously been challenged to find new, creative means for enhancing generation and transmission of power. The foundation was laid by W. von Siemens in 1866 with the invention of the dynamo. It was soon found in engines, trains, elevators, etc.
Communication (low-voltage [LV] signalling) and high-power applications have the potential to cause interferences if EMC is not regulated. The first ‘EMC regulation’ was established in Prussia in 1892, according to [1]. It clarified that establishing and operating telegraph equipment is only allowed by authorities, and in the case of interference, placed the cost of eliminating interference on the owner of the most recent installation. In 1908, the law was amended to also regulate wireless transmissions. The first interference complaints occurred in innovative cities in the 1890s, where tramcars and telegraph links had been installed. The next complaints arose when railway signalling lines were influenced by power transmissions. Soon railway operators, energy utilities and telecommunication suppliers were seeking regulations. Medical radiation therapy equipment emerged as a source and sink of EMC issues. The world’s first commercial radio station was created by the Westinghouse Electric Corporation in 1920 in Pittsburgh, Pennsylvania, United States. Since then, the electromagnetic interference (EMI) of tramcars frequently interrupted radio broadcast services. Also in the 1920s, rotary dial phones converted an EMC victim to an EMC source. In these early days, power transmission lines were also used for transmitting radio programmes. In Norway, this technique was called Linjesender, and the radio programme was fed into the lines by special transformers. Filters for carrier frequencies used by transmission systems were installed in substations and at line branches, in order to prevent uncontrolled propagation. It is probable that the EMC of electric engines stopped this technology. The short-wave (SW) radio receivers use the mains as counterpoise to the monopole whip antenna. When utilising one and the same media for various applications, of course EMC has to be considered with great care. In World War II, another EMC source and sink found widespread installation: the radar. The transistor – developed by the Bell Labs in 1947 – launched the success of microelectronics and all kinds of EMC sources and victims. One of the most dramatic interference sources was found in 1964, when the lights in Hawaii, 1445 km away, had been switched off due to a high-altitude nuclear test called Starfish Prime [1].
Aside from PLC, the ‘Digital Dividend’ (new frequency split between mobile Internet service providers and TV broadcast) and emissions from light-emitting diode (LED) illuminations keep EMC experts busy today. The end user detects an obvious EMC issue when a mobile phone operates in the vicinity of a speaker device. The interruptions in the mobile signal transmission fall into the audible frequency range and are detectable by human ears. Here, market surveillance authorities do not take initiative, possibly because the issue might be solved by placing the mobile phone in a different location.
6.2 Creation of EMC Regulations
Whenever there is a new EMC issue, regulatory committees might be requested, through a New Work Item Proposal (NWP), to solve the problem. A national mirror committee has to submit the NWP, for example, to the IEC, and other nations are needed to support the submission. If the NWP is accepted, issues of political interest are represented in a newly founded group. Typically, there are industry representatives who source the interference, device manufacturers or service providers of the electromagnetic sinks, national authorities, measurement device manufacturers, universities (in case of academic interest) and many consultants who seem to monitor the process. Finding a compromise is usually as difficult as mediating a married couple. There is always the question whether the immunity threshold of one side is too low or the emission level of the other is too high and adaptive/cognitive compromises might, in some cases, be the way forward. In the human case, such adaptations are possible in the time or location domain. Technically, the frequency domain is also usable. An example of adaptations already approved by ETSI and CENELEC can be studied in Chapter 22, which deals with dynamically notching parts of the PLC frequency spectrum.
The classical concept of EMC requires constant emission and immunity limits against high-frequency (HF) signals. The emission limit and their own immunity threshold define the operating range of all devices. Devices working within this range operate without producing any serious interference in their environment. This classical concept of guaranteeing EMC as shown on the left side of Figure 6.1 has the drawback that some resources are left unused. Furthermore, devices need costly shielding or isolations, even though there are often no signals causing disturbance. The device is shielded against a broad range of frequencies independent of where and when the device is operated. In short, the resources are not used efficiently.
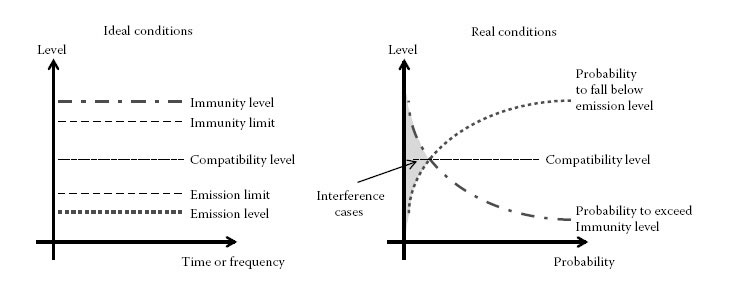
FIGURE 6.1
EMC coordination, ideal and real conditions.
In some cases, the reception of a low-power signal is disturbed despite the fact that surrounding devices comply with the relevant EMC standards. Unfortunately, this is the actual situation, shown on the right side in Figure 6.1. In rare cases, interference issues might occur when the immunity level is below the emission level. From both an economic and a technical point of view, this is not satisfactory. In this case, stricter limits should have been chosen. Alternatively, these rare cases can be avoided with adaptive behaviour at the device and it is expected that more adaptive approaches will be developed in the near future.
Whenever a proposal, which is likely to be accepted, is made to the EMC committees, there is the question how to integrate it into the existing world of EMC documents. An engineer would describe the new solution technically in an innovative way. Due to the profound approval process of EMC standards (national entities, who frequently do not join the discussions in the EMC committee, have to agree), innovative solutions are difficult to explain to all decision makers. This is why minor or minimal progress is made, as the new version of a document boasts only minute amendments. Many ‘gives’ and ‘gets’ need to be exchanged enriching the final document by multiple extras, initially unplanned and in the worst case technically ambiguous. The base of regulation documents has also historically grown with the risk of including inconsistencies. For instance, CISPR 16 [2] specifies the common-mode (CM) voltage (Vcm) in an electric network to be half the vector sum of Va and Vb, that is, (Va + Vb)/2, where Va is the vector voltage between one of the mains terminals and earth and Vb is the vector voltage between the other mains terminal and earth. CISPR 22 [3] specifies Vcm to be the voltage appearing across the CM impedance presented to the equipment under test (EUT) by an impedance stabilisation network (ISN). If the EUT is a PLC modem, the ISN is intentionally not implemented fully symmetrically, resulting in the two definitions from CISPR 16 and CISPER 22 not matching. Nevertheless, both standards have to be adhered to at the time of product certification for information technology equipment connected to and powered by the electrical mains network.
When modifying the existing documents, it has to be considered that the collection of current EMC regulations dates back to the days of our grandfathers. Changing any value or measurement method usually has several side effects where even the experienced delegates no longer remember the foundation of the status quo. Of course, this does not simplify compromise. For instance, the approach enhancing CISPR 22 by PLC in [4] was one of the main challenges of the CISPR project team power line telecommunications (PT PLT). However, CENELEC found faster agreements after deciding to draft a dedicated product standard for PLC.
6.3 PLC-Specific Regulations*
Power line cables were not designed to carry communication signals and, hence, give rise to conducted emission, as well as radiated emission that may interfere, for example, with Amateur Radio or radio broadcast receivers. When looking at power line EMC regulations, one may distinguish between regulations for narrowband (NB)-PLC and broadband (BB)-PLC.
The NB-PLC regulations deal with a spectrum from 3 kHz up to around 500 kHz. Important NB-PLC regulations are listed in Table 6.1. As a subset of all other bands, CENELEC bands are the only ones available on a global basis. Four CENELEC bands are defined as A (9–95 kHz), B (95–125 kHz), C (125–140 kHz) and D (140–148.5 kHz) [5]. Aside from specifying transmission limits and their measurement procedures, the CENELEC standard also mandates that the A-band only be used by electricity suppliers and their licensees, while the other bands may be used by consumers. Further, devices operating on the C-band have to comply with a carrier sense medium access/collision avoidance (CSMA/CA) protocol that allows a maximum channel holding period of 1 s, a minimum of 125 ms between channel uses by the same device and a minimum of 85 ms before declaring the channel idle. In the United States, there are currently ongoing efforts [6] to specify the band from 9 to 534 kHz for NB-PLC operations with a mandatory CSMA/CA protocol compliant with CENELEC EN 50065-1 [5]. The advantages are that equipment manufacturers would easily be able to adapt their NB-PLC products to the EU and US markets and to many other markets that follow these standards. Specific details on current ITU and IEEE NB-PLC standard-related band plans and power masks may be found in Chapter 11.
Important Regulations Related to NB-PLC
States |
Frequency [kHz] |
Institution |
Reference |
EU |
3–148.5 |
CENELEC |
[5] |
United States |
10–490 |
FCC |
[7] |
JP |
10–450 |
Association of Radio Industries and Businesses (ARIB) |
[8] |
Source: Berger, L.T. and Iniewski, K., Eds., Smart Grid – Applications, Communications and Security, John Wiley & Sons, Hoboken, NJ, April 2012, ch. 7, ISBN: 978-1-1180-0439-5. Copyright © 2012 John Wiley & Sons. With permission.
Looking at BB-PLC, one may again distinguish between two frequency ranges, that is, 1–30 MHz, where conducted emission is the focus of regulation (except for the United States), and 30–100 MHz, where the focus shifts to radiated emission. A technical reason for establishing this division at 30 MHz is the size limitation inside anechoic chambers. Toward lower frequencies, the wavelength gets so long that far-field (FF) conditions can no more be realised. Emission tests record below 30 MHz only the magnetic component or H-field. Above 30 MHz, the electrical wave or E-field is considered. Surprising is the 30 MHz threshold to be this sharp without any transition period. It is interesting to note that for immunity testing, the threshold is at 80 MHz.
The goal of the conducted emission test setup is to represent the properties of any field network in a static and reproducible way in the test lab. Therefore, ISN [2] and an Artificial Mains Network (AMN) [3] are specified in the CISPR documents. The level of CM signals inside the network should be verified when assessing the EMI potential of a device. An ISN creates a defined amount of CM signal which should be of similar magnitude as the CM signals in the field. Figure 6.2 illustrates the idea behind the ISN. PLC modems create a differential signal feed to the mains. Even minimal parasitic elements (denoted ZPara in Figure 6.2) generate a CM signal launched by the PLC modem. The ISN provides a specified differential-mode (DM) impedance (ZDM), CM impedance (ZCM) and the level of asymmetry called longitudinal conversion loss (LCL) [11]. The LCL is the ratio between the symmetrical and asymmetrical signals in a network. This LCL level can be adjusted by selecting the impedance of the series or shunt asymmetry resistors (denoted ZAsym series and ZAsym shunt in Figure 6.2). The internal realisation of an ISN is implementation specific. CISPR 22 only describes the ISN’s outside parameters like impedances and LCL. Implementing a ZAsym series allows a higher feeding level at identical ISN outside parameters than the usage of ZAsym shunt. The CM choke prevents the CM signal from being influenced by the outside and the DM choke blocks DM signals not being shortcut by ZCM. The CM signal generated by the ISN from the injected DM signal is called the ‘converted’ CM current. For PLC, the converted CM signals are dominant compared to the launched CM signals. Signals passing ZCM toward ground are used for assessing the interference potential of the device under examination. Components needed for safety or blocking the AC mains signal are not shown in Figure 6.2.
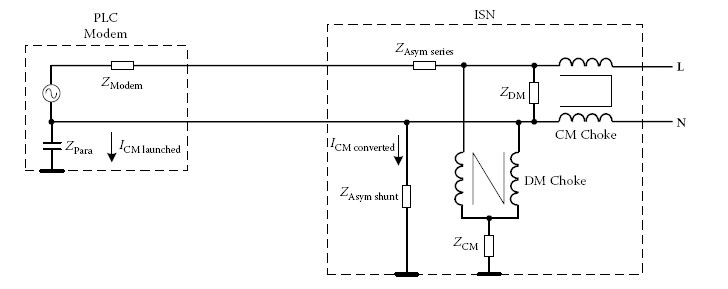
FIGURE 6.2
Principle of an ISN-based conducted emission test setup.
CISPR I PT PLT [4] was making efforts to regulate BB-PLC-generated interference. At the beginning, CISPR 22 [3] defined two sets of limits and measurement methods for conducted emissions of telecommunication equipment. One set was defined for the telecommunication port and the other was defined for the mains port. For PLC modems, it is not defined whether the PLC signal port, which at the same time is used for power supply, is considered a mains or a telecommunication port. The early versions of CISPR 22 were written without PLC applications in mind. The method for telecommunication ports respects the symmetry properties of an attached cable.
Asymmetries like an open light switch or asymmetrical parasitic capacitances convert the symmetrically fed signals into CM signals (see Chapter 1 for details). However, the method used for devices connected to the mains, specified in CISPR 16 [2], is based on measuring the asymmetric voltage level of either the phase or neutral wire to the ground. From the perspective of a PLC modem, this is the worst case, because this voltage consists of asymmetric and symmetric voltage, that is, not only the emission and there with the interference relevant part, but also the desired signal is measured and compared against limits.
IEC CISPR/I/89/CD [12] tried to clarify the situation by interpreting PLC as an application following the telecommunication limits of CIPSR 22. Therefore, the LCL parameter was used in an identical way as, for example, in the testing of digital subscriber line (DSL) equipment.
The benefit of using the LCL parameter is the simplicity of measuring it. It is a reflection parameter whose measurement requires equipment to be connected to only one location of the grid. Other options for verifying the potential of interference would have been to place antennas and measure the field generated by the fed PLC signal as done, for example, during the FCC marking process in the United States. However, this would make a field measurement setup significantly more cumbersome and difficult to reproduce. Nevertheless, with respect to highly attenuated wires like the power lines the simple LCL measurement of a reflection parameter as in CISPR 22 [3] only describes the local situation instead of giving detailed insight of what is happening if a PLC signal travels deeply into the electrical network. Here, the Transverse Conversion Transfer Loss (TCTL) [11] would have been the better approach from an engineering point of view but the LCL was already introduced to the CISPR EMC universe and, hence, this measure was adopted by CISPR I PT PLT [4]. In 2008, CISPR/I/257/CD [13] was published with an LCL parameter reduced by 6 dB. Simultaneously, CISPR/I/258/DC [14] indicated that mitigation techniques like cognitive notching for PLC modems [15,16] and dynamic transmit power management [17] are the compromises to solve the never-ending EMC discussions, and new adaptive approaches started to become integrated into EMC documents.
CIS/I/301/CD [18] answered the question whether PLC is connected to the telecommunication or the mains port, specifically defining a PLT port. In this document, the adaptive EMI mitigation techniques are specified as normative. However, CISPR never proposed a committee draft for voting (CDV). This is why CENELEC became active after the lifetime of the CISPR committee, to find at least in Europe, an acceptable solution. The result, FprEN 50561-1:2012 [17], was approved in November 2012 with national committees’ acceptance of 91%. The document specifies the following:
• An emission measurement procedure at the PLT port while no communication takes place.
• A second measurement procedure at the PLT port when communication takes place. Here the signal level fed by a PLC modem is recorded and the symmetrically injected signal level is verified. Signals converted to CM using any LCL parameter as done by previous CISPR documents are no longer relevant for the assessment of the PLC signal level.
• Permanent notching of certain parts of the radio spectrum, that is, related to amateur radio and aeronautical bands.
• A procedure for adaptive notching, meaning that the PLC equipment senses the presence of radio services and notches the affected frequencies for its own operation (see also Chapter 22).
• A procedure of adaptive transmit power management, meaning that the transmitting equipment limits its transmit power as a function of channel attenuation and noise to a level below the allowed maximum, that is just sufficient to achieve the required data rate.
The approval of EN50561-1:2012 finally gives certainty to PLC stakeholders of European interference limits. In the United States, the FCC is in charge of regulating electromagnetic emissions. In general, all digital equipment has to comply with the FCC part 15 standard (47 CFR §15) [7]. Specifically, Access PLC systems over medium-voltage (MV) and LV power lines, and for a frequency range from 1.705 to 80 MHz, are treated in the standard’s Section G. Conducted emission limits are explicitly not applicable but radiated emission limits are imposed through a transmit power spectral density (PSD) mask. Additionally, PLC systems have to be able to notch certain frequencies that might be used by other services. Further, the FCC defines excluded bands where no PLC signal will be injected, as well as geographical exclusion zones where no Access PLC systems may be deployed. Further, procedures in which service providers inform about prospective PLC Access deployments as well as complaint handling procedures are a requirement. More details on PLC EMC regulations as well as conducted and radiated interference measurement results can be found in [19,20]. Also, the ‘IEEE Standard for Power Line Communication Equipment – Electromagnetic Compatibility (EMC) Requirements – Testing and Measurement Methods’ [21] was released, intending to provide an internationally recognised EMC measurement and testing methodology. It endorses, among others, CISPR 22 and FCC part 15 as normative references, but does not establish any emission limits itself. Looking at the developments in CISPR/CENELEC, as well as at FCC part 15, it becomes clear that the next generation of PLC equipment will have to be highly configurable to apply PSD shaping masks, as well as adaptive notching.
6.4 Broadband PLC Feeding Levels
Frequently, the feeding level of a PLC modem is given as PSD, for example, in V2/Hz as in Chapter 2 or dBm/Hz as in Chapter 9. The power unit is used, because modems are connected to weak impedance networks. Chapter 5 shows the input impedance at an outlet to vary between about 10 Ω and hundreds of Ω. If at some frequencies a current and at other frequencies voltage is fed into the grid, power is the best unit to describe both situations. If the PLC modem is connected to a reproducible environment as described in CISPR or CENELEC documents, where an ISN provides a given impedance, then the specification of current or voltage would be free of ambiguity. On the median, the symmetrical input impedance ZDM of a pair of wires at an outlet is around 100 Ω [15] in the frequency range 1 MHz < f < 30 MHz. In view of a multiple-input multiple-output (MIMO) PLC modem, this impedance exists on all three wire pair combinations (see Chapter 5).
The conversion factor CFdBm2dBμV from dBm to dBμV is given in logarithmic representation as
(6.1) |
In the time domain, PLC modems send bursts of data with an unknown duty cycle. Spectrum analysers offer a wide selection of detectors to record time variant data: peak, quasi-peak, root mean square (RMS), average and sample. The selection of the detector influences the measured results.
Using the sample detector, the result is hardly reproducible because it could be any value between the min and max values which is captured. The peak detector is the most conservative as it only records the signal peak value, ignoring any quiet signals within the sample interval. However, this detector is also the one delivering most reproducible results, because parameters like the actual transmitted data payload do not influence results, which conversely is the case when using alternative detectors. The average detector weights periods with signals and without signals equally. Finally, quasi-peak and RMS are in between peak and average with a weighting factor specified in the standards for measurement receivers and spectrum analysers CISPR 16-1-1 [2].
All the CISPR approaches [11,13,18] use average and quasi-peak detectors. This is owed to the history of CISPR documents. FprEN 50561-1:2012 [17] introduced the peak detector for PLC measurements for the first time.
In analogue receivers, the psychophysical annoyance of the interference interpreted by humans gives parameters to define a weighting factor. The quasi-peak detector was invented to cover this subjective effect for amplitude-modulated (AM) services. Nevertheless, the subjective effect depends on whether the receiver is acoustic or visual.
In digital receivers, the interference is measured by the bit error rate (BER), which is minimised by error correction codecs. Both noise and signal levels are compared in order to calculate the theoretical channel capacity as in Chapter 9. Here, a digital communication signal protected with forward error correction (FEC) is compared to a noise signal recorded with a spectrum analyser. None of the available detectors weights both levels correctly. The average detector was chosen for these calculations because of its balanced weighting of periods with and without signals. Compared to quasi-peak, the average detector is also fast and useful for sweep measurements when, for example, recording the noise. In the following, the conversion from several regulatory limits specified with quasi-peak detector to average value is done by subtracting 8 dB. This value can be found in an experimental setup using a spectrum analyser.
The level of a signal with the property of a rectangular spectral shape like in orthogonal frequency division multiplexing (OFDM) is frequently described using a spectral density. If it is a power signal, it is the PSD in dBm/Hz. Technically, a PSD in dBm/Hz cannot be measured (even if many spectrum analysers provide results using this unit) because the PSD is the power in an infinitely small bandwidth (BW), that is, the derivation ∆P/∆BW. If the BW becomes infinitely small, the question of which measurement detector is applied becomes obsolete, as there is no more variance in the signal. However, simultaneously the measurement time goes to infinity.
For simplification, the PSD is calculated by subtracting the resolution BW (ResBw) from the power without applying any weighting window. For instance, for a measured power P = 1 mW using a resolution BW ResBw = 9 kHz, the PSD is given by
(6.2) |
In the frequency range below 30 MHz, a resolution BW of 9 kHz is used CISPR 22 [3]. Still this calculation is a theoretical one, because the measurement device has to use a detector and a detector with a weighting window with vertical slopes in the frequency domain cannot be implemented.
In the United States, [22,23] specify how emissions from PLC devices are evaluated. The documents call PLC a broadband over power line (BPL) system, a new type of carrier current technology. The emission limits (the numbers can be found in FCC 15 [24] §15.209) are given in 1.705 MHz < f < 30 MHz in a radiated field strength of Ef < 30 MHz @ 30 m = 30 μV/m (= 29.5 dBμV/m, quasi-peak, ResBw = 9 kHz) at a distance of 30 m from the exterior wall of the building. In the band 30–88 MHz, the radiated field is Ef > 30 MHz @ 3 m = 100 μV/m (= 40 dBμV/m, quasi-peak, ResBw = 120 kHz) at a 3 m distance (for Class B devices). The reader has to check FCC 15 [24] §15.31(f) for measurable emissions at distances other than the distances specified. There is a distance extrapolation factor (EF) of EFNF = 40 dB/decade for frequencies where the antenna is located in the near field (NF) below 30 MHz and EFFF = 20 dB/decade in the FF above 30 MHz.
The limit drop when passing the 30 MHz mark can be calculated as
(6.3) |
The question remains, which EF (EFNF or EFFF) should be used when dropping over the 30 MHz line? Looking at the PLC interoperability standards IEEE 1901 [25] and ITU-T G.9964 [26], one can see that the compromise of 30 dB between both EFs was selected without specifying further details.
Class A refers to devices intended to operate in an industrial environment, whereas Class B devices are for use in private homes. Further, FCC specifies Class A limits to apply on MV wires and Class B on LV wires. Usually, Class A devices have limits increased by 10 dB.
Additionally, notches are required to protect aeronautical, mobile and radionavigation services, in some geographical zones extra frequencies have to be excluded, and care must be taken for public safety services. Adaptive interference mitigation techniques are also described by the FCC. For better comparison among individual feeding PSD, these additional notches are not applied to the PSD mask used for the capacity calculations in Chapter 9.
The verification of emissions is done in the field at three typical buildings. The antenna is placed at various locations in the garden. The antenna’s height can be adjusted between 1 and 4 m where the maximum reading has to be recorded or 5 dB added if only the convenient 1 m high is measured.
The PLC modem feeding level may be derived using the coupling factor. The coupling factor is the radiated E-field level of the building minus the level of the symmetrical fed signal into the mains. In Europe, ETSI published several coupling factor measurements [27,28,29]. In the United States, no such exhaustive measurement campaign has been published. This is why the capacity calculations presented in Chapter 9 assume a PSDUS of −50 dBm/Hz (quasi-peak) or −58 dBm/Hz (average).
A wrap-up of regulations on RF emissions from PLC systems in the United States can be found in ITU’s recommendation ITU SM.1879-1 [30].
FprEN 50561-1:2012 [17] limits the maximum PLC transmit signal level between 1.6065 and 30 MHz using a setup with >40 dB attenuation between EUT and the auxiliary equipment to 95 dBμV (average detector). Using Equations 6.1 and 6.2, the modem’s PSD can be calculated as
(6.4) |
Furthermore, in Europe, CENELEC aims to draft an EMC standard for frequencies above 30 MHz, which was decided on the TC 210 [31] meeting in December 2012. The document is not finalised so far. The frequency spectrum below the so-called Band II (the frequency-modulated (FM) radio band, 87–108 MHz; the exact numbers vary from country to country) contains fewer sensitive services for which a protection through frequency exclusion is required. Even so, the number of services to be protected is low and the standardisation work at CENELEC has not been completed. For purposes of the calculation here, a 30 dB reduction is selected for feeding levels from 30 to 86 MHz. However, there still is the open question of justifying this 30 dB step at 30 MHz. When measuring the radiation inside or outside buildings as, for example, shown in Chapter 7, an increase of the interference potential of 30 dB at 30 MHz has never been observed.
As mentioned previously, in all upcoming calculations – for a better comparison of the individual feeding PSD – mandatory notches of aeronautical, amateur radio, emergency services, radio broadcast and the influence of a deep notch for the protection of FM radio are not considered.
The JP limits for PLC transmissions in the HF band apply to the CM current measured at the mains port of a PLC modem. The specified measurement methods used in JP are similar to the concept of CISPR 22. According to ITU SM.1879-1 [30], a JP ISN has the properties of LCL = 16 dB, ZDM = 100 Ω and ZCM = 25 Ω. The modem’s communication signals are assessed by measuring the CM current converted by the ISN from the symmetrically fed levels. However, these properties are not typical for JP buildings. Statistically, the median values found in JP houses are LCL = 35.5 dB, ZDM = 83.4 Ω and ZCM = 240.1 Ω [32]. The chosen LCL value of 16 dB is the 99% worst-case value of the cumulative distribution. Such a low LCL value inside the JP ISN generates a high CM signal. This generated CM signal is by far higher (usually >1000 times) than any CM signal launched by PLC modems under normal deployment, as PLC modems usually benefit using a highly symmetrical implementation. Additionally, the low ZCM value leads to a high CM current in the test setup, much higher than would be the case in any private home. As a result of the selected measurement procedure, the maximum allowed feeding level is reduced.
Furthermore, the limits of the frequencies below and above 15 MHz differ by 10 dB in JP. The CM current ICM must not exceed ICMf < 15 MHz = 20 dBμA (average) at frequencies smaller than 15 MHz and the limit is ICMf > 15 MHz = 10 dBμA above 15 MHz.
The resulting PSD for JP on the test bed (using the JP ISN) depends on the CM impedance of the PLC modem. A typical PLC modem with the size of a human fist might inject
(6.5) |
However, the uncertainty of this measurement method is about 14 dB. This is due to the modem’s CM impedance, which is usually dominated by the size of the modem.
Kitagawa measured the differentially injected current of PLC modems in JP buildings [33]. The atypical parameters selected for the JP ISN and the uncertainty of the measurements cause the CM current in the field to exceed the CM limits at the modems’ verification setup by about 40 dB.
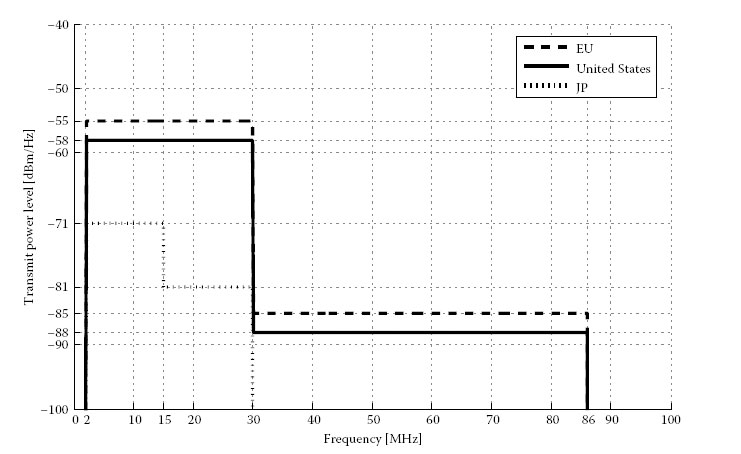
FIGURE 6.3
Transmit PSD masks. The EU limit above 30 MHz is subject to pending regulation.
Also, modems in JP omit frequencies of radio amateurs and some JP HF radio broadcast stations. However, as before, additional notches or extra frequency exclusions are not considered for further calculations. Any PLC transmissions above 30 MHz are also not considered.
6.4.4 Feeding Level Comparison
Based on the derivations and considerations in the previous sections, Figure 6.3 displays the US, EU and JP PSD masks used for the capacity calculations in Chapter 9.
6.5 PSD Masks in BB-PLC Specifications
The PSD masks introduced in the PLC communication standards are only relevant for interoperability, not for product certification. This implies, for example, a receiver must not become overloaded when an adjacent transmitter feeds signals with the given power. The receiver is also prepared not to find any of the information in the notched carriers previously specified in the interoperability standard. Here is a collection of EMC-related parameters of individual standards.
The ITU-T G.hn group specified a PSD mask in ITU-T G.9964 [25], which is shown in Chapter 12. The max PSD has its upper bound at −55 dBm/Hz. The PSD is supposed to be verified with an RMS detector with a ‘maximum hold’ function making it difficult to compare the result against the regulatory rules using average, quasi-peak or peak detectors. However, the ‘maximum hold’ function enhances the reproducibility when measuring the pulse pause–interrupted PLC signals, after waiting several sweeps. The recommendation specifies a network termination of 100 Ω and a minimum receiver input impedance of 40 Ω in 1.8 MHz < f < 50 MHz. It does not recommend any ISN on which the PLC modem, its communication partner device and the measurement receiver are connected. Moreover, ITU-T. 2010. G.9964 [25] allows dynamic reduction of the transmit power and the additional exclusion of frequencies (notches).
Toward the frequencies above 30 MHz, there is a 30 dB step specifying a PSD of −85 dBm/Hz up to 100 MHz. ITU-T. 2010. G.9964 [25] specifies subcarriers above 80 MHz will be masked (zero power transmitted), but without describing any consequences to the PSD mask. Considering that FM radio transmissions in Band II overlap with this definition and taking the FM interference threshold recorded in Chapter 7 into account, there is the risk that PLC modems applying maximal PSD will jam FM radio reception in 25% of the cases.
IEEE standardises the transmit spectrum masks PSD, in IEEE 1901 [25] (see Chapter 13), to be −55 dBm/Hz below 30 MHz and −85 dBm/Hz above 30 MHz. In contrast to ITU-T G.hn, IEEE 1901 applies the quasi-peak detector and limits the transmission up to 50 MHz, thereby providing better FM radio protection. The termination impedance is also 100 Ω. The standard includes a note that these limits apply for Class B devices, whereas access modems might use Class A levels increased by the 10 dB.
Power back-off and notching are also encouraged in IEEE 1901 where the wavelet part optionally specifies a ‘stand-alone dynamic notching’ as described in FprEN 50561-1:2012 [16] and Chapter 22.
The HomePlug AV2 [34] specification (see also Chapter 14) lists a PSD of −50 dBm/Hz recorded using a quasi-peak detector below 30 MHz. The level above 30 MHz is marked as ‘to be defined’ where a special protection for FM radio is foreseen, but not specified in detail. Today, it is the only specification providing a test circuit to measure the individual MIMO feeding levels. The signals of the three wires are recorded sequentially using a 50 O measurement receiver. The total PSD is calculated by summing up the individual levels. The unused wires are also terminated via 50 O to ground while measuring on one line. This results in a 100 Ω termination from one wire to the other. The auxiliary equipment is connected through a channel attenuation network. The throughput rates of HomePlug AV2 modems even benefit when reducing the max transmission level, as explained in Chapter 14. Moreover, the specification allows very flexible notching by digital filtering with minimal loss of transmission resources.
This chapter provided an overview of PLC regulation. The recent development of the EMC standards specifying the signal level to be injected by PLC modems shows the trend to adaptive design concepts resolving interferences at the location, the frequency and the time where the modem is operated. The next discussion on PLC EMC regulation is related to feeding levels in the frequencies above 30 MHz. Here, again, today’s specifications are drafted without PLC in mind, which enables ambiguities when assessing the levels. Protection of FM radio services in the very-high-frequency (VHF) band demands lower thresholds than applied today for AM services in the HF band. Furthermore, impedance modulating devices – appliances that toggle their input impedance synchronously with the AC line cycle [16] – may cause intermodulations of the PLC signal, which might fill up the deep notch originally established for FM protection. Here, another adaptation could solve the problem. Specifically, the PLC modems could pause their transmission during the time when the impedance toggling happens. Today’s PLC modems apply adaptive constellations (see Chapter 9) for their carriers depending on the available, frequency-dependent signal-to-noise ratio (SNR). The estimation of the channel is done continuously over the line cycle and several tone maps (number of bits modulated on each carrier) are applied periodically within a line cycle. Due to these adaptations already implemented, avoidance of the intermodulations could be realised via minimal add-ons.
The work has been partially supported by the Spanish Ministry of Science and Innovation (MICINN) Program INNCORPORA-Torres Quevedo 2011.
1. Anton Kohling, EMV: Umsetzung der technischen und gesetzlichen Anforderungen an Anlagen und Gebäude sowie CE-Kennzeichnung von Geräten, ISBN-10: 3800730944, VDE-Verlag, 2012.
2. CISPR 16-1-1, Specification for radio disturbance and immunity measuring apparatus and methods – Part 1-1: Radio disturbance and immunity measuring apparatus – Measuring apparatus.
3. CISPR, Information technology equipment; radio disturbance characteristics; limits and methods of measurement, ICS CISPR, International Standard Norme CISPR 22:1997, 1997.
Was updated later by
CISPR, Specification for radio disturbance and immunity measuring apparatus and methods. Part 1-1: Radio disturbance and immunity measuring apparatus – Measuring apparatus, 2003. and
CISPR, Amendment to CISPR 22: Clarification of its application to telecommunication system on the method of disturbance measurement at ports used for PLC, 2003.
4. Project Team of Power line Telecommunication at CISPR, Limits and method of measurement of broadband telecommunication equipment over power lines, http://www.iec.ch/dyn/www/f?p=103:14:0::::FSP_ORG_ID,FSP_LANG_ID:3204,25.
5. European Committee for Electrotechnical Standardization (CENELEC), Signalling on low-voltage electrical installations in the frequency range 3 kHz to 148.5 kHz – Part 1: General requirements, frequency bands and electromagnetic disturbances, Standard EN 50065-1, September 2010.
6. National Institute of Standards and Technology (NIST), Priority Action Plan 15 (PAP15), Harmonize Power Line Carrier Standards for Appliance Communications in the Home, Coexistence of narrow band power line communication technologies in the unlicensed FCC band, April 2010, http://collaborate.nist.gov/twiki-sggrid/pub/SmartGrid/PAP15PLCForLowBitRates/NB_PLC_coexistence_paper_rev3.doc (accessed December 2010).
7. FCC, Title 47 of the code of federal regulations (CFR), Federal Communications Commission, Technical Report 47 CFR §15, July 2008, http://www.fcc.gov/oet/info/rules/part15/PART1507-10-08.pdf (accessed February 2009).
8. Association of Radio Industries and Businesses (ARIB), Power line communication equipment (10 kHz–450 kHz), November 2002, STD-T84, Version 1.0 (in Japanese), http://www.arib.or.jp/english/html/overview/doc/1-STD-T84v1_0.pdf (accessed April 2013).
9. L. T. Berger and K. Iniewski, Eds., Wireline communications in smart grids, in Smart Grid – Applications, Communications and Security, Hoboken, NJ: John Wiley & Sons, April 2012, ch. 7, ISBN: 978-1-1180-0439-5.
10. L. T. Berger, A. Schwager and J. J. Escudero-Garzás, Power line communications for smart grid applications, Hindawi Publishing Corporation, Journal of Electrical and Computer Engineering, 2013, [Online] http://www.hindawi.com/journals/jece/aip/712376/ (accessed February 2013).
11. ETSI TR 102 175 V1.1.1 (2003–03); Power Line Telecommunications (PLT); Channel characterization and measurement methods.
12. CISPR/I/89/CD: Amendment to CISPR 22: Clarification of its application to telecommunication system on the method of disturbance measurement at port used for PLC (power line communication), IEC, November 2003.
13. CISPR, CISPR 22 am3 f1 ed. 5.0, Limits and method of measurement of broadband telecommunication equipment over power lines, February 2008.
14. CISPR, Report on mitigation factors and methods for power line telecommunications, February 2008.
15. European Telecommunication Standards Institute, PowerLine Telecommunications (PLT); Coexistence between PLT modems and short wave radio broadcasting services, August 2008.
16. A. Schwager, Powerline communications: Significant technologies to become ready for integration, Dissertation, Universität Duisburg-Essen, Fakultät für Ingenieurwissenschaften, Duisburg-Essen, Germany, 2010, http://duepublico.uni-duisburg-essen.de/servlets/DerivateServlet/Derivate-24381/Schwager_Andreas_Diss.pdf.
17. CENELEC, Power line communication apparatus used in low-voltage installations – Radio disturbance characteristics – Limits and methods of measurement – Part 1: Apparatus for in-home use, November 2012.
18. CISPR, Amendment 1 to CISPR 22 ed. 6.0, Addition of limits and methods of measurement for conformance testing of power line telecommunication ports intended for the connection to the mains, July 2009.
19. The OPEN meter Consortium, Description of current state-of-the-art of technology and protocols description of state-of-the-art of PLC-based access technology, European Union Project Deliverable FP7-ICT-2226369, March 2009, d 2.1 Part 2, Version 2.3, http://www.openmeter.com/files/deliverables/OPEN-Meter%20WP2%20D2.1%20part2%20v2.3.pdf (accessed April 2011).
20. R. Razafferson, P. Pagani, A. Zeddam, B. Praho, M. Tlich, J.-Y. Baudais, A. Maiga, O. Isson, G. Mijic, K. Kriznar and S. Drakul, Report on electromagnetic compatibility of power line communications, OMEGA, European Union Project Deliverable D3.3 v3.0, IST Integrated Project No ICT-213311, April 2010, [Online] http://www.ictomega.eu/publications/deliverables.html (accessed December 2010).
21. Institute of Electrical and Electronics Engineers, IEEE standard for power line communication equipment – Electromagnetic compatibility (EMC) requirements – Testing and measurement methods, January 2011.
22. Amendment of Part 15 regarding new requirements and measurement guidelines for access broadband over power line systems, Report and Order in ET Docket No. 04-37, FCC 04-245, released 28 October 2004, http://hraunfoss.fcc.gov/edocs_public/attachmatch/FCC-04-245A1.pdf.
23. Amendment of Part 15 regarding new requirements and measurement guidelines for access broadband over power line systems; carrier current systems, including broadband over power line systems Memorandum Opinion and Order in ET Docket No. 04-37, FCC-06-113 released 07/08/2006, http://hraunfoss.fcc.gov/edocs_public/attachmatch/FCC-06-113A1.pdf.
24. FCC PART 15 – RADIO FREQUENCY DEVICES, http://www.gpo.gov/fdsys/pkg/CFR-2009-title47-vol1/pdf/CFR-2009-title47-vol1-part15.pdf (accessed March 2013).
25. Institute of Electrical and Electronics Engineers, IEEE Std 1901–2010: IEEE Standard for Broadband over Power Line Networks: Medium Access Control and Physical Layer Specifications, IEEE Standards Association, 2010.
26. ITU-T.2010. G.9964, Unified high-speed wireline-based home networking transceivers – Power spectral density specification.
27. ETSI TR 102 259 V1.1.1 (2003–09); Power Line Telecommunications (PLT); EMI review and statistical analysis.
28. ETSI TR 102 370 V1.1.1 (2004–11); PowerLine Telecommunications (PLT); Basic data relating to LVDN measurements in the 3 MHz to 100 MHz frequency range.
29. ETSI TR 101 562-2 V1.2.1 (2012–02); PowerLine Telecommunications (PLT); MIMO PLT; Part 2: Setup and statistical results of MIMO PLT EMI measurements.
30. Recommendation SM. 1879-1 (09.11), The impact of power line high data rate telecommunication systems on radiocommunication systems below 30 MHz and between 80 and 470 MHz.
31. CLC/TC 210 Technical Committee on Electromagnetic Compatibility, http://www.cenelec.eu/dyn/www/f?p=104:7:4171075401399912::::FSP_ORG_ID,FSP_LANG_ID:814,25 (accessed in March 2013).
32. Ministry of Internal Affairs and Communications (MIC), Report of the CISPR Committee, the Information and Communication Council, June 2006, available only in Japanese, http://www.soumu.go.jp/joho_tsusin/policyreports/joho_tsusin/bunkakai/pdf/060629_3_1-2.pdf (accessed 2006).
33. M. Kitagawa and M. Ohishi, Measurements of the Radiated Electric Field and the Common Mode Current from the In-house Broadband Power Line Communications in Residential Environment, EMC Europe, September 2008.
34. HomePlug Alliance, HomePlug AV Specification Version 2.0, HomePlug Alliance, January 2012.
* Here, the authors frequently have the impression that there is not much communication between IEC and ITU, even though they are located in Geneva across the road. It should be noted that ITU recommendations are not mandatory for product certification.
* Section in parts based on Berger, L.T. and Iniewski, K., Eds., Smart Grid – Applications, Communications and Security, John Wiley & Sons, Hoboken, NJ, April 2012, ch. 7, ISBN: 978-1-1180-0439-5, reproduced with permission of John Wiley & Sons, and Berger, L.T. et al., Hindawi Publishing Corporation, J. Electric. Comput. Eng., 2013, [Online] http://www.hindawi.com/journals/jece/aip/712376/ (accessed February 2013) [10], reproduced with permission from the copyright holders.