
In the Using WFS spatial filters recipe, Chapter 1, Working with Vectors, you created a thematic map by classifying the features contained in the countries layer according to the continent they belong. You used an opaque fill for this map.
However, when dealing with statistical data, it is more appropriate to use a dot density chart.
Note
A dot density chart is an often used way to represent data on a map. For a general introduction, have a look at http://en.wikipedia.org/wiki/Dot_distribution_map.
You will again use the countries layer and will classify features according to population.
- Open the CSS Style section from the GeoServer web interface. Then, select the Choose a different layer link. From the list of layers, select the countries layer.
- Select the link Create a new style. In the form, select the NaturalEarth workspace and insert
DotDensityas the style name. - Replace the code in the textbox with the following snippet:
* { fill: symbol("circle"); stroke: black; -gt-fill-random: grid; -gt-fill-random-tile-size: 100; } :fill { size: 2; fill: brown; } [pop_est < 10E7] { -gt-fill-random-symbol-count: 50; } [pop_est >= 10E7] [pop_est < 10E8] { -gt-fill-random-symbol-count: 350; } [pop_est >= 10E8] [pop_est < 50E8] { -gt-fill-random-symbol-count: 700; } [pop_est >= 50E8] { -gt-fill-random-symbol-count: 1000; } - Press the Submit button and switch to the map preview. Your map should look like the following screenshot:
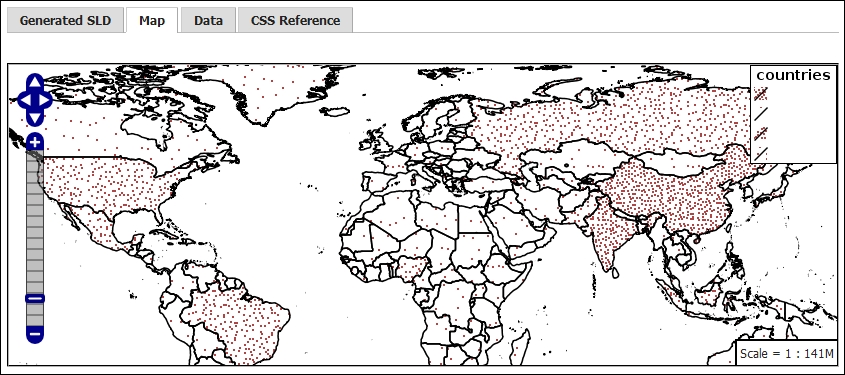
The first part of the CSS code uses the * selector to select all features and set a filling with a common marker, the circle. If you set the color of the outline to black, then two new element properties to discuss appear.
The -gt-fill-random property defines the distribution of the circles inside the polygons. The possible values are none, free, and grid. None disables random distribution, free generates a completely random distribution, and grid generates a regular grid of positions to a grid.
The -gt-fill-random-tile-size property defines the tile size for the texture of the filling, as shown in the following code:
* {
  fill: symbol("circle");
  stroke: black;
  -gt-fill-random: grid;
  -gt-fill-random-tile-size: 100;
}
These two properties are vendor-specific parameters that are available only in the GeoServer rendering engine. Vendor-specific parameters start with -gt-, allowing easy identification of special effects that are not available in other systems.
Then, you set the size and color for the circles that will be drawn inside the polygons:
:fill {
  size: 2;
  fill: brown;
}
After this, you start defining the classes for your map. For the first one, you select the countries with a population lower than 10 million. The number of circles to be drawn in a tile, in this case, is 50. The code is as follows:
[pop_est < 10E7] {
   -gt-fill-random-symbol-count: 50;
}
For the next class, you select countries with a population among 10 and 100 million. For them, you want 350 circles to be drawn in each tile. The code is as follows:
[pop_est >= 10E7] [pop_est < 10E8] {
   -gt-fill-random-symbol-count: 350;
}
Similarly, the other two classes are also composed. To fully understand the tile-size concept, try to zoom in on your map as in this screenshot:
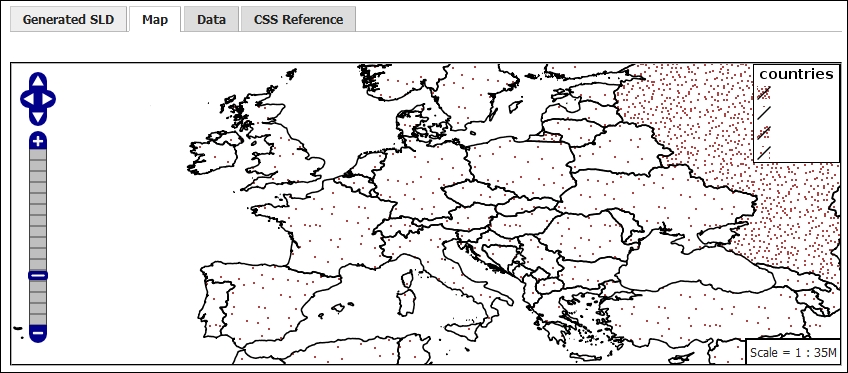
Look at countries like Spain or Ireland, which had just one circle inside their boundaries in the previous screenshot. As the scale changes, the portion of the tile occupied by a country is higher and it has the opportunity to reach its limit. By playing with the tile-size value, you can reach the desired representation.