
In the previous recipe, you learned how to control the requests flow your users send to GeoServer. You may also become interested in monitoring them, for instance, in order to check what the most used services and datasets are.
A low-level approach, and it is the only possible one, is to analyze the GeoServer logs and the web server logs. All requests are in some way tracked there, so it's just a matter of how to find a convenient way to extract and organize them in a structured data model.
Analyzing the logs may be quite challenging. Besides, according to the detail level, you may find too much information or totally miss the piece you are looking for.
Luckily, GeoServer developers have been working on a clever extension that helps you to analyze what requests GeoServer has been receiving. Unsurprisingly, it is called Monitor Extension.
You can find the package listed among the other extension downloads on the GeoServer download page (http://geoserver.org/download/).
Note that in this case, the extension is packaged in two downloads; you need to download both the core and hibernate archive.
- Download the two ZIP archives. Please verify that the version number in the filenames is the same as the GeoServer WAR file you installed.
- Stop your GeoServer instance, and then extract the contents of the ZIP archives into the
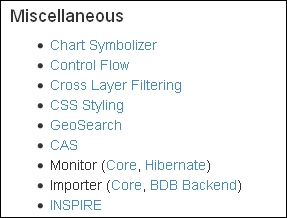
/WEB-INF/lib/directory in the GeoServer webapp. For example, if you have deployed the GeoServer WAR file, you should place the control flow module's JAR file inCATALINA_HOME/webapps/geoserver/WEB-INF/lib/. - After extracting the extension, restart GeoServer in order for the changes to take effect. Open the GeoServer web interface and log in as the administrator. On the left panel, you will see a new section, as shown in the following screenshot:
- The installation also modified your GeoServer data directory. It now contains a folder called
monitoring:$ ls –ag /opt/geoserver_data_dir/monitoring -rw-r--r-- 1 root 521 Jun 20 10:59 db.properties -rw-r--r-- 1 root 396 Jun 20 10:59 filter.properties -rw-r--r-- 1 root 370 Jun 20 10:59 hibernate.properties -rw-r--r-- 1 root 131072 Jun 20 10:59 monitoring.1.log.db -rw-r--r-- 1 root 131120 Jun 20 10:59 monitoring.data.db -rw-r--r-- 1 root 131120 Jun 20 10:59 monitoring.index.db -rw-r--r-- 1 root 100 Jun 20 10:59 monitoring.lock.db -rw-r--r-- 1 root 9352 Jun 20 10:59 monitoring.trace.db -rw-r--r-- 1 root 1232 Jun 20 10:59 monitor.properties
- Open the GeoServer web interface and go to the Layer preview section. Open the OpenLayers preview for some of the configured layers and browse the maps by panning and zooming.
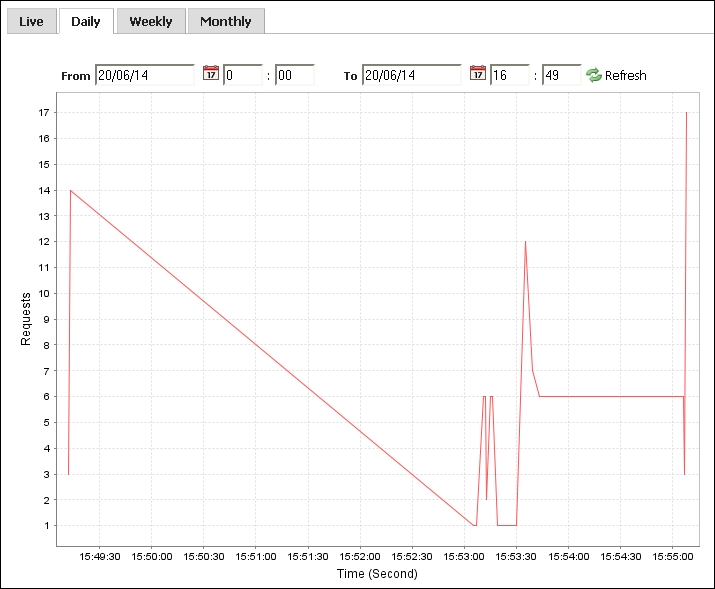
- After a while, turn back to the GeoServer web interface and go to the Monitor section. Open the Activity link, click on the Daily tab, and you should see a graph of requests, as shown in the following screenshot:
The monitoring extension adds a few controllers to your GeoServer.
These objects check each incoming request and save some details for further reference. In fact, you might have noted that the timestamp of the request is saved, and you can produce a graph plotting the number of requests over time.
Besides the timestamp, other details persist and you can, for instance, see a quick view of which service is the most requested.
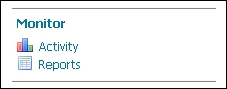
From the GeoServer web interface, go to the Monitor section on the left panel and click on the Reports link.
This is a simple tool to create quick pie charts with statistics about the GeoServer activity:

Click on the OWS Request Summary link to open the preconfigured charts and go to the WMS tab. Here, you will find a chart that represents a proportion of each WMS operation, as shown in the following screenshot:
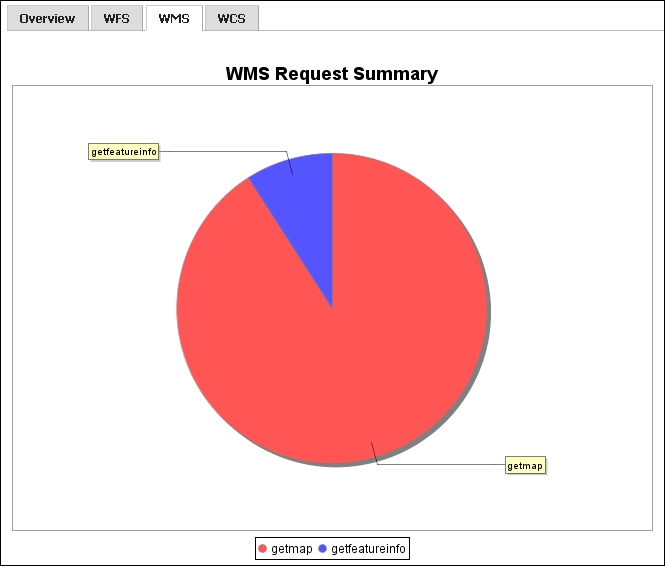
These simple reports are built using the information persisted; indeed, the service and operation are among the saved details.
A full reference of the captured information is available in the GeoServer official documentation (http://docs.geoserver.org/stable/en/user/extensions/monitoring/reference.html).
This is a good starting point if you plan to analyze the monitoring data using external tools and build your own stats and charts.
However, before considering how to integrate external tools, we need to explore where the information is actually persisted.