
Thematic mapping is one of the more common uses of spatial data, and the most used thematic maps are the choropleth maps that we already used in several recipes in this book.
Until now, the examples showed you how to produce a thematic map with fixed values in the attributes. SLD specifications define some functions that let you classify your data using related attributes in a dynamic way.
In this recipe, we will explore how to apply symbology encoding to GeoServer layers.
- Log on to the GeoServer web interface. From the left panel, select the Styles option and click on the Add a new Style button.
- In the Styles editor, insert
InterpolatePopas the new name, and then select polygon as the default style to copy from, as shown in the following screenshot:
- The XML code is loaded in the editor window. Search for the rule to draw the grey polygon and select it using the following code snippet:
<PolygonSymbolizer> <Fill> <CssParameter name="fill"> <ogc:Function name="Interpolate"> <ogc:PropertyName>pop_est</ogc:PropertyName> <ogc:Literal>0</ogc:Literal> <ogc:Literal>#A1A690</ogc:Literal> <ogc:Literal>1000000</ogc:Literal> <ogc:Literal>#299BCD</ogc:Literal> <ogc:Literal>50000000</ogc:Literal> <ogc:Literal>#0AAA50</ogc:Literal> <ogc:Literal>500000000</ogc:Literal> <ogc:Literal>#EE1C25</ogc:Literal> <ogc:Literal>1500000000</ogc:Literal> <ogc:Literal>#EB0C8B</ogc:Literal> <ogc:Literal>color</ogc:Literal> </ogc:Function> </CssParameter> </Fill> </PolygonSymbolizer> - Click on the Validate button, check that no errors are reported, and then click on the Submit button.
- Now open the Layers section from the left panel of the GeoServer interface and click on the NaturalEarth:countries layer.
- Switch to the Publishing panel and add the InterpolatePop style to the layer configuration, as shown in the following screenshot:
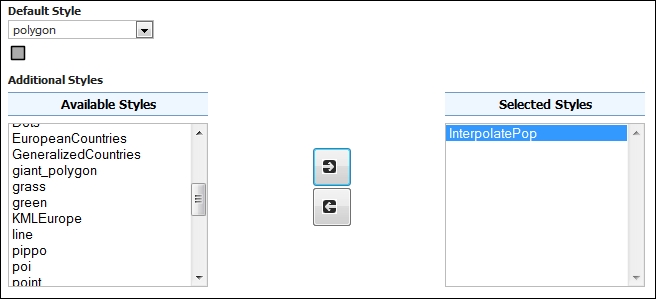
- Now open the Layer preview for the NaturalEarth:countries layer and the options toolbar, and select InterpolatePop as the style; your map should look like the following screenshot:
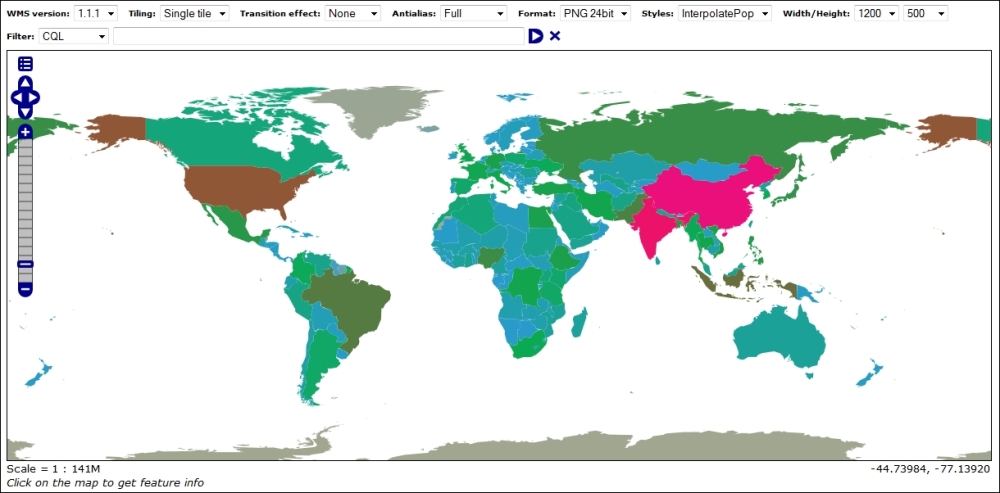
You have now created a thematic map where the color applied to features is determined by an interpolation curve. In a simpler thematic map, you create a set of rules, where you set a specific color in each class that applies to all the matching features.
Using the interpolate function, you just need to create a single rule that defines the interpolation curve that will transform a continuous-valued attribute into another continuous range of values.
In this case, the valued attribute is pop_est, which contains the population value for each country, and the range of these values is the RGB colors. The transformation is defined by a set of (input/output) control points chosen along a desired mapping curve. Piecewise interpolation along the curve is used to compute an output value for any input value.
You set the following five control points to define your curve:
         <ogc:Literal>0</ogc:Literal>
         <ogc:Literal>#A1A690</ogc:Literal>

         <ogc:Literal>1000000</ogc:Literal>
         <ogc:Literal>#299BCD</ogc:Literal>

         <ogc:Literal>50000000</ogc:Literal>
         <ogc:Literal>#0AAA50</ogc:Literal>

         <ogc:Literal>500000000</ogc:Literal>
         <ogc:Literal>#EE1C25</ogc:Literal>

         <ogc:Literal>1500000000</ogc:Literal>
         <ogc:Literal>#EB0C8B</ogc:Literal>
The last line defines the interpolation method, color in this case, as we want to output RGB values:
<ogc:Literal>color</ogc:Literal>