
Most maps contain more than one layer—each one styled with one or more symbols according to its complexity and the map purpose.
When you browse interactive maps with many layers, you can see that the map changes its style according to the zoom level. When your view on the data is a portrait of the entire world, symbols are simple and there are a few features drawn on the map. As you get closer, you can see more labels, major roads change their symbols, and minor roads appear.
This approach lets you insert a large quantity of information on a web map while avoiding producing an almost unreadable jumble of labels and symbols.
How can you do a similar map with CSS code? It's again a matter of creating filters. This time, you should not only create filters that apply symbols according to the features' attributes, but you should also insert a constraint on the map scale to have GeoServer select the features that have to be drawn.
In this recipe, you will use the global roads dataset—again from the Natural Earth collection of open data.
Just go to http://www.naturalearthdata.com/downloads/10m-cultural-vectors/ and download the roads dataset. Then, load it in PostGIS and publish it with the road's name in the NaturalEarth workspace. Isn't it as simple as ready, steady, go?
- Open the CSS Style section from the GeoServer web interface. Then, select the link Choose a different layer. From the list of layers, select PostGISLocal:Roads.
- Select the link Create a new style. In the form, select the NaturalEarth workspace and insert
WorldRoadsas the style name. - Replace the code in the textbox with the following snippet:
[@scale < 5000000] { label: [label]; font-fill: black; } /* @title Road */ [type = 'Road'] [@scale < 5000000] { stroke: #000000, #FFFF00; stroke-width: 4, 2; z-index: 0, 1; } /* @title Major Highway */ [type = 'Major Highway'] [@scale > 10000000] { stroke: red; stroke-width: 1; } /* @title Major Highway */ [type = 'Major Highway'] [@scale < 10000000] { stroke: black, red, black; stroke-width: 7, 3, 1; z-index: 0, 1, 2; } /* @title Secondary Highway */ [type = 'Secondary Highway'] [@scale < 5000000] { stroke: #808080, #FF7F00; stroke-width: 4, 2; z-index: 0, 1; } /* @title Ferry Route */ [type = 'Ferry Route'] [@scale < 5000000] { stroke: #6699CD; stroke-width: 1; stroke-dasharray: 6 2; } /* @title Track */ [type = 'Track'] [@scale < 5000000] { stroke: #808080; stroke-width: 2; stroke-dasharray: 15 10; } /* @title Ferry, seasonal */ [type = 'Ferry, seasonal'] [@scale < 5000000] { stroke: blue; stroke-width: 1; stroke-dasharray: 6 2; } - Press the Submit button, switch to the map preview, and zoom in on West Europe. Your map should look like the following screenshot.
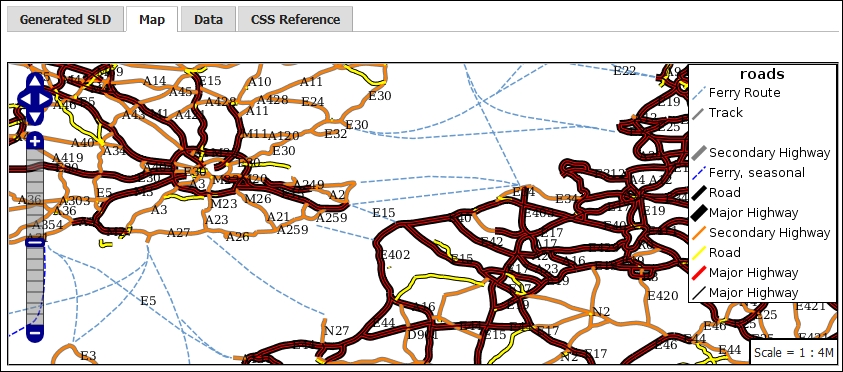
- Now zoom in to have a closer look at the area containing London and the channel. You can see that other items appear in the TOC and the way the roads are drawn on the map is quite more complex.
You probably noticed a new element inside the code. On the very first line of the CSS file, there is the @scale selector, which is used to define a rule that only applies when the map scale fits the constraint you inserted. In this case, you just want GeoServer to draw labels when the map scale is lower than 5 million. The rule properties just set the field expression used to access text, where it can be found, and the color for its labels:
[@scale < 5000000]
{
  label: [label];
  font-fill: black;
}
As you probably guessed, the first rule applies to all features, as there is no selector apart from the map scale.
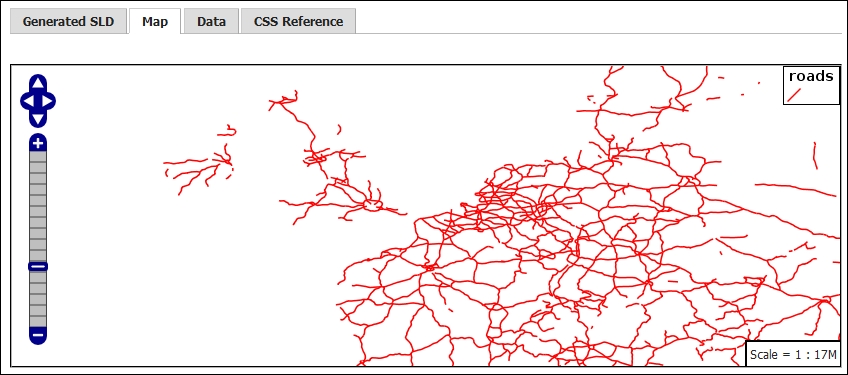
When you first open the map, there is only one symbol for all roads drawn; if you look for it in the code, you can find that the following lines set the filter for the maps with a scale higher than 10 million:
/* @title Major Highway */
[type = 'Major Highway'] [@scale > 10000000]
{
   stroke: red;
   stroke-width: 1;
 }
At that scale, you just want GeoServer to show major highways, so you set a filter on the type field and create a very simple red thin line symbol for them.
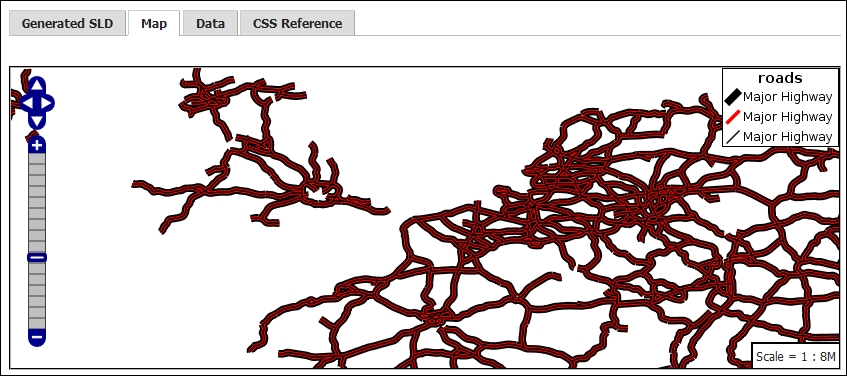
What happens for a scale under 10 million? Again, you have the same set of roads drawn, but you use a complex ticker symbol. It is in fact composed of three overlaid lines: a black one (which is 7-pixels thick), a red one (3-pixels wide), and eventually a black thin line with a width of just 1 pixel:
/* @title Major Highway */
[type = 'Major Highway'] [@scale < 10000000]
{
   stroke: black, red, black;
   stroke-width: 7, 3, 1;
   z-index: 0, 1, 2;
 }
The result is shown in the following screenshot:
Until your map's scale goes under 5 million, you don't see anything else; then suddenly, all other roads are drawn. So, in the code snippet, you set four other filters for secondary highways, roads, tracks, and ferry routes. The logic is always the same. Let's have a look at how it works for secondary highways:
/* @title Secondary Highway */
[type = 'Secondary Highway'] [@scale < 5000000]
{
   stroke: #808080, #FF7F00;
   stroke-width: 4, 2;
   z-index: 0, 1;
}
Obviously, your filter uses the type attribute to select a different value to be searched and sets the scale. This symbol is composed of two overlapping lines; the stroke element accepts two colors for the two lines and so does stroke-width. Pay attention to the z-index element where you set the drawing order of the lines. While the sequence 0,1, … n is probably more clear and understandable, you can set it in whatever order you need.