
Most users are comfortable with static 2D data, where a shape is represented on a surface and is invariant throughout time.
While most maps are built with this type of data, GeoServer offers you the possibility to explore even the third spatial dimension, which is elevation.
Besides, GeoServer can also publish data that changes over time. In this recipe, we'll see how to use data that changes over time using a set of points mimicking the path of a vehicle on a highway.
For this recipe, we need some new data. We will create a new dataset on PostGIS with data simulating a vehicle tracking path. It contains a set of points using timestamp.
First, we need to create a repository for the data. Execute the following SQL code to create a table:
CREATE TABLE vehicletrack (
    gid integer NOT NULL,
    "time" timestamp without time zone,
    geom geometry(Point,32633)
);

CREATE SEQUENCE vehicletrack_gid_seq
    START WITH 1
    INCREMENT BY 1
    NO MINVALUE
    NO MAXVALUE
    CACHE 1;

ALTER SEQUENCE vehicletrack_gid_seq OWNED BY vehicletrack.gid;

ALTER TABLE ONLY vehicletrack ALTER COLUMN gid SET DEFAULT nextval('vehicletrack_gid_seq'::regclass);

ALTER TABLE ONLY vehicletrack
    ADD CONSTRAINT vehicletrack_pkey PRIMARY KEY (gid);

CREATE INDEX vehicletrack_geom_gist ON vehicletrack USING gist (geom);Now, we can insert the data. Use the ch07_vehiclePoints.sql file, which you can download from this book's site and execute it, as shown in the following statement:
$ psql -U gissuser -d gisdata
psql (9.3.1)
Type "help" for help.

gisdata=> i ch07_vehiclePoints.sql
Now, we need to publish the layer on GeoServer. The publication workflow follows the ordinary flow. Please note the Dimensions tab. The Time flag is enabled, as shown in the following screenshot:
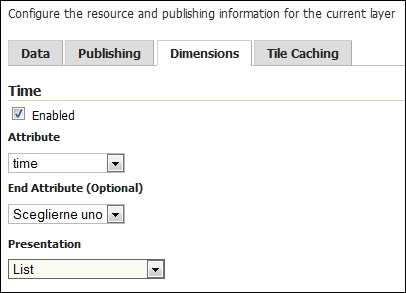
GeoServer has a proper attribute, so it gives you an option to use it to enable the time for the layer. After you flag it, three more controls appear. From the Attribute list, select time. We have no End Attribute value; this is the case when you have a period, that is, a range of validity time for each feature. In the Presentation list, select the List value.
- Take the three files with the
.htmlextension and place them in theROOTfolder under<CATALINA_HOME>/webappson your Tomcat. - Open your browser and point it to the following URL to send GeoServer a request for a map containing an OpenStreetMap basemap and your new layer:
http://localhost:8080/ch07_timeWMS.html - You should see a map that looks like the following screenshot:
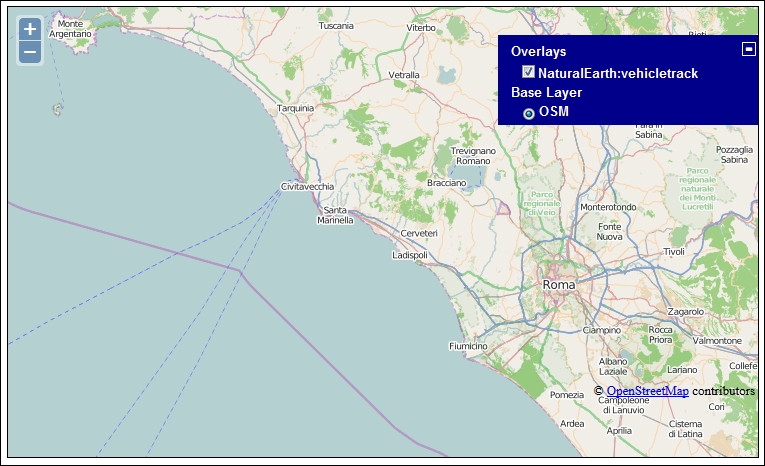
- The
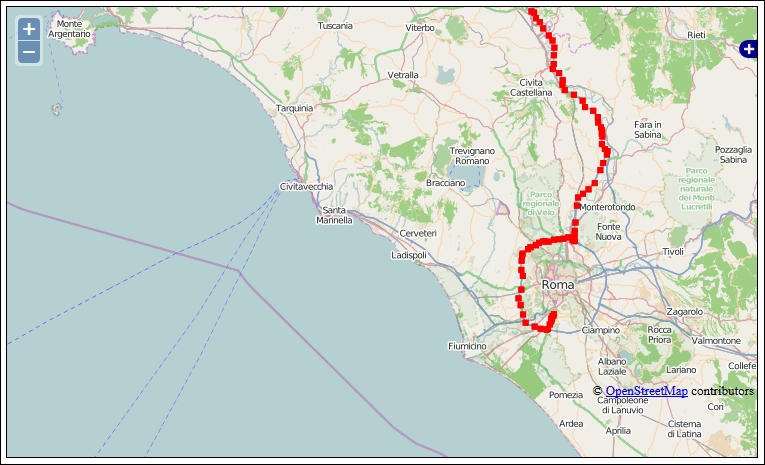
vehicletracklayer is shown in the layers list but no features are represented on the map. Now try the following URL:http://localhost:8080/ch07_timeWMSALL.html - This time you can see the sample points tracking the position of the vehicle on the trip, as shown in the following screenshot:
- Load the following URL in your browser:
http://localhost:8080/ch07_timeWMSRange.htm. Now you can see that just a subset of positions are shown on the map: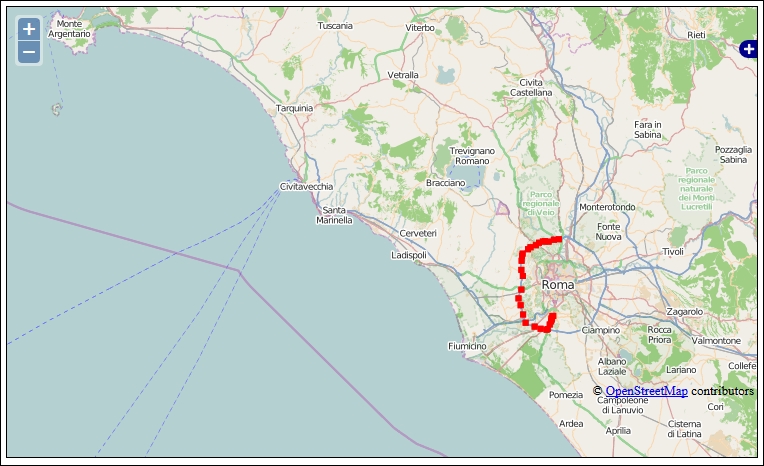
After you enabled the time dimension for the layer, you can use an additional parameter in your request to GeoServer: time. In fact, the simple OpenLayers app you used in this recipe uses it. Let's see how the code works in detail.
First of all, you need to get the OpenLayers package. In the script, an absolute reference to the OpenLayers official site is used. When building a real application, you may want to incorporate the package in your app and so you will be using a relative path:
<script type="text/javascript" src="http://openlayers.org/api/2.13.1/OpenLayers.js"></script>
Just after it, there is the JavaScript snippet that creates the map and loads two layers. We create a map object, which will be the canvas that shows the result of the GetMap request to GeoServer. Note that you need to explicitly set the projection to EPSG:3857, the standard code for the Web Mercator CRS. In fact, we'll use OpenStreetMap tiles as the basemap and these are only available in this CRS:
    <script type="text/javascript">
        var map, layer;
        function init(){
            map = new OpenLayers.Map(
                {div: 'myMap',
                projection: 'EPSG:3857'}
            );
We now have the vehicletrack layer, which you created in this recipe. We set it as transparent, to avoid it hiding the underlying basemap. We also set the isBaseLayer property to False to avoid OpenLayers from loading it as an alternative basemap:
            var demolayer = new OpenLayers.Layer.WMS(
                'NaturalEarth:vehicletrack','../geoserver/NaturalEarth/wms',
                {layers: 'NaturalEarth:vehicletrack',
                 format: 'image/png',
                 transparent: true
                 },
                {singleTile: 'True',
                 isBaseLayer: false}
            );
            map.addLayer(demolayer);
Then, we add the OpenStreetMap layer. This is really straightforward. Using the OSM class, we just need to provide a name for it, which will be used in the layerSwitcher control. The OSM class points, by default, to the following:
            var layer = new OpenLayers.Layer.OSM("OSM");
            map.addLayer(layer);
The final step is to center the map on an area containing the vehicle data, and add the control to switch the layer visibility on or off:
            map.setCenter(
                new OpenLayers.LonLat(12.0,42.0).transform(
                    new OpenLayers.Projection("EPSG:4326"),
                    map.getProjectionObject()
                ), 9
            );
            map.addControl(new OpenLayers.Control.LayerSwitcher({
                ascending: false
            }));
        }
    </script>
Although you add the layer, the vehicletrack layer in this case, it doesn't show on the map. The layer name is listed in the LayerSwitcher control, so there is no error in the script. It is just that you did not specify the time parameter, so no point is returned by GeoServer.
If you inspect the code contained in the ch07_timeWMSALL.html file, you will see that the only difference is in the creation of the vehicletrack layer:
            var demolayer = new OpenLayers.Layer.WMS(
                'NaturalEarth:vehicletrack','../geoserver/NaturalEarth/wms',
                {layers: 'NaturalEarth:vehicletrack',
                 format: 'image/png',
                 transparent: true,
                 time: '2014-05-26'
                 },
                {singleTile: 'True',
                 isBaseLayer: false}
            );
Now you have the value 2014-05-26 for the time parameter and all the points have a timestamp in that day, so all points are shown.
You can define the time value using the yyyy-MM-ddThh:mm:ss.SSSZ format and you can also specify a range; in this case, you set the start and end date using the same format and separate them with the / character.
In the ch07_timeWMSRange.html file, a two-hour range is specified and just a subset of points is displayed on the map:
time: '2014-05-26T11:00:00.0Z/2014-05-26T12:00:00.0Z'