WMS requests let you add vector and raster data to a map. This is very useful when your main purpose is data visualization. All the rendering work is on the server side, which means that it is performed by GeoServer, and your client application just has to properly show the final output to the users.
This model fails when your users want to manage the data represented on the map, for instance, to change a style or create derivative data with a processing tool.
In this case, the original data is needed. Web Coverage Service (WCS) is the equivalent of WFS to deliver original data. It is intended to get a raster dataset, or a subset of it, in its original form, without any rendering or other processing.
Note
WCS is of OGC standard, currently at Version 2.0.1; GeoServer supports versions ranging from 1.0.0 to the latest one.
For a detailed reference, you can consult the official documentation at http://www.opengeospatial.org/standards/wcs.
In this recipe, we will use QGIS as a WMS and WCS client. It is a powerful and open source tool. You can download it from http://qgis.org/en/site/.
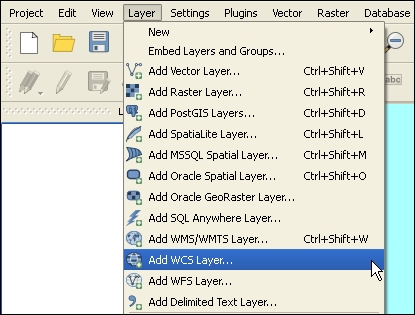
- Open the QGIS Desktop. From the toolbar, select the Layer menu and then click on the Add WCS Layer… voice:
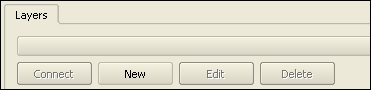
- A connection window is shown. In the upper part, click on the New button to add a reference to your GeoServer instance:
- Insert
localhostas the connection name andhttp://localhost:8080/geoserver/ows?service=WCS&version=2.0.1&request=GetCapabilitiesas the URL. - Click on OK to save the new connection. In the add layer window, click on the Connect button, after which a list of the available layers will be shown.
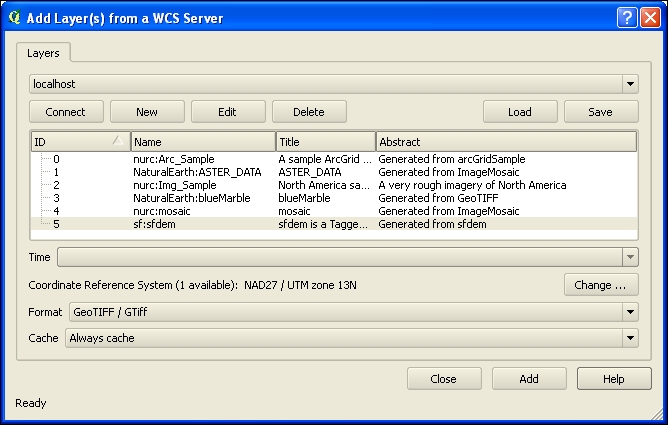
- Select the sf:dem layer and go with the default values for all the other parameters. Then, click on Add. The coverage is downloaded and added to your map canvas.
- Now repeat the procedure to add the same layer using the WMS protocol. From the toolbar, select the Layer menu and then click on the Add WMS/WMTS Layer… voice.
- You need to add a connection to the server in a very similar way as you did previously for WCS. Use the following URL:
http://localhost:8080/geoserver/ows?service=wms&version=1.3.0&request=GetCapabilities
- After connecting to the localhost, select the
sf:demlayer again. The default CRS is EPSG:4326. To avoid your client performing a reprojection of data, click on the Change button and select EPSG:26713: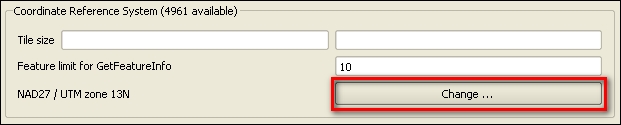
- Click on the Add button and your layer will be loaded on the map on top of the previous layer.
In this recipe, you added the same layer twice on the map. What is the purpose and what is the difference between them?
Also, if the original data is the same, what your client received from GeoServer is quite different in the two operations. The first hint may come from a look at the table of contents in QGIS:
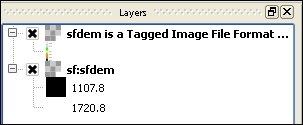
The layer on top is the result of the WMS request, while the other is a result of the WCS request. The first difference is in the symbology used to represent them. In a WMS request, the data is represented with a default style or a style provided within the request. So the data is transformed and represented as a picture.
WCS has no concept of style. It always delivers the original data, and a symbology is then applied from the client. In this case, QGIS uses a black to white color ramp stretched to the minimum/maximum range. If you open the layer properties window, you can see that style is not modifiable for the WMS layer while you can change it in the WCS layer.
Exporting the layer could help you better understand what you received. In the table of contents, right-click on the layer loaded with WMS and select the Save As… item.
Set the parameters as shown in the following screenshot and click on the OK button:
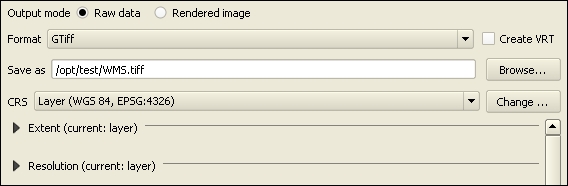
Repeat the process to save the layer obtained by the WCS request. Save the export in a file called WCS.tiff.
The first look at the file size shows a big difference, as the output from the WCS layer is way bigger than that from the WMS layer:
$ ls -lh
total 1.2M
-rw-r--r-- 1 root root 1.2M Jul 18 12:15 WCS.tiff
-rw-r--r-- 1 root root  22K Jul 18 12:15 WMS.tiff
Looking at the details with the gdalinfo utility shows a huge difference in the size and value contained:
$ gdalinfo -stats WCS.tiff
Driver: GTiff/GeoTIFF
Files: WCS.tiff
Size is 634, 477
...
Band 1 Block=634x3 Type=Float32, ColorInterp=Gray
  Minimum=1066.000, Maximum=1840.000, Mean=1353.669, StdDev=177.041
  NoData Value=-9.99999993381581251e+36
...
$ gdalinfo -stats WMS.tiff
Driver: GTiff/GeoTIFF
Files: WMS.tiff
Size is 100, 54
...
Band 1 Block=100x20 Type=Byte, ColorInterp=Red
  Minimum=0.000, Maximum=255.000, Mean=206.119, StdDev=67.776
...
Band 2 Block=100x20 Type=Byte, ColorInterp=Green
  Minimum=0.000, Maximum=255.000, Mean=171.005, StdDev=74.023
...
Band 3 Block=100x20 Type=Byte, ColorInterp=Blue
  Minimum=0.000, Maximum=63.000, Mean=13.006, StdDev=20.915
...
Band 4 Block=100x20 Type=Byte, ColorInterp=Alpha
  Minimum=0.000, Maximum=255.000, Mean=237.669, StdDev=64.179
...
As it is stated in the result, the output from the WCS layer is a single-band raster file with values ranging from 1,066 to 1,840, which are the elevation values of the area represented in dem. The output of the WMS file is an image with four bands whose values range from 0 to 255, which are indeed the expected values for an RGB-encoded picture. So if you're going to use the result of the WCS in QGIS, you might want to be sure that it is equivalent to using the original data.
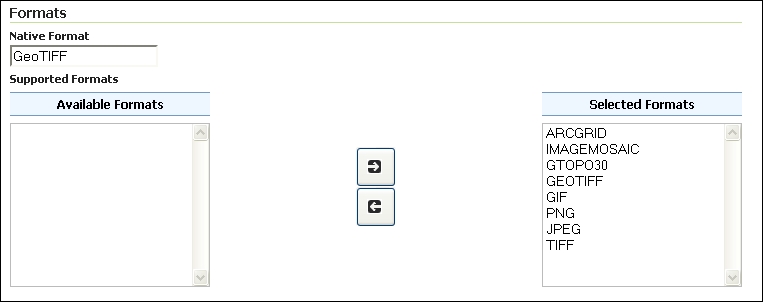
A powerful option of WCS is the possibility to have the data in several different formats. If you connect again to GeoServer, you may see that in the window, QGIS lets you select what format you want to download the data in.
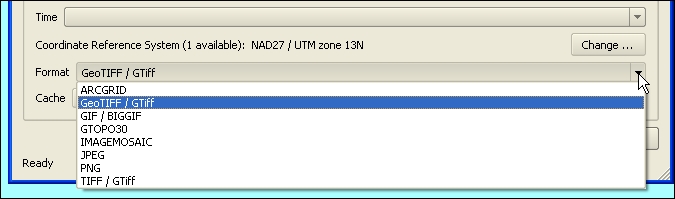
The nature and number of formats available depends on the server. QGIS merely shows you what GeoServer returns at its WCS DescribeCoverage request. You can check for yourself by inserting this URL in your browser:
http://localhost:8080/geoserver/wcs?service=WCS&version=1.0.0&request=DescribeCoverage&Coverage=sf:sfdem
If your check the XML code, you will find the following supported formats:
<wcs:supportedFormats nativeFormat="GeoTIFF">
    <wcs:formats>ARCGRID</wcs:formats>
    <wcs:formats>GeoTIFF</wcs:formats>
    <wcs:formats>GIF</wcs:formats>
    <wcs:formats>GTOPO30</wcs:formats>
    <wcs:formats>IMAGEMOSAIC</wcs:formats>
    <wcs:formats>JPEG</wcs:formats>
    <wcs:formats>PNG</wcs:formats>
    <wcs:formats>TIFF</wcs:formats>
</wcs:supportedFormats>
You can control which formats are allowed on a per layer base. From the GeoServer web interface, open the Layer setting and go to the Publishing tab. There is a Formats section where you can choose which formats will be available for that layer.