
In this age of digital information, a secret agent must be able to handle computer networks with ease. The intricate details of protocols and network packets are still shrouded in mystery to most people. With this chapter, you'll gain the advantage by simply picking up, and looking closely at, the network signals that surround all of us every day.
We'll start off by analyzing the Wi-Fi traffic around the house, and then we'll map out your local network in more detail so that you can pick out an interesting target for your network pranks. You'll not only learn how to capture, manipulate, and spy on your target's network traffic, but also how to protect yourself and your network from mischief.
In this chapter, we will:
- Get an overview of all computers on your network
- Find out what the other computers are up to
- Protect your network against Ettercap
- Analyze packet dumps with Wireshark
- Explore dynamic DNS, port forwarding, and tunneling
- Keep Facebook conversations secret with encryption
When analyzing Wi-Fi networks in particular, we have to take the borderless nature of radio signals into account. For example, someone could be parked in a car outside your house, running a rogue access point, and tricking the computers inside your home to send all their traffic through this nefarious surveillance equipment. To be able to detect such attacks, you need a way of monitoring the airspace around your house.
Kismet is a Wi-Fi spectrum and traffic analyzer that relies on your Wi-Fi adapter's ability to enter something called monitor mode. You should be aware that not all adapters and drivers support this mode of operation, but those based on the Atheros or Ralink chipset are a good bet.
You can test whether your Wi-Fi adapter supports monitor mode; attempt to put it into this mode with the following commands:
pi@raspberrypi ~ $ sudo ifconfig wlan0 down
pi@raspberrypi ~ $ sudo iwconfig wlan0 mode monitor
If your device doesn't support this mode, you'll get a response something like:
Error for wireless request "Set Mode" (8B06) :
 SET failed on device wlan0 ; Operation not supported.
If you don't get this message then it's probably supported and set. You can check this with the following command:
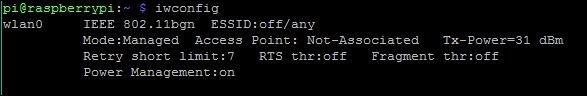
pi@raspberrypi ~ $ sudo iwconfig
Look for your device in the output, which should confirm that it's switched into monitor mode with:
wlan0 IEEE 802.11bgn Mode:Monitor Tx-Power=20 dBm

 Retry short limit:7 RTS thr:off Fragment thr:off

 Power Management:off
Note
Note that the Wi-Fi chip built into the new Raspberry Pi 3 does not support monitor mode, therefore you'll have to plug in an external USB Wi-Fi dongle, which does support monitor mode, such as the Farnell element14 Wi-Pi device shown in the following image. This will be seen by the Pi 3 as device wlan1 rather than wlan0 as on the previous versions.

Since your Wi-Fi adapter will be busy monitoring the airwaves, you'll want to work directly on the Pi itself with a keyboard and monitor, or log in to the Pi over a wired connection. See the Setting up point-to-point networking section of Chapter 5, Taking Your Pi Off-road, if you would like to set up a direct wired connection without a router.
We'll have to build Kismet ourselves from source code, as the package in the Raspbian repository is an ancient version from 2013, whereas the latest version was released in February 2016. The following are the steps to build Kismet:
- First, add some developer headers and code libraries that Kismet relies on:
pi@raspberrypi ~ $ sudo apt-get install libncurses5-dev libpcap-dev libpcre3-dev libnl-3-dev libnl-genl-3-dev libcap-dev libwireshark-data - Next, download the Kismet source code from the project's web page:
- The Kismet build process is quite lengthy and will eat up about half an hour of a Pi 3's time, and longer on earlier models. Once it's finished, you may exit the source directory and delete it:
pi@raspberrypi ~/kismet-2016-01-R1 $ cd .. && rm -rf kismet-20136-01-R1
When a Wi-Fi adapter enters monitor mode, it means that it's not associated with any particular access point and is just listening for any Wi-Fi traffic that happens to whizz by in the air. On Raspbian, however, there are utility applications running in the background that try to automatically associate your adapter with Wi-Fi networks. We'll have to temporarily disable two of these helper applications to stop them from interfering with the adapter while Kismet is running.
- Open up
/etc/network/interfacesfor editing:pi@raspberrypi ~ $ sudo nano /etc/network/interfaces - Find the block that starts with
allow-hotplug wlan0and put a#character in front of each line, like we've done here:#allow-hotplug wlan0 #iface wlan0 inet manual # wpa-conf /etc/wpa_supplicant/wpa_supplicant.confOn the Pi 3 with the dongle showing as
wlan1, comment out those lines instead.Press Ctrl + X to exit and select y when prompted to save the modified buffer, then press the Enter key to confirm the filename to write to. This will prevent the
wpa_supplicantutility from interfering with Kismet. - Now, reboot your Pi. Once logged back in, you can verify that your adapter has not associated with any access points by using the following command:
pi@raspberrypi ~ $ iwconfig
Kismet has the option to geographically map access points using a connected GPS. If you have a GPS that you'd like to use with Kismet, read the Tracking the Pi's whereabouts using GPS section ofChapter 5, Taking Your Pi Off-road, to learn how to set up your GPS adapter, then continue reading from here.
Kismet is also capable of alerting you to new network discoveries using sound effects and synthesized speech. The SoX and eSpeak software from Chapter 2, Audio Antics, works well for these purposes. In case you haven't got them installed, use the following command to add them to your system now:
pi@rasypberrypi ~ $ sudo apt-get install sox
    libsox-fmt-mp3 espeak
Another very important function of Kismet is to generate detailed log files. Let's create a directory to hold these files using the following command:
pi@raspberrypi ~ $ mkdir ~/kismetlogs
Before we start Kismet, we need to open up the configuration file to adjust a few settings to our liking, using the following command:
pi@raspberrypi ~ $ sudo nano /etc/kismet.conf
We will go through the configuration and make stops to explain or change options from top to bottom:
logprefix: Uncomment and change thelogprefixline so that the log files generated by Kismet will be stored in a predictable location:
logprefix=/home/pi/kismetlogs
ncsource: Uncomment and change thencsourceline so that Kismet knows what Wi-Fi interface to use for monitoring. There are many options for this directive and Kismet should pick sensible defaults for the most part, but we've specified two options here that have proved necessary in some cases on the Pi:
ncsource=wlan0:forcevap=false,validatefcs=true
Or:
ncsource=wlan1:forcevap=false,validatefcs=true
For the Pi 3:
gps: Change this line to readgps=falseif you don't have a GPS attached; otherwise, leave it as it is and check that yourgpsdis up and running.- Save the file and exit
nano.
The Kismet application is actually made up of a separate server component and client interface, which means that you could let the Pi run only the Kismet server and then attach a client interface to it from another computer.
In this case, we'll run both server and client on the Pi, using the following command:
pi@raspberrypi ~ $ kismet
You'll be greeted by a colorful console interface and a series of pop-up dialog boxes asking you questions about your setup. Use your Tab key to switch between answers and press the Enter key to select. The first question about color just tweaks the color scheme used by the Kismet interface, depending on your answer. Select Yes to the second question about starting the Kismet server, then accept the default options for the Kismet server and select Start.
This is the crucial point where you'll find out if your particular Wi-Fi adapter will successfully enter monitoring mode so that Kismet can work its magic. If your adapter doesn't support monitor mode, it will tell you so on the Kismet Server Console:
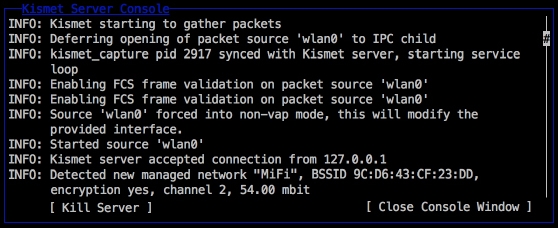
When you see messages about new detected networks starting to pop up in the log, you know that everything is working fine and you may close the server console by pressing the Tab key to select Close Console Window, and then pressing the Enter key.
You're now looking at the main Kismet screen, which is composed of different View areas with Network List being the most prominent. You'll see any number of access points in the near vicinity and should be able to spot your own access point in the list:
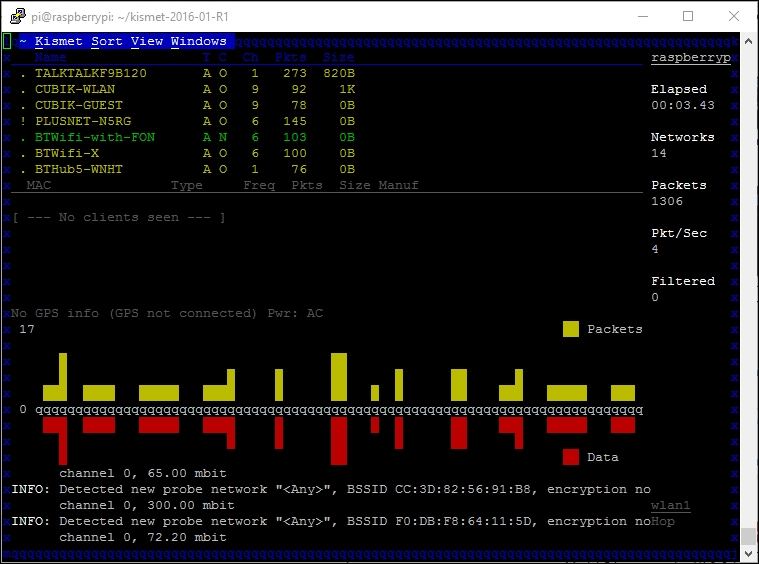
The right-hand side of the screen is the General Info area, which provides a grand overview of the Kismet session, and Packet Graph across the middle provides a real-time activity monitor of the packet capture process.
The Status area at the bottom contains the latest messages from the Kismet Server console and makes it easy to spot when new access points are discovered and added to the list.
To toggle the drop-down menu at the top of the screen, press the ~ key (usually located under the Esc key), and then use your arrow keys to navigate through the menus and press the Enter key to select. Press the same ~ key to close the menu. There are also underlined letters and shortcut letters that you can use to navigate faster through the menus.
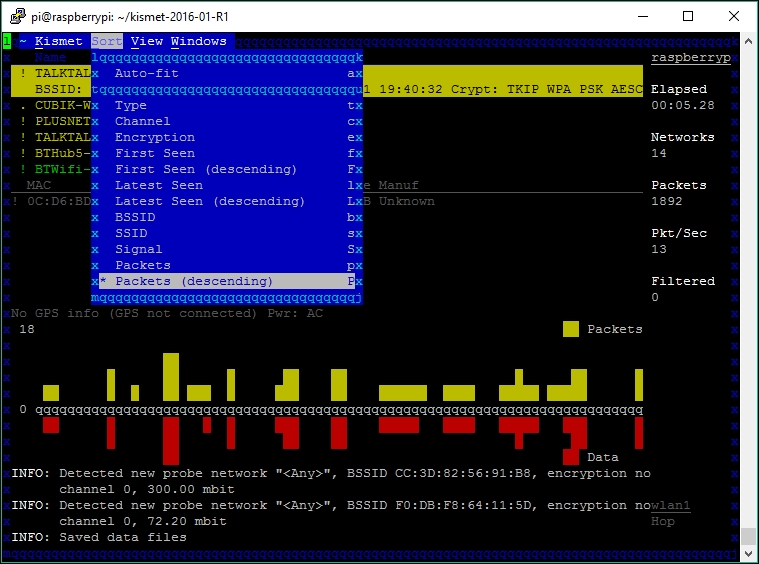
Let's look at the Sort menu. When you start out, Network List is set to the Auto-fit sorting. To be able to select individual access points in the list for further operations, you need to choose one of the available sorting methods. A good choice is Packets (descending) since it makes the most active access points visible at the top of the list:
Now you'll be able to use your arrow keys in the Network list to select your access point and get a closer look at the connected computers by viewing the Client list from the View or Windows drop-down menu. Each Wi-Fi adapter associated with the access point has a unique hardware identifier called a MAC address. While these addresses can be faked (spoofed), it does give you an idea of how many computers are actively sending and receiving network packets on your network, as indicated by the ! character in front of active MACs. Just keep in mind that the access point itself appears in the list as a Wired/AP type.
Most aspects of the Kismet user interface can be changed from the Preferences panel under the Kismet drop-down menu. To add sound effects or synthesized speech, select the Audio... option.
Use your Tab and Enter keys to enable Sound and/or Speech. To make the speech work, select Configure Speech and change the Speech Player command to espeak. Now close the dialogs and your changes should take effect immediately.
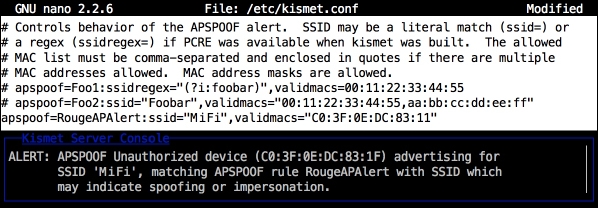
Kismet not only monitors the Wi-Fi airspace, it also includes some Intrusion Detection System (IDS) functionality. When Kismet detects something fishy going on, it will let you know with special alert messages (and an optional siren sound effect). To help Kismet detect the rogue access point attack we mentioned in the introduction to this section, we need to specify the correct MAC address of our access point in the Kismet configuration file.
You can obtain the MAC of your access point through Kismet. Verify that it stops sending packets when you turn it off to be sure it's really your access point.
Come out of Kismet ( Ctrl + ~) and open up the Kismet configuration file for editing:
pi@raspberrypi ~ $ sudo nano /etc/kismet.conf
Locate the two example lines starting with apspoof= and comment them out. Then add your own line below according to the following format:
apspoof=RogueAPAlert:ssid="[AP Name]",validmacs="[MAC address]"
Replace [AP Name] with the name (SSID) of your access point and [MAC address] with the MAC of your access point, then save and exit nano.
Whenever Kismet detects any inconsistencies involving your access point, you'll receive alerts in the Kismet Server Console and under the special Alerts window:
This concludes our Kismet crash course. We'll cover how to analyze the captured network traffic that we logged to ~/kismetlogs later, in the Analyzing packet dumps with Wireshark section.
While Kismet gave us a broad overview of the Wi-Fi airspace around your home, it's time to get an insider's perspective of what your network looks like.
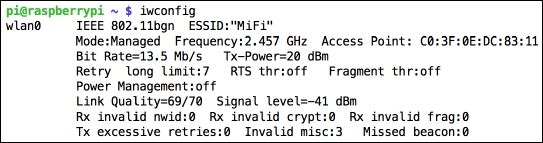
For the rest of this chapter, you can stay associated with your access point or connected to your router via Ethernet as usual. You'll need to revert any changes you made to the /etc/network/interfaces file earlier during the Kismet section. Then, reboot your Pi and check that you are indeed associated with your access point using the iwconfig command:
We'll be using the highly versatile Nmap application to gather information about everything that lives on your network. Let's install Nmap together with two other packages that will come in handy:
pi@raspberrypi ~ $ sudo apt-get install nmap
    xsltproc elinks
Nmap, as well as the other applications we'll be using in this chapter, will want to know what IP address or range of addresses to focus this attention on. Nmap will gladly start scanning the entire Internet if you tell it to, but that's neither practical nor helpful to you or the Internet. What you want to do is pick a range from the private IPv4 address space that is in use on your home network.
These are the three IP address blocks reserved for use on private networks:
10.0.0.0to10.255.255.255(Class A network)172.16.0.0to172.31.255.255(Class B network)192.168.0.0to192.168.255.255(Class C network)
The Class C network is the most common range for home routers, with 192.168.1.1 being a typical IP address for the router itself. If you're unsure of the range in use on your network, you can look at the IP address and route information that was handed to the Wi-Fi interface by the DHCP service of your router:
pi@raspberrypi ~ $ ip addr show wlan0
pi@raspberrypi ~ $ ip route show
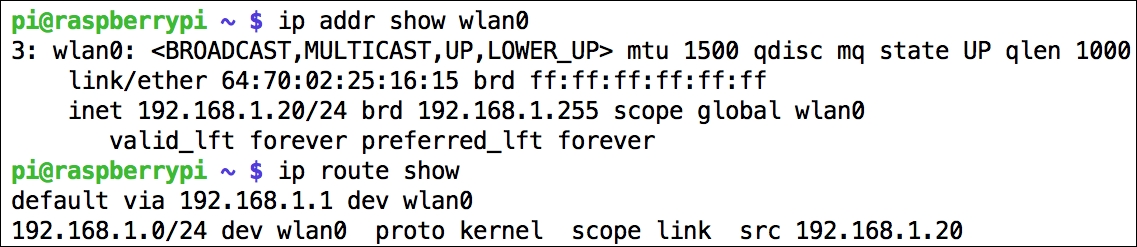
The Wi-Fi interface, as shown in the previous screenshot, has been handed an IP address in the 192.168.1.0/24 range, which is a shorter way (called CIDR notation) of saying between 192.168.1.0 and 192.168.1.255.
We can also see that the default gateway for the Wi-Fi interface is 192.168.1.1. The default gateway is where the Wi-Fi interface sends all its traffic to talk to the Internet, which is very likely to be the IP address of your router.
So, if you find that your interface has been given, for example, 10.1.1.20, the IP addresses of the other computers on your network are most likely somewhere in the 10.1.1.1 to 10.1.1.254 range. Now that we know what range to scan, let's see what Nmap can find out about it.
The simplest, yet surprisingly useful, scan technique offered by Nmap is called the List Scan. It's one way of finding computers on the network by doing a host name lookup for each IP address in the range that we specify, without sending any actual network packets to the computers themselves. Try it out using the following command, but replace [target] with a single IP address or range:
pi@raspberrypi ~ $ sudo nmap -v -sL [target]
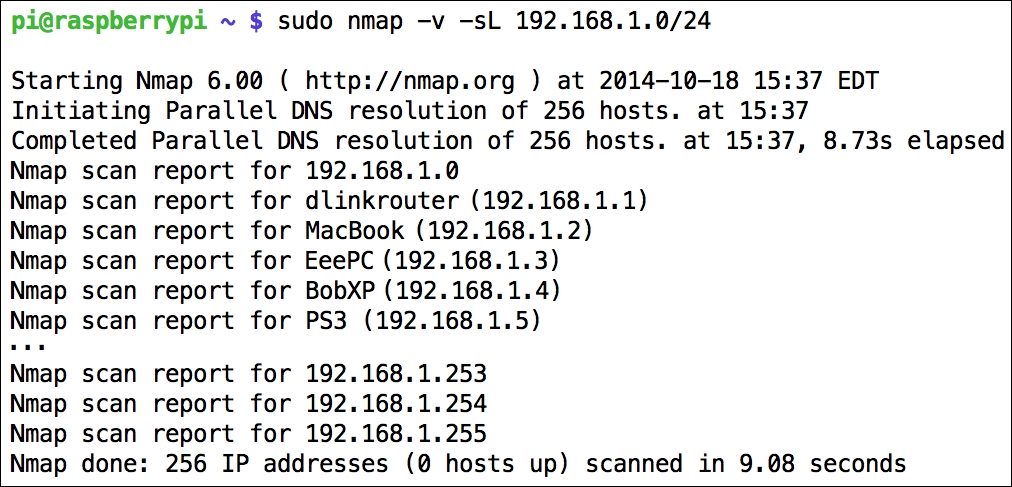
We always want to run Nmap with sudo, since Nmap requires root privileges to perform most of the scans. We also specify -v for some extra verbosity and -sL to use the List Scan technique. At the end comes the target specification, which can be a single IP address or a range of addresses. We can specify ranges using the short CIDR notation such as in the preceding screenshot, or with a dash in each group (called an octet) of the address. For example, to scan the first 20 addresses, we could specify 192.168.1.1-20.
The List Scan tells us which IP address is associated with what host name, but it doesn't really tell us if the computer is up and running at this very moment, which is why is reports 0 hosts up at the end. To check if a host is alive, we'll move on to the next technique: the ping scan. In this mode, Nmap will send out packets to each IP in the range to try to determine whether the host is alive or not. Try it out using the following command:
pi@raspberrypi ~ $ sudo nmap -sn [target]
You'll get a list of all the computers that are currently running, along with their MAC address and the hardware manufacturer of their network adapter. On the last line, you'll find a summary of the total number of IP addresses scanned and how many of them are alive.
The other functions offered by Nmap can be viewed by starting nmap without arguments. To give you a taste of the powerful techniques available, try the following series of commands:
pi@raspberrypi ~ $ sudo nmap -sS -sV -sC -O -oX report.xml [target]
pi@raspberrypi ~ $ xsltproc report.xml -o report.html
pi@raspberrypi ~ $ elinks report.html
This nmap command might take a while to finish, depending on the number of computers on your network; On a Pi 3 across a /24 subnet it can take more than half an hour, as it launches four different scanning techniques:
-sS: for port scanning-sV: for service version detection-sC: for script scan-O: for OS detection
We've also specified -oX to get a detailed report in XML format, which we then transform to an HTML document, viewable on the console with the Elinks web browser. Press Q to quit Elinks when you're done viewing the report.