
Electrical Contact Material Testing Design and Measurement
Facts do not cease to exist because they are ignored.
Aldous Huxley
CONTENTS
18.2 Device Testing and Model Switch Testing
18.3 Electrical Contact Testing Variables
18.3.3 Opening and Closing Velocity Effects
18.3.5 Contact Carrier Mass and Conductivity
18.3.6 Contact Closing Force and Over Travel
18.3.7 Enclosed and Open Contact Devices
18.3.8 Testing at Different Ambient Temperatures
18.3.10 Summary Electrical Contact Testing Variables
18.4 Electrical Testing Result Types and Measurement Methods
18.4.1.2 Evaluation and Presentation of Results
18.4.2 Contact Bounce Measurement
18.4.3 Contact Welding Measurement
18.4.3.1 Weld Strength Measured
18.4.4 Contact Erosion Measurements
18.4.4.1 Accelerated and Model Testing
18.4.4.2 Extrapolation at Rated Stress
18.4.4.3 Increase of the Switching Frequency
18.4.4.4 Testing at Increased Electrical Load
18.4.4.6 Moving Contact Models
18.4.4.7 Evaluation and Presentation of Results
18.4.5 AC Arc Reignition Measurement
18.4.6 Arc Motion Measurements
18.4.6.3 Model Switch Arc Motion Control
18.4.6.4 Evaluation and Presentation of Results
18.4.7 Arc-Wall Interaction Measurements
The purpose of this chapter is to aid engineers in establishing testing methods for electrical contacts and testing of devices depending on the life and reliability of arcing type electrical contacts. The testing of electrical contacts involves many variables which make evaluations and comparisons very difficult. This chapter will summarize the important variables to consider and provide some guidance for designing test methods for your objectives.
18.2 Device Testing and Model Switch Testing
If you are an electrical device manufacturer, testing a new material in your device is mandatory before you can feel safe using it in your design. Testing in a model switch has the advantage of providing some specific information on electrical contact life that is difficult to measure in a commercial device. Two examples are: more precise electrical erosion data and quantitative welding measurements. The problem with model switches is that they don’t duplicate the mechanics, heat sinking, thermal conductivity, atmosphere, and other variables of the actual commercial devices. Since these variables can have significant effects on the erosion process, contact welding, and material transfer, results are not always reliable for extrapolation from one device to another. So for one major point in understanding results of contact testing, do not think you can use information acquired on a separate device to exclude the need for actual commercial device testing. This section will discuss ways to make model switches better so the information is more useful in commercial devices.
Even though actual device testing is mandatory, it does not normally give you all the information you would like to know about one contact material as compared to another. Many companies will evaluate a new contact design, new material or contact size, by just running the standard UL or other standard test with their commercial device to see if the new design passes or fails. The problem with this approach, besides only obtaining limited information, is that you test not just the contact but all the other components that make up the commercial device plus the consistency of your manufacturing process. Any testing that is done on commercial devices without some statistical measurement controls to serve as a barometer to compare against, has limited value and only tells you that in this spin of the wheel that you have passed. Of course, if you substantially pass or fail you can get some idea of what the result means.
If you put a little more effort into the design of device testing you can achieve a much higher confidence in the results. One way of doing this is to use a DOE (Design of Experiment) approach for running your evaluation of a new contact design. This type of approach is good for all types of testing but especially for contacts where there are many variables. Today, there is a lot of very good software available for designing and doing DOE work. Although it is available, software companies have found that less than 10% of companies use DOE statistical approaches. An important part of using this type of approach is to make sure your preparation allows you to make a good comparison of a new contact to some known contact standard. An important step is to assemble both sets of contacts in your commercial device at the same period of time. This should eliminate both component and manufacturing variables from the test evaluation. DOE test methods also allow you to test as many sets of contacts and other variables at the same time with a minimum of additional work. When you get the final results you will have good data on the relative standings of the variables and a confidence level for judging the test result differences. Another advantage of the DOE approach is you will also get information on interactions between variables. If you keep a set of contacts made from your initial evaluation testing of a design you will also have a method of comparing your contacts and devices over a period of time. Although this approach seems basic, it is rare to find a company that has the option to go back and make such a comparison. There are many statistical methods for measuring how consistent your results are and where you stand with regard to meeting your specifications. For electrical contacts there are many variables and this is why a DOE approach is useful, since it allows you to find out which variables are the most important for controlling your process. The variables will be discussed in this chapter.
One more point in the discussion of actual device testing is how good your testing methods are for protecting you from field failures. Typical industrial standards for device life are normally set using maximum currents and loads. For contacts, there are circumstances where lower power loads may be more susceptible to contact resistance problems than higher current loads. This may be connected with contamination from films or vapors. Chapter 19 explains this type of problem especially the section on silicone contamination. The point here is that although you test at maximum loads it does not protect you from problems that can exist only at lower loads.
This term involves both switches and relays. The advantage for model switch testing is that it makes getting quantitative data on electrical erosion and welding resistance possible. It also allows measuring contact resistance, contact force, temperature rise, and other parameters that can be measured with either commercial devices or model switches. Another advantage of using these devices is that they are normally made very precise and adjustable for parameters like opening and closing velocity, contact force, over travel, and other mechanical parameters so that testing can be more consistent over time than you would see for commercial devices made over a time span.
One of the problems with the use of data from model switches is that many times the model switch does not match the operating parameters of the commercial switches for which they are being used to supply supplemental information. For example, many very precise model switches used in research for comparing materials in erosion, material transfer and contact resistance as a function of operating life, have opening and closing speeds much different from most commercial devices which makes the results nonrepresentative or comparable to actual commercial devices. It is very important in designing model switches to make sure the operating range is within the parameters of the commercial devices for which you have interest. Sometimes this involves the size scale of the model switch and many times they are too big to adjust to the parameters of the smaller device. The second thing about these designs is to use similar mechanisms to what is used in the switch. For example, a model switch that is using an air cylinder to open and close the contacts will rarely mimic the opening and closing of a set of contacts that operates with an induction coil and armature as seen in relays. This may seem obvious but many times mechanical design engineers not familiar with these factors get carried away with elaborate and clever ideas for designs that never are able to recreate what happens in an actual relay or switch. It is not always easy to design the model switch to exactly duplicate the commercial switch in operation but you must try and come close to the same range of operation for the device of your interest.
In the following sections, some of the different electromechanical operating parameters will be discussed in addition to their effects on material performance such as erosion, material transfer, welding and sticking resistance and contact resistance.
18.3 Electrical Contact Testing Variables
This section will discuss the important parameters that need to be controlled for testing arcing contact materials. The parameters will be discussed in terms of how variations in these parameters influence the testing results for erosion, material transfer, welding, or contact resistance. This will be especially important if you are not just doing a fundamental study but are trying to use a model switch to duplicate results that will be seen in a commercial device.
Most of this discussion will concentrate on applications that are common for relays and switches used in residential homes or automotive circuits as opposed to more specialty devices used for protection for high voltage and current applications. Model switches for specialty items must almost duplicate the device.
For people working in this field, it is obvious that large differences exist between these two testing environments. In the automotive field, electromechanical relays are still the main devices used for switching the circuits on and off. For AC electromechanical relays, almost identical in design to the automotive relays, are used for switching industrial controls on and off. The mechanics of the two types of relays are very similar, but the contact materials for the two types of applications can be quite different. The reason that the AC and DC devices can be so similar in this case is that the DC voltage in automotive, 13VDC, is low enough to allow current interruption in somewhat the same time frame as for the AC relays. If the DC voltage is raised much above the 20 volt level the same designs would never work (see Sections 9.7.2 and 10.2.2). This was found out several years ago late in the game plan when an engineering study group sponsored by the auto industry was working on changing the automotive voltage to 42VDC. Although they were a highly technically refined group aimed on more efficient battery life, they failed to think about the interruption problems associated with increasing the automotive DC voltage.
Besides the difficulties for interrupting higher voltage DC, there are other differences as a result of AC changing polarity with each operation and DC staying with the same polarity. To help understand this variable better a short explanation of the DC erosion process will be made. When the contacts open with the formation of a liquid bridge between the contacts that converts to an arc in metal vapor (see Section 9.4.2), the initial erosion is from the anode with some transfer to the cathode; anodic erosion (see Section 10.3.5). So the initial erosion when the contact opening gap is very small transfers material is from the anode to the cathode. As the contacts continue to open the arc transitions into one operating in the ambient gas (see Section 10.3.5). Here the material transfer direction reverses and the material net erosion is from the cathode and transfer to the anode; cathodic erosion. This happens at a gap of about 5–10 microns. As the gap becomes larger the efficiency of the transfer becomes lower and more material is lost to the environment. So for our DC automotive case depending when the arc interrupts and the load type we can have erosion of the anode and a buildup of material on the cathode or a little less likely but possible the reverse a buildup on the anode and more erosion on the cathode. This is a simplified explanation but gives you an idea of what is happening. For AC switching the material transfer variable is eliminated if the switching device operates random to the AC sine wave. Sometimes there is a problem with the switching not being random as a result of the mechanics or electronics controlling the opening and closing of the contacts in the model switch. The point here is checking to see that the AC testing is random with regard to the current sine wave and this is always important for any AC testing (See Section 10.3.6).
Contact load type is something that is specified for different relays and switches depending on the standard that the device manufacture wants to meet. The main point in this part of the discussion is that these different loads all have different effects on the results from different operating parameters of the switches and relays. We will discuss three different types of loads: lamp, resistive, and inductive loads. These loads also have different effects for AC and DC switching.
Lamp loads are mainly resistive loads with a high inrush current. For AC the typical closing current is 10 × the normal current and the break current just the normal rating. Because the closing current is so high, variations in the severity of contact bounce make a large difference in erosion results. Controlling contact bounce is a major factor for improving the contact life for AC lamp loads. For automotive DC lamp loads the ratio of inrush is about 6 × normal current, a little less than for AC. Minimizing bounce is also an important factor for DC lamp loads. For DC lamp loads, the variations in the severity of bounce also cause large differences in anode erosion but also result in large variations of material transfer and build up on the cathode. This will be discussed more under the section coming up on bounce.
Resistive loads, normal current levels, are a mild type of load that is the least problematic of the three types of loads. The erosion level for resistive loads is very mild compared to the lamp loads in both AC and DC switching.
In AC there are special specifications for motor load switching. An AC-3 test is for a typical motor switching with a high inrush make, 6 × normal current and normal break (See Section 14.3). There is also an overload testing AC-4 with both high inrush on make and high current on break. Contact bounce is again a major factor for the erosion because of the high inrush. For the AC-4 testing with the break being at high current the model switch has to have a special design that duplicates the commercial device for moving the arc off the contact.
For DC automotive testing, the inductive load presents an interesting contrast to the other loads. On contact make there is normally a large lag time in current buildup of 4–7 ms and then a prolonged arc on break (see Section 10.2.2). So for a normal automotive relay switching an inductive load almost all the erosion is on break and normally no erosion on make. This means bounce does not matter in this case. This means controlling the break operation is the most important factor for DC inductive loads.
18.3.3 Opening and Closing Velocity Effects
Chen and Witter [1,2] studied the effect of changes in opening speed on a model switch designed to simulate automotive relays. For an inductive load they showed the erosion material transfer to change from being anodic erosion to cathodic erosion when the opening speed changed from 0.47 m/sec to 1.28 m/sec. For slow speeds the contacts remain in the anodic erosion zone for a much longer time than at the high speed. The overall erosion is also much less at the higher opening speed (see Figure 10.33). This example illustrates the importance of designing the model switch to operate in a similar velocity range to the commercial device of your interest. Closing speed is also important for a different reason. High closing speed can increase contact bounce, therefore at higher velocities more force is needed for bounce control. Very slow closing speeds can be a problem for higher voltage AC switches which can result in a pre-arc to form just before closing. This is rarer than problems of closing too fast and having more bounce erosion.
As discussed above, contact bounce is the major factor for variations in electrical erosion especially for high inrush loads. Controlling and adjusting bounce is more difficult than controlling other operating parameters. Some factors that increase the difficulty for matching bounce in a model switch to a commercial device are size differences, different opening and closing mechanisms, and different vibration absorption materials. Besides making these items similar, adjustments in closing speed and closing force can be made. Higher closing force generally reduces bounce. Experimenting with absorption pads is also a way to make adjustments. There are, however, no easy answers for making these adjustments.
Bounce is a bigger problem for DC lamp loads than in AC since the transfer remains from anode to cathode and buildup of transfer accumulates with each operation. The bigger problem in DC is that the bounce can result in a serious type of erosion called pip and crater. Witter and Polevoy [3] studied bounce in DC and found that if the bounce frequency was high (i.e., many short duration bounces) pip and crater erosion was more likely to form than for longer less frequent bounce times, see Figure 16.6 in Chapter 16. There are three reasons for the increased build up with higher frequency: (1) Short bounce has less amplitude so material transfer is more efficient, (2) The low opening gap amplitude causes less splatter on closure and more material remains near the center of the arc, and (3) There is a higher ratio of make operations to break operations with higher bounce frequency so less transfer from cathode to anode takes place on break. Pip and crater formation causes several problems. Once the pip forms there is a higher concentration of erosion of the anode in the area opposite of the pip. The pip is prone to cause mechanical latching, sticking of the contacts, as it goes into the cavity on the anode. Adjusting the bounce out of the high frequency mode is a must for being able to get good contact life. If pip and crater erosion forms, and the bounce frequency is low, there is more likely to be a material related problem and your model switch is giving you good information.
18.3.5 Contact Carrier Mass and Conductivity
The contact erosion and stress build up in the contact from arcing is sensitive to the mass and thermal conductivity of the carrier for which the contacts are attached. For example, relays normally have a thin spring as the movable contact carrier and a thick terminal as the stationary contact carrier. The heat and melting of the contact is more severe for the spring side of the relay than the terminal side of the relay since the thickness ratio of the terminal/spring carrier is 4/1. For high inrush loads, the life of the contact is much longer if the thicker terminal is the anode than if the spring is the anode [4]. This means that if you want the model switch to simulate that relay or switch you should match the contact carrier mass ratio on your commercial device.
18.3.6 Contact Closing Force and Over Travel
Contact over travel refers to the amount of elastic compression put on the closed contacts from the point of initially mating to the final travel of the movable contact blade. In a relay this is applied by the spring being bent by the armature which is attached to the spring as it continues to travel after the contacts have mated until it bottoms on the relay coil. There are many ways to apply this over travel elastic force to the contacts. The important factor is that the contacts will remained closed even after some of the contact surface is removed by the electrical erosion of the contact by the arc. From experience, it is known that most failures even in good devices begin when over travel starts to be too small for the application, therefore, too little contact force. This can result in a cascading downturn. Some of the things happening as the force drops are as follows: (1) Constriction resistance goes up for the closed contacts and they go up in temperature, (2) The contact bounce increases and this increases erosion per operation and also contributes to increasing contact temperatures, and (3) Stress relaxation of the carrier spring can take place with the increased temperature and this further reduces contact force. The main point here is to show how important it is to have enough over travel and to make sure you can adjust the over travel for any model switch you design.
18.3.7 Enclosed and Open Contact Devices
Most model switches are made open to the atmosphere. This could be a problem if you are trying to duplicate a device that is sealed in a plastic housing. For relays some are vented and some are almost hermetically sealed. As devices like relays heat up from the electrical load many times there is out gassing from the plastic. These gasses can be adsorbed onto the contact surface and alter the contact erosion process and also have some effect on the contact resistance. In reference [3], a relay was tested both with and without the plastic cover. The relay with the cover had an endurance life of 300,000 operations. When the cover was taken off the relay would fail in less than 50,000 operations. The reason for this big difference in endurance life was related to contact surface activation (see Sections 10.2.3 and 19.2). The outgassing of the relay plastic produced carbon particles on the contact surface for the relay with the cover which made the arc move to new sites for each separate operation. The erosion under this condition was smooth. With the cover off, no carbon particles were created. The relay had high frequency bounce and the arc stayed in one area and created severe pip and crater erosion. Before you start designing a model switch for a device that is enclosed in plastic you should run some tests on the device with the cover off or with vents and compare to the results with the normal enclosure.
18.3.8 Testing at Different Ambient Temperatures
For some types of devices there is a requirement that some of the testing be done at different temperatures. Automotive normally requires a portion of the endurance testing to be done at three different temperatures: approximately −40°C, 25°C, and 125°C. This does make it more difficult for getting force transducers to work. The results of the testing can also be different for the different temperatures. Although the test involves combining the testing results for all the temperatures, it is recommended that the tests be run separate on each temperature to see how your device performs at each temperature. For relays the tests at the higher temperature are normally the hardest since the relay coil overheats and affects the temperature of the thin spring carrier.
If you want to make periodic measurements of the erosion it is important to make removal easy and the ability to put the contacts back close to the same position. If the contacts are not close to the same position you will alter the erosion process especially if pip and crater erosion is possible. At the end of the testing it is good to measure the erosion and then clean the contacts with an ultrasonic bath to remove all the loose particles and then weigh the contact again so you get the true total erosion.
18.3.10 Summary Electrical Contact Testing Variables
Designing a model switch is complex and involves much more than the variables discussed in this section. The main purpose of this section is to make sure you have a better understanding of the variables and how they react with different loads so your design can better meet your objectives.
18.4 Electrical Testing Result Types and Measurement Methods
Contact resistance measurement is not problematic as a rule. The current and the electromotive force, e.m.f., of the test current circuit employed should not exceed the values of the minimum current and voltage, respectively, of the application device with regard to possible fritting processes (Section 1.3.6). The voltage measurement leads should be connected as close as possible to the contact spot. The reading must not be made before the dynamic contact phenomena level out; for example, only when three succeeding readings in properly chosen intervals are within a certain range of scatter, unless the dynamic contact resistance behavior is studied requiring automatic measurements with high time resolution [5,6].
If the contact resistance is measured under dry-circuit conditions, that is, excluding any A- or B-fritting owing to voltage and current applied for resistance measurement, respectively, the test voltage has to be limited to 80 mV [7]. Contact fritting can be studied, when first a minimum voltage not sufficient for A-fritting (e.g., 100 mV) is applied across the closed contacts while the current is at a certain minimum value (e.g., Imin = 5 mA). If high contact resistance limits the current to a value under that minimum, the voltage must be increased in small steps until the voltage breaks down owing to A-fritting and the minimum current value, Imin, is reached (Figure 18.1). The voltage values immediately before and after breakdown are the actual values of the fritting voltage and the cessation voltage, respectively. As soon as Imin is flowing the open circuit voltage has to be increased to a value sufficient for B-fritting in the total current range. Then the test current is increased in small steps while the contact voltage is recorded. As soon as the latter does not raise proportional to the current but remains constant (at the value of the softening voltage of the contact material) B-fritting is indicated (Figure 18.2) [8,9]. Since fritting processes are not reliable because the resulting contact resistance value depends on voltage and current applied and since the absolute resistance values after fritting are comparatively high), contact surface films have to be destroyed mechanically in order to obtain reliable, well-defined and sufficiently low contact resistance values. Therefore, the influence of the contact force and more specifically the dynamics of closing in terms of impact and sliding components for force are more important than the influence of voltage and current. Systematic variation of the mechanical conditions (normal and tangential components of contact force, kinetic energy) require model switches, as a rule.
18.4.1.1.1 Crossed-Rod Arrangement
The classical model contact for contact resistance investigation is the crossed-rod arrangement (see Figure 2.10). A large number of contact measurements on virgin spots can be executed along each straight line of the specimen rod to investigate its surface as manufactured or after exposure to any atmosphere. Well-defined contact closing, contact force increasing, opening, and promotion to the next spot can be executed automatically; dynamic closure can be simulated realistically in a well-defined way by sliding one rod after closure or by application of a mechanical impact with a small hammer. Contact resistance versus contact load curves may yield informative insights into the nature and the structure of surface contamination [9,10,11,12,13].
Probe measurements employing a gold probe under very low mechanical and electrical load, (to avoid any mechanical or electrical damage of the surface layer), to scan the surface of a flat specimen yield detailed information about the cleanliness of the surface and perhaps even about the nature of the surface contamination [14,15,16,17,18,19]. The contact resistance measured with a probe on an intact surface film is usually much higher than would be seen for most practical applications. Therefore, this information may not be useful in predicting the resistance of these films after normal mechanical and electrical stresses are applied in typical device applications [20,21]. To solve this problem devices have been developed to measure contact resistance as a function of these types of stresses, force, wipe distance, and voltage [13,15].
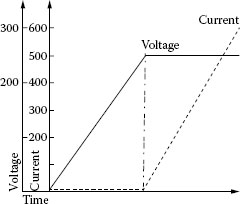
FIGURE 18.1
Contact resistance measurements by increase of voltage and current respectively, during a single test. (From Johler W. and Rieder W., VDE-Fachbericht, 38, 131–140, 1987.)
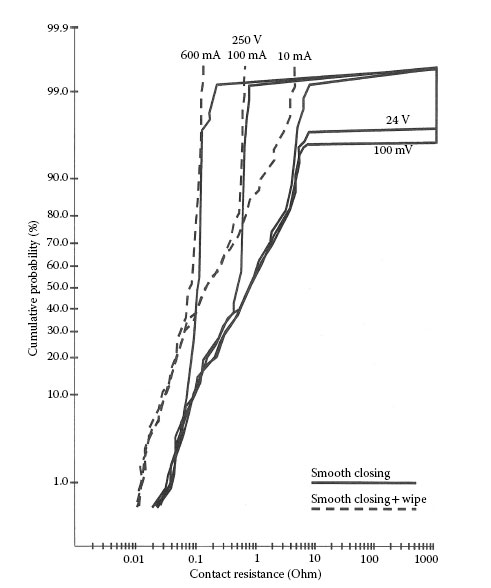
FIGURE 18.2
Contact resistance cumulative distribution curves of Ag/Ni 0.15 contacts after two months storage measured according the procedure shown in Figure 18.1.
18.4.1.1.3 Individual Contact Quality Control Devices
For quality control of individual contacts before assembly into devices, model switches are required which grip, test, and eject the contact automatically. This must be done without damaging the contact surface mechanically or electrically [17]. Most types of mineral contamination from deburring contacts cannot be found by using the above type of method, since the mineral particles are buried into the surface on the contact. In these cases, the contact must be arced with a few operations at low current to bring the contamination to the surface [22].
18.4.1.1.4 Organic Vapor Contamination Model Switches
Special model switches have been developed to measure the resistance of switching contacts exposed to the vapors emanating from one certain organic material only [23,24,25,26,27,28]. These sealed switches are made from glass and metal only (Figure 18.3). They cover an “offering cup” where any organic material can be heated and contacts switching a current in the critical range of tens to hundreds of milliamperes (ohmic load, e.m.f. ≤10 V) in order to crack and to carbonize the organic vapors adsorbed on the contact surfaces, thus contaminating the contacts with carbon which increases the contact resistance and/or “activates” the contacts (Section 19.2). Less generally applicable but more realistic are tests with modified relays [29].
18.4.1.2 Evaluation and Presentation of Results
18.4.1.2.1 Cumulative Distribution Curves
Corroded contact surfaces cause widely scattering resistance values that may yield useful information when properly evaluated. Statistical evaluations on the basis of log-normal distributions are adequate for items like contact resistance which has numerous independent parameters influencing the scatter of the results. This is especially true for contaminated contacts and these distributions are good since resistance values cannot become negative. The measured resistance values yield straight lines for correspondingly scaled coordinates. Mixed distributions characterized by a sudden change of the slope of the cumulative distribution curve at a certain numerical value indicate two sets of predominating parameters, material or inhomogeneous contamination of the surface (partly covered by skin layers or dust). The Weibull distribution, however, represents a “limit distribution” or “extreme value distribution” applicable to a chain of links with independent strength values rather than to the resistance values of contacts [30,31,32,33]. Cumulative probability curves of the resistance values obtained from measurements on corroded contacts employing rising voltage and current stresses as shown in (Figure 18.1) yield curves as shown in Figure 18.2. The resistance values obtained at minimum voltage and current yield normal distribution curves (straight lines) representing the contact resistance values caused by mechanical damage of the surface layer without or with wipe, respectively. There appears a sharp bend upwards, however, as soon as the product contact resistance times current exceeds the value 60 mV, corresponding to the softening temperature of the contact material. The contact spot which might have shown higher resistance values at the very moment of contact make immediately became deformed until the temperature of the contact restriction area fell below the softening point.
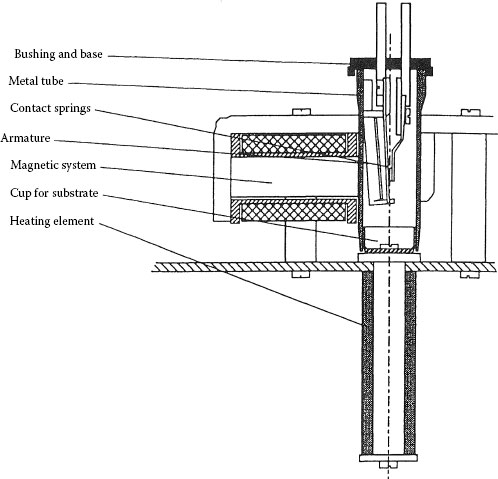
FIGURE 18.3
Model switch for testing the influence of individual organic materials on contact reliability. (From Neufeld C.N. and Rieder W.F., IEEE Trans CPMT-A, 18, 399–404, 1995.)
Therefore, at a certain current Ix the contact resistance cannot be higher than the critical resistance value Rx = Usoft × Ix and the distribution curve follows a vertical line owing to B-fritting, as long as any finite contact resistance was initially caused either by mechanical damage or by A-fritting of the surface layer. In case the layer was not damaged, however, the contact resistance is “infinite” and the distribution curve now follows a horizontal line. As the stressing voltage is increased, more contact sites can be A-fritted and the horizontal branch of the curve is shifted upwards. If the current is increased, however, the vertical branch is shifted toward lower resistance values. Under the conditions, yielding Figure 18.2 no A-fritting was needed after a wipe.
18.4.2 Contact Bounce Measurement
Both the duration of individual bounces and the total bounce time at make can easily be measured when the voltage across the bouncing contact is recorded [34,35,36,37,38,39,40,41,42]. The voltage limit between the boiling voltage and the minimum arc voltage of the contact material (e.g., Section 9.4.2) has to be chosen as the “open” criterion of the contact to allow for arcing during the bounce time. The bounce height can also be measured recording the voltage drop between the contacts, if a fast rising voltage signal is applied from a high resistance circuit too weak to maintain an arc. The rising voltage causes a breakdown across the contact gap when it attains a certain value corresponding to the momentary gap length. Immediately after breakdown the voltage rises again. The envelope of the resulting saw-tooth curve describes the variation of the contact gap during bouncing (Figure 18.4) [40].
A light beam [41,42] or a laser beam [43,44,45] can be used as an optical probe to measure the gap length, if the contact gap is arranged between the light or laser source and a photo-sensor. The probe has to be adjusted so that the contact motion produces a proportional variation in the amount of light arriving at the sensor (Figure 18.5). This direct method, however, requires optical access to the contacts and is not applicable during arcing and for the very narrow gaps of modern contactors bouncing merely about 0.1 mm, that is, of the order of surface irregularities inhibiting the light beam. Therefore, indirect optical methods are recommended, for example,
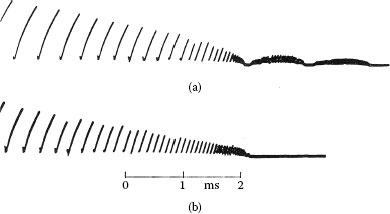
FIGURE 18.4
Contact bounce characteristics gained by no-load voltage oscillograms. (From Franken H., ETZ-B, 53–54, 1960.)
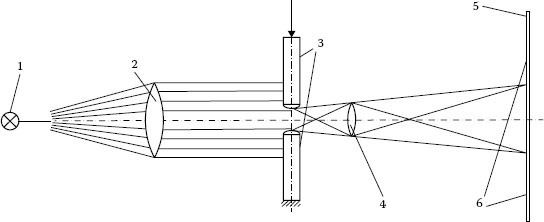
FIGURE 18.5
Principle of direct contact gap measurement with the aid of a light beam: 1, Sight source; 2, Sens; 3, contacts; 4, lens; 5, screen with scale; 6, shadow of the contacts. (From Erk A. and Finke H., ETZ-A, 86, 129–133, 1965.)
• Modulation of the intensity of a light beam by lightweight slot diaphragms connected with the contacts [42,46,47] or filters [48]
• Recording of the light reflected from white stripes on black papers fixed to each contact with the aid of a CCD camera (Figure 18.6) [34]
It has to be emphasized that it is not sufficient to record the motion of the moving contact only since even the fixed contact is usually subject to elastic oscillations caused by the impact at closure—not negligible when the electrode distance in moderately bouncing contacts has to be measured (see Section 13.4.3).
Mechanical models to investigate bouncing phenomena, for example, according to Figure 18.7, can be used to study impact phenomena or to determine the impact factor of a material [49,50]. A more sophisticated model also provides records of pre-impact arcing [48]. Purely mechanical tests can be executed also employing model switches with controlled bouncing [37,42,51,52,53].
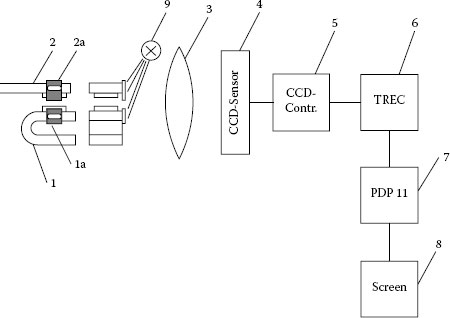
FIGURE 18.6
Record of light reflected from the contact carriers (1 fixed contact; 2 movable contact; 1a, 2a contrast stripes connected with the contacts; 3 lens; 4 CCD sensor; 5 CCD controller; 6 transient recorder; 7 computer; 8 graphic screen; 9 light source). (From Rieder W. and Weichsler V., IEEE Trans CHMT, 14, 298–303, 1991.)
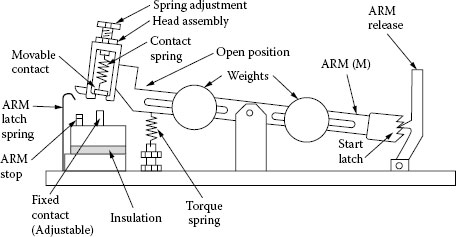
FIGURE 18.7
Bounce control mechanism according to Shaw. (From Shaw N.C., Proc. 2nd ICEC, Graz, 1964.)
A characteristic bounce diagram of a contact can be gained, when the “open” time of the contact recorded for each operation of a series (Figure 18.8a through d) is stored in a computer and finally the frequency of “open contact” is plotted versus time (Figures 18.8e and 18.9) [34,35]. Comparison of succeeding series shows the change of the bouncing behavior during the contact life [34].
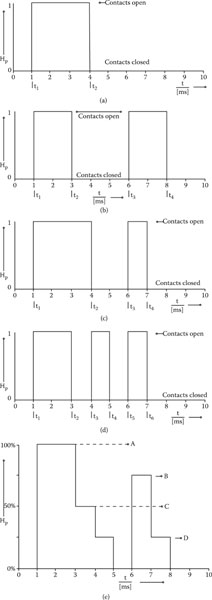
FIGURE 18.8
Statistical procedure for the representation of the bounce behavior: (a–d) Bounce patterns for four switching operations; (e) superposition of the four patterns (bounce diaigram); Hp: frequency of periods of open contacts. All four operations: Hp = 100% (A), three operations: Hp = 75% (B), two operations: Hp = 50% (C).
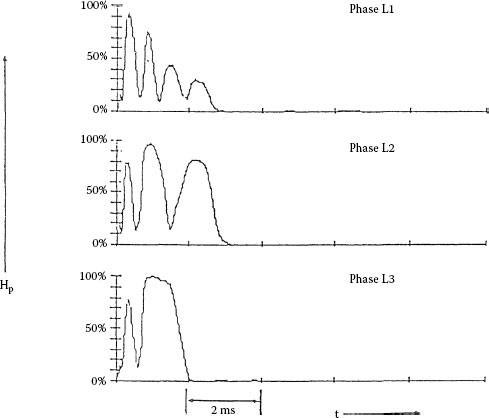
FIGURE 18.9
Bounce diagrams of the three poles of a contactor (1000 operations). (From Braumann P., Kolb H., Schroder K.H., and Weise W., Proc.16th ICEC, Loughborough, UK, 1992.)
18.4.3 Contact Welding Measurement
Contact welding is also discussed in Chapter 10, Section 10.5 where theoretical data and equations are discussed. Chapters 13 and 16 also includes examples and discussion of different kinds of welding showing some typical results. It is easy to see from voltage or current records whether or not a certain force or energy available by the drive of a certain switching device is able to break welded contacts. Often for commercial devices like relays life tests only record failure of contacts to open, welding, under the available opening force of the specific device being tested. This type of testing only produces information on the number of operations a contact can survive at a specific current, bounce condition, and opening force. A little more sophisticated approach is sometimes used in which partial or weaker welds are recorded, welds which open after a delay in time or after a few operations. These types of data have been used for characterizing contact welding [55,56]. These methods still do not provide information on weld distribution strength. It is more problematic, however, to define an objective measure of the weld strength. In an ideally brittle-elastic weld no yielding occurs and the weld breaks instantaneously when an applied increasing force exceeds the tensile strength. An ideally plastic weld, however, yields at constant force before it finally breaks [49]. Therefore, not only the momentary value of the opening force measured in the moment when real welds break but also the ranking of various materials may depend on the rate of rise of the force applied. Often the test force has been applied very slowly (10–100 N s−1) as compared with the separating force in certain actual switching devices during an impact of accelerated masses (104–105N s−1) [57]. Therefore, the fracture energy
(18.1) |
(where δ denotes strain) rather than the tensile strength, might be adequate to compare the weld strength of materials, yielding different rankings, for example, for various Ag/CdO materials [58,59]. The fracture energy depends very little on the strength velocity, if plastic deformation does not exceed velocity of sound in the material [60]. While the test force is usually applied perpendicular to the contact plane, the opening force in actual switching devices may provide a shearing component [61].
Freshly polished contacts yield reproducible results and the surface damage caused by an individual operation can be investigated in detail, thus offering some insight into the mechanisms of contact welding and erosion. Unfortunately, both welding and erosion of the first operation(s) are not necessarily representative of the contact behavior during the subsequent life.
Both welding and erosion are different whether or not
1. The direction of the test current is changed after each operation.
2. Each make operation is followed by a break operation as in service, depending on the break stress too (e.g., AC 3 or AC 4 duty conditions according to IEC-H 947-4).
Arc current and voltage have to be measured additionally if the weld strength is to be correlated with the make arc ∫dt or energy [55,62,63] (see Section 10.5.2).
Obviously the measured values of weld strength depend on a great number of uncontrolled design parameters and on the surface conditions generated by erosion and previous welds and last but not least the reproducibility of the opening force in test devices and actual switches. Therefore, it has to be emphasized that any kind weld strength measurements are yielding merely relative rather than absolute values.
18.4.3.1 Weld Strength Measured
If the weld strength is measured after each contact opening, usually its value is plotted versus current or of the arc preceding the welding process at make, other parameters being kept constant. Some authors have chosen the bounce arc energy as the independent variable but I or seems more meaningful for comparison of materials because the arc voltage cannot be chosen independently of the other characteristics of the material. The wide scatter of the weld strength requires a statistically relevant number of measurements; cumulative distribution curves for each set of parameters proved to be informative [64,65,66,67,68,69,70]. Often the first welds of each series yielded extremely high but well-reproducible values of the weld strength. Therefore, some authors tested only virgin contacts while others neglected a certain number of initial operations or tested only eroded contacts. Suppression of values obtained with new contacts, however, is not harmless since they may cause early failures in practical application. Since the surface of a contact material may change significantly with switching life owing to chemical and physical reactions, the welding resistance of the materials also changes with arcing life. Welding tests on materials should include weld data on both new and arced contact surfaces, Figure 18.10.
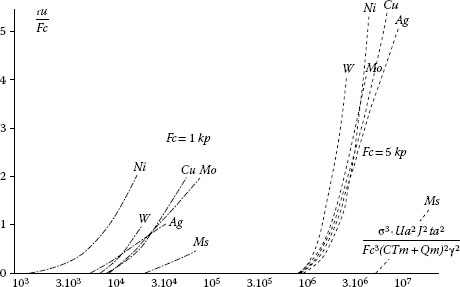
FIGURE 18.10
Dimensional analysis applied to welding of closing contacts. (From Rieder W. and Uranek J., Contact welding, Proc. 2nd ICEC, Graz, 1964.)
18.4.4 Contact Erosion Measurements
Weighing of contacts after a certain number of operations is not a problem, if the contacts are removable. In small contactors often only the contact bridge can be removed and both bridge contacts have to be weighed together. In most small devices the contacts are welded or staked into a copper alloy carrier. True erosion is difficult to measure since a portion of the erosion by splatter is collected on the carrier which can not be separated from the contact for weighing. If the contacts are replaced after weighing to continue the test series, their individual positions must be carefully re-established to avoid serious changes in the bouncing behavior.
Additional measurements are required if the amount of erosion is to be related to the stress data, for example, arc current, arc duration, arc energy or . For that purpose, arc data have to be measured at each operation and properly processed by a computer [56,63,71,72,73,74,75,76,77]. Switching of small DC currents may cause contact material transfer from one contact to the other rather than absolute losses. In this case the amount of transferred matter may be less important than its shape since pip and crater formation may impede contact opening and cause failure (Chapters 10 and 13).
Mapping of contact surfaces can be done by use of mechanical or laser probes with scanning devices [78]. These methods give both quantitative volume loss information, material transfer information, and information on surface topography, such as pip and crater formation. These methods lend themselves to research applications rather than routine quality checks. SEM photographs can also give information on the surface characteristics of erosion [79,80] but do not give information on volume loss.
18.4.4.1 Accelerated and Model Testing
18.4.4.1.1 Accelerated Testing/Similarity Laws
There are various proposals to accelerate time consuming erosion tests by
1. Reducing the number of operations at rated load and extrapolation assuming a constant erosion rate per operation.
2. Increasing the switching frequency at rated electrical load assuming switching frequency does not influence the result.
3. Reducing the number of operations at increased arc stress per operation (current Ia or arcing time ta) beyond the rated values and calculation of the erosion losses Δm at rated values assuming a purely empirical similarity law shown with no proof.
(18.2) |
18.4.4.2 Extrapolation at Rated Stress
This cannot be recommended because the erosion rates must not be assumed constant over the contact life as demonstrated in Section 18.2.5. Erosion curves might cross over and thus even qualitative ranking might depend on the number of operations, and also on the device. For example, in a relay, as the contact erodes, the over-travel of the contact decreases, which lowers the opening velocity and thus can change the erosion rate of the device.
18.4.4.3 Increase of the Switching Frequency
Increasing the switching rate at rated load is the only possibility to execute life tests in acceptable time. The contact system must not be thermally over-stressed, however. Otherwise welding may be favored and erosion losses may be unrealistically increased; in extreme cases the erosion mechanism may be changed (e.g., owing to cracking and peeling off according to Chapter 16) depending on both the design of the switching device (heat dissipation from the contacts, mechanical impact) and the contact material; thus even qualitative ranking might be changed, depending on the device. Accelerated testing is limited to much lower switching frequencies than those dictated by thermal overstressing if the critical effect, for example, fretting (Chapters 5 and 7), frictional polymerization (Chapter 7), corrosion (Chapter 2, Chapter 3 and Chapter 4), pyrolysis of organic vapors in switching arcs (Section 19.2) depends on diffusion and/or adsorption phenomena occurring between two succeeding operations.
18.4.4.4 Testing at Increased Electrical Load
This may thermally over-stress the contact arrangement more severely, like increased switching frequency, and correspondingly falsify the results. Additionally deviations from the assumed similarity law have to be expected.
Similarity laws, however, are problematic at any rate since they are merely empirical and cannot be explained in terms of physics. Various authors gave values for the exponents in Equation 18.2 in the wide ranges 1 ≤ x ≤ 3.7 and 0.6 ≤ y ≤ 3. Obviously such laws, if valid at all, are restricted to comparatively narrow ranges and dependent at least on the contact size, the thermal, mechanical (bounce), and magnetic parameters of the test device, the circuit parameters and—last but not least—on the contact material itself. Since some of these items are interrelated to current, such as contact bounce and material transfer, testing at increased loads is unlikely to be reliable for use in predicting results at lower currents. The proof of their applicability in each special case might require much more effort than the initially wanted tests. It has to be emphasized that the erosion rate increases discontinuously about an order of magnitude as soon as the arc root covers the available contact surface [81] (see Sections 10.3.2 and 10.3.3).
It has been proposed [82] to avoid the above-mentioned problems by not changing the specified test conditions between two measurements of the contact in order to calculate the erosion rate. An then as a next step to insert a series of tests with increased current to accelerate the erosion process by overload switching simply in order to produce new conditions for the next series of operations at rated load between two measurements yielding another erosion rate valid for a more eroded state of the contacts, etc. The author did not state, however, how the validity of such results were proved and how cracking was avoided.
Numerous authors simplified accelerated erosion testing employing fixed contact gaps and igniting the arc by a spark breakdown rather than by moving one of the contacts. Such procedures do not recognize that erosion is caused by both thermal (arc) stress and mechanical stress at closure. It has been shown that fixed-gap erosion may be just a fraction of actual make erosion of bouncing contacts with the same gap length and arc duration [83].
Fixed-gap tests providing only the thermal but not the mechanical stress on the contacts may enable certain insights into the erosion mechanism when compared with realistic tests but they are certainly not suited for development or quality control of contact materials.
18.4.4.6 Moving Contact Models
For make and break switching different erosion results depending on switching duty (See, for example, Figure 10.15) (ohmic, capacitive, resistive, lamp, motor load, etc.). In the special case of low DC switching, even the direction of material transfer may be different (Section 10.3.5). Since contacts in application may be used for:
• Make only
• Break only
• Various complete make-and-break cycles
There are contact erosion test machines applicable to each of those duties. Moreover, for research, separate investigations of make erosion and break erosion and even separation of make erosion at the site of contact parting (arc origin in the contact center) from that at the site of arc commutation (at the contact’s edge) might yield very important information about the complex mechanisms such as material transfer and erosion rate and its dependence on various parameters of both material and design, for example, bouncing, magnetic blast field, opening velocity, shape of contact edge, etc. (See, for example, Chapter 14).
1. Make-only erosion: Bouncing test machines already discussed don’t duplicate erosion in commercial devices but can give repeatable erosion results. Therefore, tests executed with such machines cannot replace development or acceptance tests of devices but they are needed for development and quality control of contact materials and for research. Bounce simulation models are also useful for erosion research [84]. Test machines developed to investigate contact welding at make can also be used for make erosion tests as a rule. Some of them are suited for break erosion tests too [64,65,85–89].
2. Break-only erosion: Test machines for investigation of erosion at break only need not consider bounce problems, but have to provide a magnetic blast field when magnet blast interrupter conditions are to be simulated because the erosion strongly depends on the time the arc remains on the contacts [90,91,92,93]. It has to be emphasized that the commutation delay causing edge erosion depends not only on the magnetic induction of the blast field but also on the opening velocity and on the geometry (height, rounding) of the contact edge at the site of commutation [94,95,96]. For fundamental investigations it may be important not only to separate make erosion from break erosion but also to distinguish between erosion at the site of arc origin (last point of mechanical contact before parting) and erosion at the site of arc commutation (at the contact’s edge). The latter can be suppressed by crow-barring the arc when it approaches the contact edge [96].
3. Make-and-break erosion: It has to be emphasized that make-and-break erosion is not necessarily equal to the sum of make erosion plus break erosion (cf. Sections 10.3.1 and 14.3) especially not under AC-3 conditions according to IEC-H 947-4 [97] and when DC circuits are switched. Therefore, test machines executing the total make-and-break cycle are required [64,65,73]. It is convenient if such test machines are also able to measure the weld strength when opening and the contact resistance after closure.
18.4.4.7 Evaluation and Presentation of Results
Cumulative erosion versus number of operations may yield a straight line according to a constant erosion rate per operation. Initial deviations from the straight line may be caused by the structure of the virgin surface different from the equilibrium state attained after a certain number of operations, and often may be neglected. Changes in the erosion rate may be also caused by changes in contact force from erosion and the resulting changes in switching characteristics such as bounce and opening velocity. The end of the contact life is often announced by a final increase of the erosion rate. Systematic changes of the erosion rate in the main part of the erosion curve may be caused by various effects that change as a result of material microstructure or operating parameter as a result of contact erosion. They may yield important hints concerning design, material, or over-stressing.
18.4.5 AC Arc Reignition Measurement
The instantaneous reignition voltage of a contact gap is independent of the contact distance and may be investigated either in opening or in fixed gaps. During the first tens of microseconds after current it is nearly constant unless a blast field is applied. The values of the reignition voltage have wide scatter, with the minimum value being the most important (Figure 9.55 in Section 9.7 and Figures 14.10 and 14.11 in Section 14.3.3).
18.4.6 Arc Motion Measurements
1. High-speed cinematography is the most traditional method used to measure arc motion. There are two techniques available.
(a) Frame technique yields two-dimensional pictures of the arc. Short exposure time and high movie frame rate are realized by a rotating shutter and a rotating prism yielding excellent information on arc structure at limited frame rate.
(b) Streak technique yields continuous but only one dimensional information since the second dimension is needed for the time.
Both techniques need free optical access; development, evaluation and storage of the exposed films is time consuming and expensive.
2. Multiple exposed still photographs require less effort than the above techniques and are rather convenient for measuring semi-continuous, not too fast arc motion in one direction.
A rotating screen with radial slits (rotor-core disk) positioned between a still camera with open shutter and the moving arc exposes the film to the arc only when a slit is passing the optical path between arc and camera. The resulting photograph (Figure 18.11) shows two-dimensional pictures of the arc in well-defined time intervals which can easily be evaluated [98].
Electronic optical devices do not yield immediate optical pictures like photographs but they are extremely fast (1000 images per millisecond) and convenient; the information gained can easily be stored and evaluated in various ways. Therefore, they are especially suited for series measurements.
1. Analog devices. A very fast, easily applicable and cheap type of arc position indicator yields reliable information of the position of the light emission center of an arc with the aid of a simple pinhole diaphragm. The photographic film is replaced by a large (5 cm × 5 cm) biaxial Au–Si–Schottky-semiconductor. The arriving light produces carriers at the site of incidence and finally an electrical signal exactly proportional to the x and y position of the center of (light emission’s which can be fed directly into an oscilloscope or a computer [99]).
2. Digital devices. Both motion and structure of an arc can be recorded with the aid of a line of light guides arranged along the arc path, each light guide connected to a photodiode. Opaque walls between the arc path and the observer are not prohibitive because a very narrow slit (0.1 mm) in front of the receiving ends of the light guides yields sufficient access. Special resolution (distance between the axes of two neighboring light guides) down to 0.4 mm can be achieved easily [99,100].
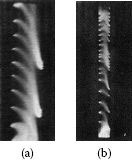
FIGURE 18.11
Arc motion (upwards) shown by multiple exposure of a still film (25 exposures per sec, cathode left). (From Eidinger A. and Rieder W., Archiv für Elektrotechnik, 43, 94–114, 1957.)
If two-dimensional information is needed, a number of light sensors (light guides) can be arranged, for example, in three lines along two arc runners and the middle line between them [101,102] or forming a two-dimensional matrix scanning the arc chamber of a circuit-breaker [103,104].
Although an arrangement of light guides along the arc path requires just a 0.1 mm slit in the lateral wall of an arc chamber, there is also a possibility of avoiding any slit in an opaque wall when the moving arc is detected by magnetic probes arranged along the wall outside the arc chamber [105].
18.4.6.3 Model Switch Arc Motion Control
Self-Induced Fields: In most commercial magnet blast interrupters the switching arc is moved by the “self-field” induced by the current to be interrupted as it flows through the arc electrodes (contacts or runners) and their connecting leads. In this case the magnetic field strength is proportional to the arc current, but also depends on the geometry of the electrodes (including their distance!) and their connections. Therefore, the magnetic induction of such arrangements cannot be kept constant or arbitrarily varied independently of the arc current, the arc length, and the electrode geometry.
External Fields: Consequently in numerous experiments the effective magnetic field has been externally induced by a Helmholtz coil, independent of the arc current and of the electrode geometry, while any self-field has been avoided by symmetrical feeding of the current into the electrodes. Also there has been some use of permanent magnets in the development of dc switches for circuit voltages >100 V.
Figure 18.12a shows how identical electrodes can be employed for either self-blast or external field experiments. Of course, both fields can be superimposed. Thus, it has been shown [106,107] that there is always a certain equivalent value of the homogeneous external field which causes the same arc behavior as the self-field induced by any given electrode geometry. This equivalent external field value corresponds to the mean value of the self-field inside the volume of the arc.
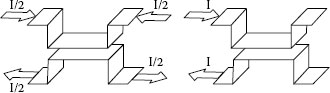
FIGURE 18.12
Electrode configuration used for experiments (a) without and (b) with magnetic self-field. (From Michal R., IEEE Trans CHMT, 4, 109–114, 1981.)
18.4.6.4 Evaluation and Presentation of Results
The electrical signals obtained from the light sensors may be evaluated with the aid of sophisticated computer programs. Results of this approach have been published by a number of researchers investigating arc motion and structure [99,100,108]. In Figure 18.13a, the marks along the abscissa correspond to the position of 30 light sensors along the arc path, and the light intensity received by each sensor is plotted along the ordinate. The curve obtained shows the momentary structure of the arc column in the direction of arc motion. The next curve of this type obtained a certain time interval (e.g., 1 μs) and later is shifted somewhat in the direction of the ordinate etc. The total diagram shows how the arc column proceeds (from left to right) and how it changes its shape. Figure 18.13b shows the corresponding smear photograph. Figure 18.14a shows a similar but three-dimensional view: time is plotted in the y-direction and light intensity in the z-direction (light–mountain chain). In Figure 18.14b is a contour plot of light intensity in terms of time and distance. It corresponds to the three-dimensional light intensity, time, and distance plot. It can be immediately compared with a smear photograph but gives more detailed information about light-intensity distribution.
18.4.7 Arc-Wall Interaction Measurements
Severe interaction of the switching arc with the insulating wall next to the contacts may not only damage the contacts but also the wall surfaces owing to either metallization of any material or carbonization of organic materials. The break-down effect can be characterized by measurement of either the surface resistance (leakage current after each interruption [109] or the surface flashover voltage between two probe wires inserted into the wall next to the contacts and energized a certain time (e.g., 1 ms) after interruption or arc commutation from the contacts [108]. What is recorded is dependent on what is important for your commercial device.
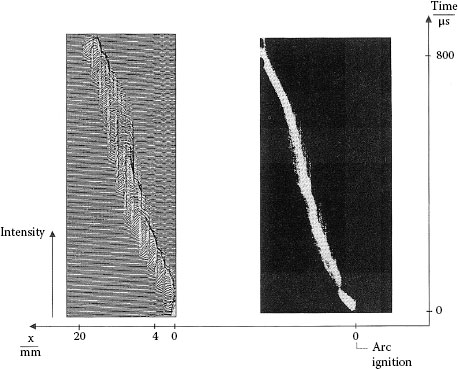
FIGURE 18.13
(a) Light-intensity signals indicated by 30 light sensors arranged along the abscissa. The individual lines (from down to top) have been plotted in 1-μs intervals showing the behavior of an arc moving from right to left, (b) Corresponding smear photograph.
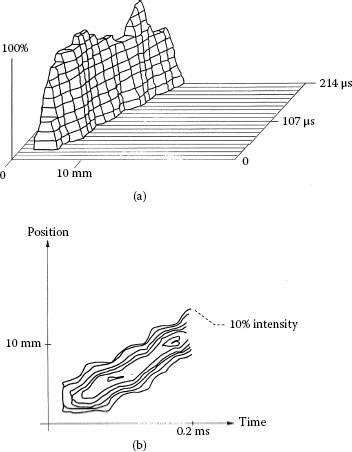
FIGURE 18.14
(a) Three-dimensional plot of light-intensity curves of an arc moving from left to right (time in y-direction), (b) Lines of constant light intensity in the time-position plane. (Contour lines of the light-mountain chain shown in [a]). (From Michal R., IEEE Trans CHMT, 4, 109–114, 1981.)
1. G Witter, Z Chen. A comparison for the effects of opening speed, contact gap, and material type on electrical erosion for relays interrupting inductive automotive loads. ICECP: 17–21, 2006.
2. Z Chen, G Witter. A comparison of contact erosion for opening velocity variations for 13 volt circuits. IEEE Holm Conference 2006, pp. 15–20.
3. G Witter, I Polevoy. Contact erosion and material transfer for contacts in automotive relays. Proceedings of the ICECP and IEEE Holm Conference on Electrical Contacts, Chicago, IL, 1996, pp. 223–228.
4. Z Chen, G Witter. A study of contact endurance switching life as a function of contact bond quality, contact electrical load and residual stresses for silver tin indium oxide composite rivet contacts. IEEE Holm Conference 2012, pp. 172–177.
5. F Borst, C. Neufeld, W. Rieder, Moderne Versuchstechnik. VDE-Fachbericht 42: 39–45, 1991.
6. L Jing, Z Guansheng. An experimental investigation of the dynamic contact characteristics on the relay contacts. Proceedings 38th Holm Conference, 1992, pp. 209–212.
7. L Jedynack, CH Kopper. Instrumentation for measuring dry-circuit contact resistance. IEEE Trans PHP-11: 130–134, 1975.
8. RE Cuthrell, LK Jones. Surface contaminant characterization using potential-current curves. IEEE Trans CHMT-1: 167–171, 1978.
9. W Johler, W Rieder. Kontaktzuverlässigkeit bei Relais im Kleinlastbetrieb. VDE-Fachbericht 38: 131–140, 1987.
10. K Millian, W Rieder. Kontaktwiderstand und Kontaktoberfläche. Zeitschrift für angewandte Physik 8: 28–31, 1956.
11. KE Pitney. The ASTM method of test for micro contacts. Proceedings of the 11th Holm Seminar, 1965, pp. 293–311.
12. DV Keller, Jr. Electric contact phenomena in ultra clean and specifically contaminated systems. Proceedings of the 17th Holm Seminar, 1971, pp. 1–12.
13. GR Crane. Contact resistance on surfaces with non-uniform contaminant films. IEEE Trans CHMT-4: 5–9, 1986.
14. W Merl, M Mittmann. Eine Apparatur zur wiederholten Messung und Registrierung des Kontaktwiderstandes für statistische Untersuchungen. Proceedings of the 5th ICECP, 1970, pp. 320–323.
16. M Antler. Contact resistance probing: Development of a standard practice by the American Society for Testing and Materials. Proceedings of the 10th ICECP, 1980, pp. 13–21.
17. GL Horn. Nachweis der Reinheit technischer Kontaktoberflächen durch eine automatisierte Meßmethode des Kontaktwiderstandes. Proceedings of the 8th ICECP, 1976, pp. 499–503.
18. M Füger, J Horn. Kontaktwiderstandsmeßplatz zum punktweisen Abtasten ebener Proben. Radio fernsehen Elektronik 28, 1979, pp. 596–599.
19. M Huck. Der Kontaktwiderstand, eine statistische BeurteilungsgröEe zur Gewährleistung der Kontaktzuverlässigkeit, Qualität und Zuverlaässigkeit. Zeitschr f industrielle Qualitätssicherung Nr. 10: 1980.
20. M Antler. New developments in the surface science of electric contacts. Plating 53: 1431–1439, 1966.
21. W Chow, E Stepke. An evaluation of the tarnish resistance of electroplatings and contact materials. Proceedings of the 15th Holm Seminar, 1969, pp. 99–110.
22. G Witter, R Leiper. A study of contamination levels measurement technique, testing methods, and switching results for silicon compounds on silver arcing contacts. Proceedings of the IEEE-Holm Conference on Electrical Contacts, 1992, pp. 173–180.
23. JL Queffelec, N BenJemaa, D Travers. Activation de contacts de relais électro-mécaniques par leurs propres produits organiques de dégazage en atmosphére confinée, en faction de la témperature. Rev Gén El 89: 577–586, 1980.
24. T Ide, T Sakurai, T Sasamoto. Contact reliability evaluation of plastic sealed relay. Proceedings of the 31st Ann Nat Relay Conf (NARM), 1983, pp. 7-1–7-7.
25. K Yoshida, Y Aoyama, M Isagowa, K Shirakura. Evaluation of contact failure by vaporized organic gases. Proceedings of the 31st Holm Conference, 1985, pp. 191–199.
26. B Göttert. Eine Methode zur Auswahl von Kunststoffen bezüglich der Kontak-freundlichkeit in Miniaturrelais. VDE-Fachbericht 38: 79–84, 1987.
27. B Göttert, U Rauterberg. Evaluation of the influence of organic vapors on relay contacts. Proceedings of the 36th Ann Nat Relay Conf (NARM), 1988, pp. 15-1–15-9.
28. CN Neufeld, WF Rieder. Carbon contamination of contacts due to organic vapors. IEEE Trans CPMT-A18: 399–404, 1995.
29. B Göttert. Kunststoffausgasungen von Klebefolien beeinflussen Kontaktmaterialien. ETZ 112: 1216–1221, 1991.
30. E Tittes. Über die Anwendung statistischer Methoden auf die Auswirkung von Versuchen mit elektrischen Kontakten. Proceedings of the 7th ICECP, 1974, pp. 327–332.
31. D Lange. Statistische Auswertung von Kontaktwiderstandsmessungen. Elektrie 34: 423–426, 1980.
32. D Lange. Der Zusammenhang zwischen einer Fremdschicht auf Kontaktoberflächen und der logarithmischen Normalverteilung. Elektrie 37: 371–374, 1983.
33. EA Santer. Mathematical statistics in electrical contact engineering. Proceedings of the 11th ICECP, 1982, pp. 68–70.
34. W Rieder, V Weichsler. Make erosion on Ag/SnO2 and Ag/CdO contacts in commercial contactors. IEEE Trans CHMT-14: 298–303, 1991.
35. P Braumann, H Kolb, KH Schröder, W Weise. Optimization of Ag/SnO2 contact material for use in contactors. Proceedings of the 16th ICECP, 1992, pp. 163–173.
36. R Jin. Relay contact bounce measurement. Electronics (USA): 28(8): 137–139, 1955.
37. NC Shaw. Investigations of contact bounce and contact welding. Proceedings of the 2nd ICECP, 1964, pp. 286–299.
38. F Rating, A Walter. Digitales Meßgerät zum Erfassen der Prelldauer. ETZ-B 17: 557–559, 1965.
39. G Kovács. Laboratory investigations and applicational testing of DIL relays for telecommunication. Proceedings of the 16th ICECP, 1992, pp. 315–321.
40. H Franken. Pie Messung von Kontaktprellungen bei Schaltgeräten. ETZ-B: 53–54, 1960.
41. KK Kennedy. Relay vibration studies. Bell Lab Rec 31: 141–146, 1953.
42. A Erk, H Finke. Über die mechanischen Vorgänge während des Prellens einschaltender Kontakte. ETZ-A 86: 129–133, 1965.
43. A Yonezawa, K Mano. Some investigations of measuring method of contact gap and contact motion. Proceedings of 21st Holm Seminar, 1975, pp. 93–98.
44. BZ Sandler, A Slonim, M Slonim, A Tslaf, M Weinberg. A method of measuring small displacements. Israel J Technology 16: 234–237, 1978.
45. AA Slonim. Analytical and experimental analysis of nonlinear bouncing contacts. ICECP 12: 531–537, 1984.
46. MR Swinehart. Instrumentation for analysis of contact wear. El Eng 70: 414, 1951.
47. G Cießow, F Koppelmann. Untersuchung des Prellens eines periodisch schaltenden Federkontaktes mit Hilfe eines optischen Schwingblendenverfahrens. ETZ-A 82: 111–114, 1961.
48. JW McBride, SM Sharkh. Electrical contact phenomena during impact. IEEE Trans CHMT-15: 184–192, 1992.
49. P Barkan. A study of the contact bounce phenomenon. IEEE Trans PAS-86: 231–240, 1967.
50. S Dzierzbicki, E Walczuk. Einfluß der Veränderlichkeit der Stoßzahl auf die Berechnung-sergebnisse der Kontaktabhebungen. 3. Tagung “Kontakte der Elektrotechnik, 1967, pp. 161–166.
51. W Schaffer. Über das Schweißverhalten einschaltender Starkstromkontakte. Int Wiss Koll Ilmenau 13: 113–120, 1968.
52. A Wollenek. Die Schweißneigung prellender Starkstromkontaktstücke. VDI-Zeitschr 102: 1053–1088, 1960.
53. A Erk. Über die thermische Beanspruchung von Starkstromkontaktstücken bei Kurzzeit-belastung mit hohen Strömen. ETZ-A 85: 226–231, 1964.
54. W Rieder, J Uranek. Contact Welding. Proceedings of the 2nd ICECP, 1964, pp. 193–195.
55. T Ito, H Iwase, K Mano. Experimental study of contact arc discharge and contact welding phenomena. Proceedings of the 27th Holm Conference, 1981, pp. 35–44.
56. W Balme, P Braumann, K-H. Schröder. Welding tendency, contact resistance and erosion of contact materials in motor vehicle relays. Proceedings of the 15th ICECP, 1990, pp. 79–84.
57. W Schaffer. Untersuchung des dynamischen Trennens verschweißter Starkstromkontakte. Proceedings of the 5th ICECP Pt 2, 1970, pp. 52–56.
58. W Schaffer. Untersuchung der Trennenergie verschweißter Starkstromkontakte. Elektrie 25: 305–306, 1971.
59. E Geldner, W Haufe, W Reichel, H Schreiner. Schweißkraft verschiedener Kontaktwerkstoffe beim dynamischen und statischen Öffnen der Kontaktstücke. Bull SEV 65: 236–240, 1974.
60. J Peters. Ein Verfahren zur Prüfung von Kontaktwerkstoffen unter den Bedingungen des dynamischen Verschweißens. Elektrie 29: 550–553, 1975.
61. E Geldner, W Haufe, W Reichel, H Schreiner. Ursachen der Schweißbrückenbildung und Einflüsse auf die Schweißkraft elektrischer Kontaktstücke in der Energietechnik. ETZ-A 93: 305–306, 1972.
62. A Carballeira, J Galand. Accelerated testing for determining erosion and welding behavior of silver based contact materials. Proceedings of the 9th ICECP, 1978, pp. 329–334.
63. K Mano, H Iwase. Automated measuring methods for discharge durations and energy in electrical contacts. IEEE Trans CHMT-2: 65–70, 1979.
64. H Schreiner, W Haufe. Messung der Schweißkraft, des Abbrandes und des Kontakt-widerstandes von Kontaktwerkstoffen für die Energietechnik. Zeitschr f Werkstoffkunde/J of Materials Technol 7: 381–389, 1976.
65. H Schreiner, W Haufe. The properties of p/m electrical contact materials. Int J Powder Metallurgy & Powder Technology 12: 219–228, 1976.
66. E Geldner, W Reichel, E Schreiner. Prüfschalter zur Messung der Schweißkraft von Kontaktwerkstoffen für Starkstromtechnik. ETZ-A 92: 637–642, 1971.
67. H Schreiner. Schweißkraft elektrischer Kontaktwerkstoffe und deren Prüfmethode. Proceedings of the 4th ICECP, 1968, pp. 187–190.
68. W Haufe, W Reichel, H Schreiner, R Tusche. Einfluß der Schaltzahl und Polarität des Prüfstromes auf die Statistik der Schweißkraftwerte von Reinsilber bei synchronem und unsynchronem Schließen der Kontaktstücke. Bull SEV 63: 461–467, 1972.
69. G Ludwar, W Rieder. Contact welding in vacuum at make. Proceedings of the 13th ICECP, 1986, pp. 156–160.
70. J Muniesa. Silver-tin oxide materials used in low voltage switching devices. Proceedings of the 15th ICECP, 1990, pp. 139–142.
71. JR Pharney, FS Gowaty. A technique for measuring net charge through transient arcs which occur across a contact breaking an inductive load. Proceedings of the 20th Holm Seminar, 1974, pp. 75–80.
72. MAK Pramanik, T. Takagi, K Mano. A new method for the measurements and integration of arc durations in electrical contacts. IEEE Trans IM-24: 188–193, 1975.
73. HJ Desmet. Testing and evaluating contact materials for erosion characteristics. Proceedings of the 22nd Holm Seminar, 1976, pp. 149–154.
74. E Needham. Computer controlled testing and evaluation of contact materials in 3-phase ac devices. Proceedings of the 28th Holm Conference, 1982, pp. 87–94.
75. K Suhara. Break arcs in inductive circuits and the minimum arc current. Proceedings of the 15th ICECP, 1990, pp. 94–101.
76. K Mano. New proposal for test methods of electrical contacts and their characteristics indications. Proceedings of the 16th ICECP, 1992, pp. 29–34.
77. H Fang, J Jiang, R Mou. The study of the relationship between arc duration and arc energy of relay and microswitch contacts. Proceedings of the 38th Holm Conference, 1992, pp. 167–172.
78. JW McBride, KJ Cross, SM Abu Sharkh. The evaluation of arc erosion on electrical contacts using three-dimensional surface profiles. IEEE Trans CPMT-A19: 87–97, 1996.
79. CH Leung, A Lee. Electric contact materials and their erosion in automotive dc relays. Proceedings of the 37th Holm Conference, 1991, pp. 114–121.
80. CH Leung, A Lee. Contact erosion in automotive dc relays. Proceedings of the 15th ICECP, 1990, pp. 85–93.
81. HW and C Turner. Discontinuous contact erosion. Proceedings of the 3rd ICECP, 1966, pp. 311–320.
82. D Dimitrov, P Parvanov, S Stefanov, M Tronkova. Accelerated test of the electrical endurance of contact members of commutation low-voltage apparatus by means of increasing the value of the test current. Proceedings of the 8th ICECP, 1976, pp. 627–631.
83. W Rieder, V Weichsler. Make erosion mechanism of Ag/CdO and Ag/SnO2 contact. IEEE Trans CHMT-15: 332–338, 1992.
84. E Hetzmannseder, W Rieder. The influence of the bounce parameters on the make erosion of silver/metal-oxide contact materials. IEEE Trans CPMT-A17: 8–16, 1994.
85. H Schreiner. Prüfstrategie und Simultanprüfung der funktionswichtigen Eigenschaften von Kontaktwerkstoffen der Energietechnik mit einem Prüfschalter. ETZ Archiv 2: 307–310, 1980.
86. AM Suggs. An electrical contact testing machine. ASTM Bull No. 119: 25–30, 1942.
87. W Friedemann, P Leis. Modellprüfanlage zur Ermittlung des Einschaltabbrandes und des dynamischen Schweißverhaltens. Proceedings of the 7th Kontakttagung der DDR, 1983, pp. 158–162.
88. JP Guerlet, H Ladenise, C Lambert. A simple testing machine for the evaluation of the main electrical properties of contact materials. ICECP 12: 525–530, 1984.
89. A Carballeira, J Galand. A new equipment for evaluating welding and erosion tendencies of electrical contacts. Proceedings of the 8th ICECP, 1976, pp. 633–638.
90. KH Schröder, ED Schulz. Der Einfluß des Trennaugenblickes auf den Lichtobogenabbrand öffnender Kontaktstücke beim Wechselstromschalter. Metall 28 (5): 1974.
91. H Hauer. Über den Einfluß des magnetischen Blasfeldes auf den Ausschaltabbrand elektrischer Kontakte. e & i 107: 63–71, 1990.
92. Walczuk. Experimental study of Ag–W–Re composite materials under high current conditions. IEEE Trans CHMP-10: 283–289, 1987.
93. M Lindmayer, E-D. Schulz. Prüfverfahren für ausschaltende Kontaktstücke. ETZ-A 98: 142–146, 1977.
94. W Widmann. Arc commutation across a step or a gap in one of two parallel copper electrodes. Proceedings of the 12th ICECP, 1984, pp. 329–339.
95. H Manhart, W Rieder, C Veit. Arc mobility on new and eroded Ag/CdO and Ag/SnO2 contacts. IEEE Trans CHMT-12: 48–57, 1989.
96. H Manhart, W Rieder. Erosion behavior and “erodibility” of Ag/CdO and Ag.SnO2 contacts under AC3 and AC4 test conditions. IEEE Trans CHMT-13: 56–64, 1990.
97. E Hetzmsnndrfrt, W Rieder. Make and break erosion of Ag/MeO contact materials. IEEE Transactions CPMT-A19: 397–403, 1996.
98. A Eidinger, W Rieder. Das Verhalten des Lichtbogens im transversalen Magnetfeld. Archiv für Elektrotechnik 43: 94–114, 1957.
99. R Michal, J Wassermann. Optoelectronical position indicators applied to arc-motion research. IEEE Trans CHMT-6: 92–99, 1983.
100. J Wassermann, W Ziegler. Quantitative recording of arc motion and structure through opaque walls. Proceedings of the 14th ICEC, 1988, pp. 69–74.
101. A Lee, YK Chien, PP Koren, PG Slade. High current arc movement in a narrow insulating channel. IEEE Trans CHMT-5: 51–55, 1982.
102. E Gauster, W Rieder. Arc–wall interaction phenomena immediately after contact separation in magnet-blast interrupters. Proceedings of the 41st Holm Conference, 1995, pp. 355–363.
103. JJ Shea, D Boles, YK Chien, R Zeigler. Computer animated digital arc diagnostic system. IEEE Trans CHMT-A17: 47–52, 1994.
104. PH Wearer, JM McBride. Magnetic and gas dynamic effects on arc motion in miniature circuit breakers. IEEE Trans CHMT-A17: 39–45, 1994.
105. J Wassermann, T Strof, W Rieder. Measurements of arc motion on electrical contacts through unperforated opaque walls. Proceedings of the 14th ICECP, 1988, pp. 69–74.
106. R Michal. Theoretical and experimental determination of the magnetic blast field due to the current flow in the electrodes. IEEE Trans CHMT-4: 109–114, 1981.
107. H Manhart, R Michal. Arc motion on AgMeO with special regard to the utilization categories of contactors. Metall 41(1): 49–53, 1987.
108. W Rieder, C Veit, E Gauster. Interaction of magnetically blown break arcs with insulating walls in the contact region of interrupters. IEEE Trans CHMT-15: 1123–1137, 1992.
109. HW Turner, C Turner, RC Melbourne. Testing and evaluation of contacts and insulating materials in switching devices with computerized control. Proceedings of the 10th ICECP, 1980, pp. 1069–1078.