
You are probably comfortable with WMS and including WMS layers in a web application. When you need more control over your data, it's time to switch to WFS.
Unlike WMS, a WFS request brings you the actual raw data in the form of features. By working with the features directly, you are no more dealing with a static rendering of features, that is, a map; you can take fine control of the shapes by setting drawing rules on the client side.
WFS comes in several different flavors or, more precisely, in different protocol versions. GeoServer supports 1.0.0, 1.1.0, and 2.0.0. Each version differs in the formats supported and the query capabilities supported. For example, WFS 2.0.0 supports the use of temporal queries and joins.
Note
If you are curious about the details of WFS and GML, check out the reference documents for WFS and GML in the OGC repository at http://www.opengeospatial.org/standards/is. Here, look for the following files:
OpenGIS® Geography Markup Language Encoding Standard (GML)OpenGIS® Web Feature Service (WFS) Implementation Specification
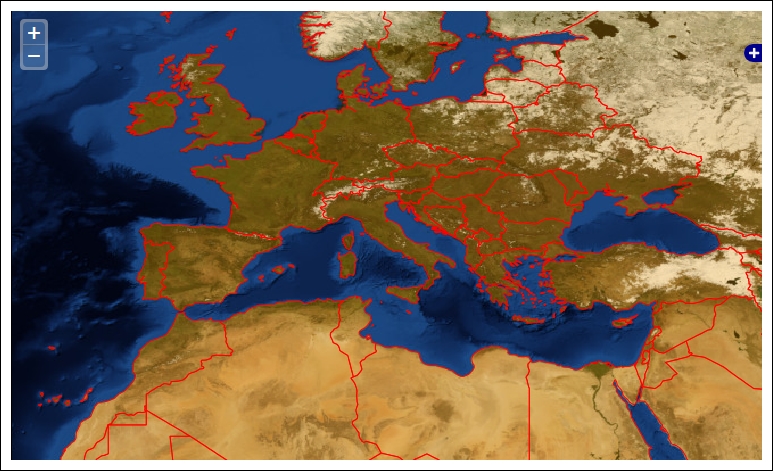
The following screenshot shows the map you're aiming for:
- Create an HTML file and insert the following code snippet:
<html>
  <head>
    <title>Dealing with WFS version</title>
    <meta http-equiv="Content-Type" content="text/html; charset=UTF-8">
  <body onload="init()">
    <div id="myMap"></div>
  </body>
</html>
Tip
Downloading the example code
You can download the example code files for all Packt books you have purchased from your account at http://www.packtpub.com. If you purchased this book elsewhere, you can visit http://www.packtpub.com/support and register to have the files e-mailed directly to you.
- Create a style for the map, defining the size and aspect:
<style type="text/css"> #myMap { clear: both; position: relative; width: 750px; height: 450px; border: 1px solid black; } </style> - Insert a reference to the
OpenLayerslibrary:<script type="text/javascript" src="http://openlayers.org/api/2.13.1/OpenLayers.js"></script>
- Now start coding in JavaScript and add new map objects:
<script type="text/javascript"> function init() { map = new OpenLayers.Map({ div: "myMap", //We don't want any layers as base map allOverlays: true, - Add the Blue Marble layer, which is a standard WMS layer:
layers: [ new OpenLayers.Layer.WMS("Blue Marble", "http://localhost/geoserver/wms", {layers: "NaturalEarth:blueMarble", format: "image/png", transparent: false} ), - Now, add a vector layer using the WFS protocol:
new OpenLayers.Layer.Vector("countries", { strategies: [new OpenLayers.Strategy.BBOX()], protocol: new OpenLayers.Protocol.WFS({ url: "http://localhost/geoserver/wfs", featureType: "countries", featureNS: "http://www.naturalearthdata.com/", // Mind the geometry column name geometryName: "geom" }), - Insert a style to render the vector features:
styleMap: new OpenLayers.StyleMap({ strokeWidth: 3, strokeColor: "#FF0000", strokeWidth: 1, fillColor: "#ee9900", fillOpacity: 0.3 }), }) ], - Zoom in to the map and center it on Europe:
center: [12.48, 42.60], zoom: 4 }); map.addControl(new OpenLayers.Control.LayerSwitcher()); } </script> </head> - Save the file in a folder published on your server, such as
TOMCAT_HOME/webapps/ROOT, and point your browser to it. You should get a map that looks like the one shown in the introduction to this recipe. - Now, switch the request to another version. We will use v1.1.0 and the JSON format:
new OpenLayers.Layer.Vector("countries", { strategies: [new OpenLayers.Strategy.BBOX()], protocol: new OpenLayers.Protocol.WFS.v1_1_0({ url: "http://localhost:8080/geoserver/wfs", featureType: "countries", featureNS: "http://www.naturalearthdata.com/", geometryName: "geom", outputFormat: "JSON", }), - Reload your document inside the browser and check that your map looks the same.
We are using a JavaScript application to perform a WFS query on GeoServer. This is a common use case in the era of web mapping, besides using the OpenLayers framework to assist you in building a complicated request.
The HTML and CSS part of the script is quite easy. As you must have noticed, the core of this little program is the init() function, which is called at page loading.
We first create a map object and set the allOverlays variable to true. The default value of false makes it mandatory for a layer to be basemap; in this recipe, we don't want to have basemap, which is a layer that is always turned on in the map:
allOverlays: true,
Then, we start to add data on the map. First, we use the raster data from the NASA Blue Marble dataset. We use the OpenLayers.Layer.WMS class; you just need to set a name and URL for the WMS service. The format and transparent parameters are optional, but they let you control the file produced by GeoServer. The code is as follows:
          layers: [
            new OpenLayers.Layer.WMS("Blue Marble",
              "http://localhost/geoserver/wms",
              {layers: "NaturalEarth:blueMarble", format: "image/png", transparent: false}
),Then we create a new layer using the OpenLayers.Layer.Vector class, and this layer can use a different source data format:
new OpenLayers.Layer.Vector("countries", {We add a strategy, BBOX, to let OpenLayers query the server for data intersecting the current map extent:
strategies: [new OpenLayers.Strategy.BBOX()],
With the protocol parameter, we set the data format. Of course, we use WFS, and this class defaults to the 1.0.0 version of the standard:
protocol: new OpenLayers.Protocol.WFS({We need to set some mandatory parameters when invoking the constructor for the WFS class. The geometryName parameter is optional, but it defaults to the_geom value. So, you need to set it to the actual name of the geometry column in your data. The code is as follows:
                url: "http://localhost/geoserver/wfs",
                featureType: "countries",
                featureNS: "http://www.naturalearthdata.com/",
                geometryName: "geom"
WFS returns raw data, not an image map like WMS. So, you need to draw each feature yourself; you have to set some rules for feature drawing. Inside the StyleMap class, you set the color, line width, and other rendering parameters that will be used to represent features in the map, as shown in the following code:
              styleMap: new OpenLayers.StyleMap({
                strokeWidth: 3,
                strokeColor: "#FF0000",
                strokeWidth: 1,
                fillColor: "#ee9900",
                fillOpacity: 0.3
What happens when you load this app in your browser? You can use a browser extension to check the actual request sent to GeoServer.
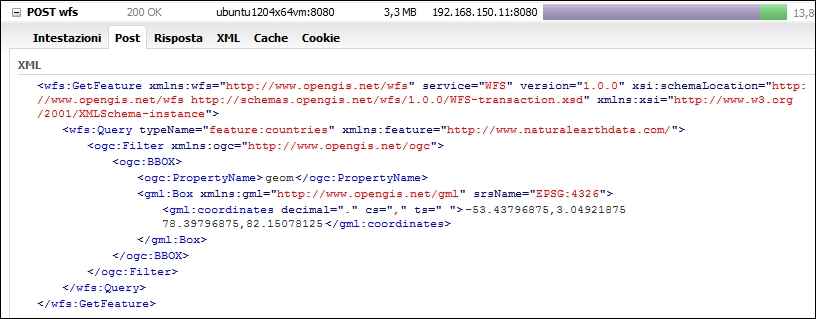
Using FireFox with Firebug, you should see a few requests upon loading the ch01_wfsVersion.html file. OpenLayers executes the POST WFS request with our parameters; you can see that the version is 1.0.0, the operation is GetFeature, and there is a bounding box filter defined in GML 2:
Now, try to load the ch01_wfsVersion110.html file; the request is a little bit different. Of course, now the version is 1.1.0, but the filter looks different as well:
<ogc:Filter xmlns:ogc="http://www.opengis.net/ogc">
  <ogc:BBOX>
    <ogc:PropertyName>geom</ogc:PropertyName>
    <gml:Envelope xmlns:gml="http://www.opengis.net/gml" srsName="EPSG:4326">
      <gml:lowerCorner>-53.43796875 3.04921875</gml:lowerCorner>
      <gml:upperCorner>78.39796875 82.15078125</gml:upperCorner>
    </gml:Envelope>
  </ogc:BBOX>
</ogc:Filter>
You need to be aware that WFS 1.1.0 uses GML 3, which uses a different representation of geometry. In this case, OpenLayers hides the complexity of creating the correct geometry filter.
You probably noted when downloading the Blue Marble dataset that the GeoTIFF file is quite a big file. To render this file, GeoServer must navigate the file contents and read blocks of pixels off the disk. To optimize data storage and enhance rendering speed, you can use GDAL tools to restructure the contents of the file for faster access.
If you have GDAL tools at your fingertips, you can check the metadata of the file:
:$ gdalinfo BlueMarbleNG-TB_2004-12-01_rgb_3600x1800.TIFF
…
Metadata:
  AREA_OR_POINT=Area
  TIFFTAG_RESOLUTIONUNIT=1 (unitless)
  TIFFTAG_XRESOLUTION=1
  TIFFTAG_YRESOLUTION=1
Image Structure Metadata:
  INTERLEAVE=PIXEL
…
Now, let's transform the file using a compression method to reduce the file size and tile the dataset for faster access:
:$ gdal_translate -of GTiff -co COMPRESS=DEFLATE -co TILED=YES BlueMarbleNG-TB_2004-12-01_rgb_3600x1800.TIFF blueMarble.tiff
Tiling organizes the file contents on disk into tiles, ideally locating blocks of pixels next to each other on disk. This optimization helps in performance when GeoServer is zoomed in to a small area of interest.
Then, we will add an overview to further hasten the data extraction:
:$ gdaladdo -r cubic -ro blueMarble.tiff 2 4 8 16 32 64
An overview creates a small summary image, which can be used by GeoServer when zoomed out. By drawing using the overview, GeoServer can read fewer pixels off disk and avoid having to sample through the entire file.
By executing the gdalinfo tool again, you can check that these have actually been applied successfully:
…
Metadata:
  AREA_OR_POINT=Area
  TIFFTAG_RESOLUTIONUNIT=1 (unitless)
  TIFFTAG_XRESOLUTION=1
  TIFFTAG_YRESOLUTION=1
Image Structure Metadata:
  COMPRESSION=DEFLATE
  INTERLEAVE=PIXEL
…
Band 1 Block=256x256 Type=Byte, ColorInterp=Red
  Overviews: 1800x900, 900x450, 450x225, 225x113, 113x57, 57x29
Band 2 Block=256x256 Type=Byte, ColorInterp=Green
  Overviews: 1800x900, 900x450, 450x225, 225x113, 113x57, 57x29
Band 3 Block=256x256 Type=Byte, ColorInterp=Blue
  Overviews: 1800x900, 900x450, 450x225, 225x113, 113x57, 57x29