
In the previous chapter, we worked on building a simple application that allows us to manage ToDo lists. It's time for us to implement request tracing inside this application. For the first example, we will work on implementing tracing of the requests inside our user service.
For the tracing to work, we will need to have a few requirements in place. If you followed the Technical requirements section of this book, you are in a good place to start working with the tutorial. But, before we dive into implementing the tracing, let's take a look at the following components that we will require:
- Jaeger all-in-one image: The Jaeger all-in-one image provides us with the Jaeger server, the agent, and a UI that will help us collect the tracing data that is being reported by the application, and will also allow us to visualize the same data
- Jaeger-client: The jaeger_client allows us to use Jaeger for the collection of the tracing data from the application
- Flask-opentracing: This module provides the functionality for implementing tracing and instrumentation in our application through the use of the OpenTracing standard
With the requirements, setup complete, it's time for us to implement the tracing inside our application. For this, fire up the user_service.py file inside the code editor of your choice and follow the proceeding steps:
- Importing the jaeger_client and flask_opentracing: Before we can implement the tracing inside our application, we first need to import the required libraries for helping us set up the tracing. The following snippet of code needs to be added to the start of the file to allow us to import the necessary libraries:
    from jaeger_client import Config
    from flask_opentracing import FlaskTracer
- Initialize the tracer: Once we have the required libraries imported into our service, it's time to initialize the tracer inside the application. The following code snippet defines a new method inside our application, which initializes the tracing of the application:
    def init_tracer():
        """Initialize tracing for the application.
        """
        config = Config(
            config = {
                'sampler': {'type': 'const', 'param': 1}
            },
            service_name='user_service')
        return config.initialize_tracer()

    # Setup Flask Tracer
    flask_tracer = FlaskTracer(init_tracer, True, app)
With the tracer implemented, we can now see a trace of the requests that come to our user service inside the Jaeger UI. To do this, let's make a simple POST request to the /auth/register endpoint of the service and see what shows up in the Jaeger UI running at http://localhost:16686.
Once this is done, we will see the following output on the Jaeger UI:
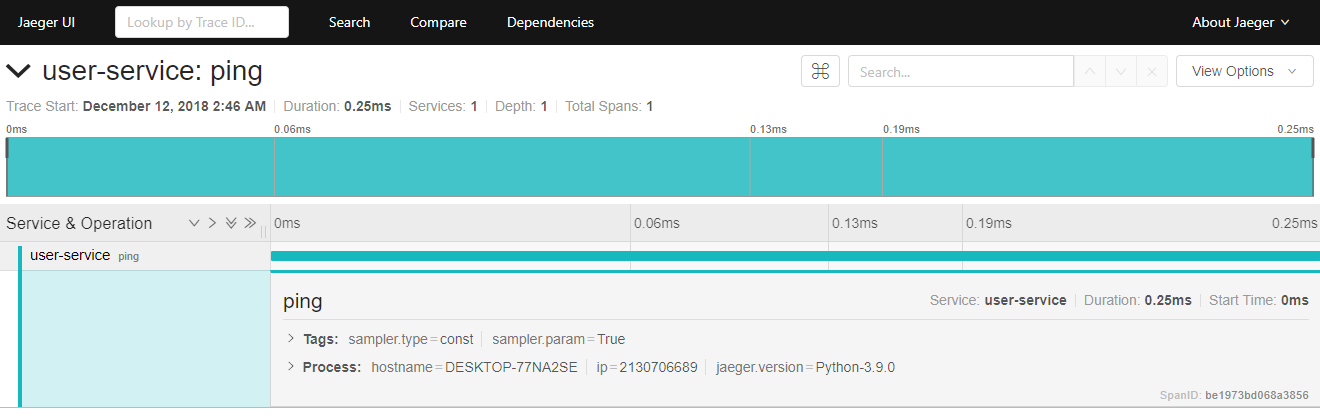
With this, we have successfully implemented the tracing inside the user service.
Now, with this done, we can move on to implementing tracing of the requests between the microservices. So, let's take a look at how we can do this.