
Inside the microservices world, the requests may travel from one service to another before a final response is generated. Even our simple example of a todo list management application shows this behavior, where the todo manager service frequently makes a request to the user service to implement user authentication, and to gather the details about the user, thus creating a new todo list.
The distributed tracing system aims to enable the tracing of the requests while they travel from one microservice to another.
To achieve this, the tracing systems utilize a number of mechanisms, the easiest of which is to embed a unique tracing key into the HTTP headers of every request that is being made. The tracing system is then able to differentiate and aggregate a particular request as it flows from one service to another by reading the request identifier that is present in the HTTP headers.
Now, it's time for us to see the distributed tracing in action. For this, we will make a few changes to enable tracing inside our todo manager service.
The following snippet of code showcases the changes required to enable distributed tracing inside the todo manager service:
from flask import Flask, request, jsonify
from flask_sqlalchemy import SQLAlchemy
from jaeger_client import Config
from flask_opentracing import FlaskTracer
from opentracing_instrumentation.client_hooks import install_all_patches
import datetime
import requests

app = Flask(__name__, instance_relative_config=True)
app.config.from_object('config')

def init_tracer():
    """Initialize the tracing system."""

    config = Config(
        config={ # usually read from some yaml config
            'enabled': True,
            'sampler': {
                'type': 'const',
                'param': 1,
            },
            'logging': True,
        },
        service_name='todo-service',
        validate=True,
    )
    return config.initialize_tracer()

install_all_patches()

flask_tracer = FlaskTracer(init_tracer, True, app)
With the preceding code in place inside the todo_service.py file, we have the distributed tracing enabled. But before we see this in action, there are a few things that we need to take a look at. In the preceding code snippet, we imported one extra method named install_all_patches() from the opentracing_instrumentation library which is shown as follows:
from opentracing_instrumentation.client_hooks import install_all_patches
This method is responsible for enabling the tracing of the actions that takes place inside the SQL library or through the python_requests library.
Once this library was imported along with the jaeger_client and flask_opentracing, we moved on to configure and enable the tracing for the application inside the init_tracer method.
Now, with the tracing configured, let's restart our application and then make a request to http://localhost:5001/list/new by passing the appropriate parameters to the API endpoint for creating a new todo list.
Once this action succeeds, we can navigate back to our Jaeger UI running at http://localhost:16686 to see that the Jaeger UI shows the trace for the API call we just made. The following screenshot shows a sample of how the screen may look:
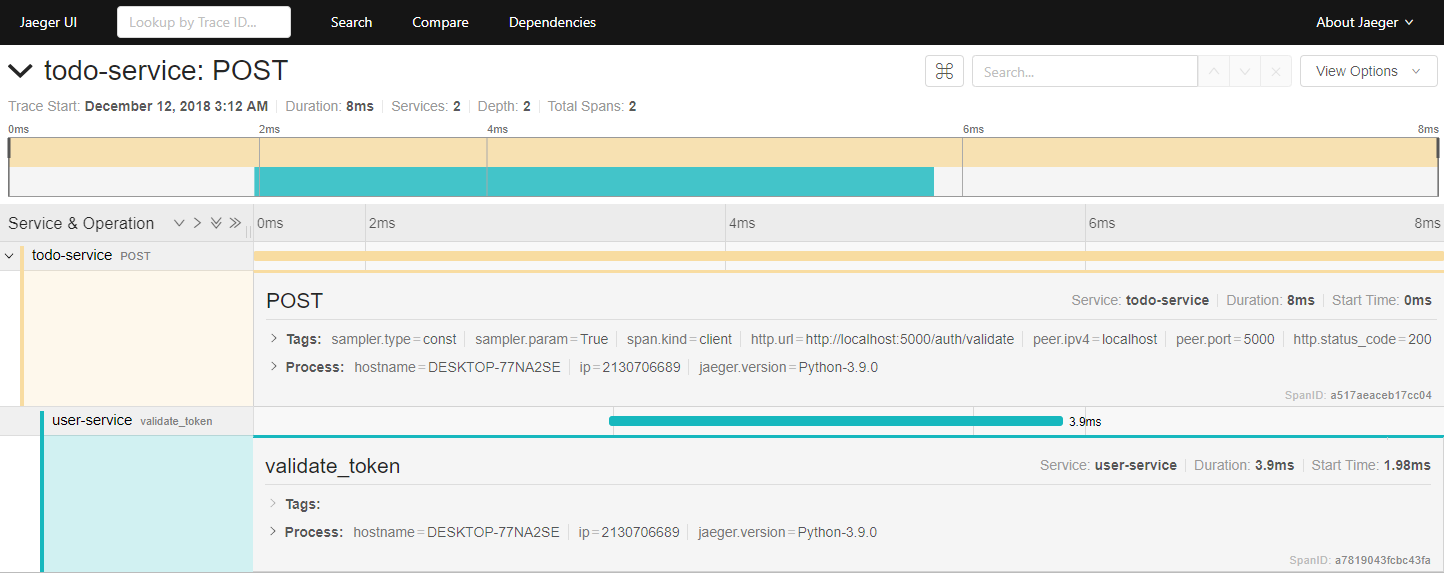
As we can see from the preceding screenshot, the Jaeger UI does not only show the request trace for the todo manager API service endpoint, but also goes further into displaying the endpoint that was called inside the user service, while providing the details of how much time was spent in each of the API endpoints before the response was generated back to the client application.
With this, we now have an idea of how the distributed tracing inside microservices looks. But what are the possible use cases that can see a benefit from having this kind of tracing in place? Let's find out.