
Chapter 2
Integration of distributed energy resources in distribution power systems
Alberto Borghetti
Carlo Alberto Nucci Department of Electrical, Electronic and Information Engineering, University of Bologna, Bologna, Italy
Abstract
The chapter deals with issues and countermeasures concerning the integration of distributed energy resources (DERs) in distribution power systems. The use of information and communication technologies (ICT) in the integration of DERs is illustrated by using the example of a multiagent system (MAS) approach for the Volt–VAR control (VVC) on the basis of the information provided by phasor measurement units. The analysis of the performances of the MAS approach is carried out by means of a specifically developed ICT-power cosimulation platform that accurately represents the transient phenomena in the power distribution system and the behavior of the communication network.
Keywords
distributed energy resources
distribution networks
multiagent system
phasor measurement unit
Volt–VAR control
2.1. Introduction
The motivation for achieving new solutions realizing appropriate interconnection of distributed energy resources (DERs) in distribution power systems can be justified by the observation of some modern distribution network configurations. Fig. 2.1 shows the geographic information system (GIS) view of the 15 kV distribution network of an Italian town (Imola) with a population of around 70,000 people with three substations each equipped with two or three 30 MVA transformers. The length of the total line is about 200 km. Each of the small circles represents one of the 700 active clients, that is, clients that own a generation setup. The total peak value of the power generation capability is 150 MW connected at a medium voltage (MV) level and 13 MW connected at a low voltage (LV) bus. Most of the generation is provided by photovoltaic (PV) units and it has been installed mainly in the last 10 years. This is a somewhat typical example of what is occurring in several places in the world.

Figure 2.1 GIS view of the medium voltage distribution network of Imola in red.
Gray (yellow in the web version) circles indicate clients with generation capability. (Source: Data courtesy of Hera Multiutility Company.)
Gray (yellow in the web version) circles indicate clients with generation capability. (Source: Data courtesy of Hera Multiutility Company.)
Indeed, as described in Refs. [1,2], the worldwide increase of electricity production from renewable energy sources (RESs) is coupled with the growing installation of distributed generation (DG) and DERs, also including storage systems. A large share of the RES plants (wind parks, micro wind turbines, large and small PV, and medium or small scale hydro power plant), as well as other types of DG, such as small industrial and micro combined heat and power plants, or combined cooling, heat, and power plants, are connected to MV and LV distribution networks.
High percentage levels of power production from volatile RESs, for example PV and wind power plants, with respect to the load may cause serious problems for the operation of the high voltage (HV) transmission network, such as bottlenecks, which require appropriate congestions management, load curtailment, increasing reserve margins and balancing capacity in pool markets, steep up/down power ramps to conventional plants, etc.
Today, several MV distribution networks have an installed capacity of DG greater than the total peak demand and, more often than in the past, we find some HV/MV distribution transformers that operate with a reverse power flow for a significant number of hours per year. For the transmission system operator, in the periods characterized by high production from RES, these distribution networks behave as large generators. For distribution system operators (DSOs) the operation of these networks may represent a difficult task due the following causes:
▪ The point of connection of DG in an MV feeder may be at some distance from the buses of significant consumption; or
▪ The production from nondispatchable DG is in general not synchronized with the demand.
Without the implementation of an adequate control of DG outputs, these two causes may severely reduce the expected DG benefits, such as the reduction of peak loads, of power loss and congestions, the avoidance of network overcapacity, and the deferral of network reinforcements.
Traditionally, distribution network are usually planned in order to properly operate in all the possible combinations of load and generation levels (the fit-and-forget approach). Since peak load may occur in moments of very low DG production and vice versa, the presence of DG may even increase capital expenditures of the DSO for network reinforcement, although it reduces the utilization rate of network assets.
Also, power losses tend to increase in distribution networks with a large penetration of DG, while they can be reduced in the transmission network.
The following section of this chapter reviews the most typical connection issues and countermeasures with some references to international standard. The third section addresses the role of the increased use of information and communication technologies (ICT) in the integration of DERs, and to this aim we describe the example of a multiagent system (MAS) approach for the Volt-VAR control (VVC) tested using an ICT power cosimulation platform specifically developed for the purpose.
2.2. Interconnection issues and countermeasures
In many countries, the legislation, for example Directive 2009/72/EC of the European Parliament, states that DSOs are obliged to enable the connection of both load and DG. DSOs may refuse access to the grid once they can prove the grid lacks the required network capacity.
In general, as described in Ref. [3] and in the references therein, the so-called hosting capacity of distribution systems is determined by the following:
▪ The minimum and maximum voltage limits with respect to the rated value;
▪ The maximum current allowed to circulate in the network branches in steady-state conditions; and
▪ The fault level, usually defined by the rating of existing switchgear in the vicinity of the point of connection.
Indeed DG tends to increase the bus voltages, may cause congestions in some overhead lines or cables, and could increase the maximum expected fault current value at the connection points, especially for the case of synchronous machines directly connected to the network.
Moreover, there are specific issues that need to be taken into account in the operation of distribution systems with DG. As described, for instance, in Ref. [4], DG may interfere with the operation of the automatic voltage regulator of on-load tap changers (OLTCs) installed in the HV/MV transformer. In particular, the adoption of the usual line drop compensation, which raises the reference voltage value at the MV terminal of the transformer in proportion to the load, appears unsuitable for distribution feeders with substantial presence of DG, which may experience also prolonged period of reverse power flow at the HV/MV transformer.
During the operation of the network, the presence of DERs may cause the formation of unintentional islanding situations after the operation of a protective device of the network, interference with the network protection settings, rapid voltage changes, and power quality issues, which are of particular interest as most DSOs should comply with IEEE Std. 519 or IEC 61000. Other than limits on harmonic distortion, DERs connected through inverters – mostly PV units – are required to avoid direct current (DC) injections caused, in general, by improper operation of the control system.
National and international standards define connection rules in order to limit the impact of DG on the operation of the power distribution system, taking into account the methods and equipment currently adopted in distribution network for voltage regulation and fault protection. Furthermore, as PV applications are becoming more and more important, specific codes and standards are continuously updated [5]. For instances, recent standards in Germany (VDE-AR-N 4105) and Italy (CEI 0-16 and CEI 0-21), include requirements not only for power curtailment, but also for voltage support and low-voltage ride through (LVRT) capability. Voltage support is achieved by reactive power injection strategies, while the LVRT function avoids the loss of massive power production by PV units due to deep voltage sags and should be coordinated with the anti-islanding function [6].
Since DSOs are subject to performance requirements for quality of service (QoS) defined by energy regulatory bodies, with particular reference to continuity of supply and power quality defined by specific standards (eg, European Std. EN 50160), their approach to the operation of the distribution networks changes with the increased installations of DERs. Networks with a low penetration of DG, are usually operated making use the so-called “fit and forget” approach, which aims to foresee and solve all the potential issues at the planning stage without control over the customers installations during the operation. On the other hand, when the DG penetration increases, DSOs tend to apply automatic procedures that solve the grid problems once they occur, in general by forced restriction of production or consumption curtailments. The next step is expected to be the so-called active approach of operation of distribution network, in which available ICTs are more widely used in order to better exploit the ancillary services and the real-time flexibilities which may be provided by both DERs and responsive loads.
Moreover, while phasor measurement unit (PMU) applications for transmission system operation and control could be considered mature [7], there is a growing interest to also develop PMU-based applications for distribution networks and PMUs are predicted to be more commonly installed in future distribution equipment (see eg, [8] and references therein).
In order to provide an example of the analysis of the effects of the characteristics of the communication network on the performances of an active approach in the operation of the MV distribution network, the remainder of this chapter focuses on VVC, defined as the online coordination of reactive power resources and transformers equipped with OLTCs, in order to achieve an efficient and feasible operating condition of the power feeder.
2.2.1. Volt–VAR control
The following three possible approaches may be identified in order to address the issue of coordinating the outputs of DERs with the action of available control means, such as transformers equipped with OLTCs, mechanical switched, shunt capacitors, and static VAR compensators (SVC):
▪ Local approach that consists of local regulators at each distributed generator and control mean that use only local measurements;
▪ Centralized approach that consists of active network management (ANM) functions implemented in the distribution management system (DMS) coupled with the supervisory control and data acquisition (SCADA) master hardware and software located at the control center;
▪ Distributed approach that consists of a networked MAS [9] composed of numerous localized controllers with the ability to communicate with each other.
Both the centralized ANM scheme, in which the SCADA system communicates with the remote terminal units, and the MAS approach are based on the exchange of information using communication networks that are now largely internet protocol (IP)-based. DSOs typically use shared communication networks that are characterized by more stringent limitations than the communication links adopted for the operation of high voltage transmission networks [10,11]. As analyzed in Ref. [12], the implementation of all ANM functions in a central DMS is expected to require significant reinforcements of the communication infrastructures currently adopted by DSOs. A reduction of the communication requirements can be obtained by using MAS approaches.
When implemented as an ANM function, VVC can be formalized as a single optimization problem (see eg, [13] and [14], which also review previous contributions on the subject). Generally, in VVC, real power outputs of DERs are assumed to be defined by the availability of the energy resources and by market conditions. However, several characteristics of VVC are in common with more general optimal power flow problems that may include also the optimization of active power production and demand side control on the basis of costs and required reserves (see, eg, [15–19] and the references therein).
A general review of the applications of MAS in power systems, not limited to distributed control purposes, has been the object of a specific IEEE Power and Energy Society Working Group [20]. Control theory aspects, specifically consensus and cooperation topics, have been recently reviewed in Ref. [21]. These approaches avoid the concentration of all the information and decisions in a specific node of the communication network connected to a centralized processor with demanding computational tasks. Specific techniques of control over communication network are needed in order to minimize the effects of finite bandwidth, transmission delays, and packet loss, as well as to limit the risk of cyber attacks. These constraints due to the use of a shared communication network are common to all networked control systems approaches, as recently reviewed in [22] and [23].
Various MAS approaches have been proposed in the literature to solve the problem of VVC. A decomposition method of the inverse of the Jacobian of the power flow problem was proposed in Ref. [24] in order to decompose VVC in smaller size optimization problems that could be implemented in a MAS. There is also an increasing literature relevant to the application of distributed optimization procedures to VVC, with particular reference to power networks with radial structure [25–28].
In some MAS schemes, special coordinating roles are assigned to specific agents. For example, in the scheme proposed in Ref. [29] a moderator collects all the sensitivity factors from the agents and sends backward the contracts to them stating that the amount of reactive power support is needed from each controlled DG. In Ref. [30], a similar coordinating role is attributed to a top feeder relay which has the additional role to provide the coordination with the central energy management system of the bulk transmission network. In other approaches, the sequence of agent actions should follow a specific order, based, as in Ref. [31], on the location of the controlled DG in the feeder. Moreover, leaderless MAS approaches have been recently proposed in Refs. [32] and [33]. These approaches are based on gossip-like algorithms that use the measurement of bus voltage synchrophasors and on the exchange of the information between two randomly chosen neighboring agents at a time. A related strategy has been presented in Ref. [34]. In Ref. [35] an algorithm is proposed in which each agent sets a target voltage value on the basis of the voltage measurements collected from all the neighbors. The action of each agent is cyclically activated by a token ring control strategy so to ensure that the output of only one DG or of few DGs at a time are adjusted depending on the number of circulating tokens. In Ref. [36] the solution of a fuzzy-based algorithm is achieved by means of an average consensus procedure between agent state vectors. The results show that a large number of iterations and therefore a large number of exchanged messages are needed to achieve a consensus on the mean value of the bus voltages that is used by the fuzzy algorithm.
2.2.2. Gossip-like VVC MAS procedure
We focus here on a leaderless asynchronous gossip like approach given by subsequent repetition of the execution of simple rules between different couple of agents. The procedure, based on the one proposed in Ref. [32–34], is enriched by several countermeasures against communication latency and packet loss and it also incorporates additional heuristic rules that improve the coordination with OLTCs [37].
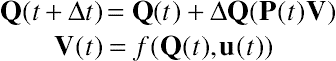
Consensus algorithms in MAS can be described as a number of rules that periodically update the column vector of the agent states x(t + ∆t) at time step t + ∆t by an exchange of information between the agents relevant to their present state:
Element Pij of matrix P represents the influence of the present state of agent j on the future state of agent i at each time step. Therefore, matrix P incorporates the available communication links between different agents.
In the described VVC application, the state of agent i represents reactive power, Qi, injected in a bus of the feeder by the reactive power compensator controlled by agent i (eg, a DER interfaced with the grid through a power electronic converter). As the objective of VVC is the achievement of a feasible and efficient operating condition, the updated value of the reactive power depends on the state of the electrical network represented by the vector of bus voltage phasors V. Therefore, the consensus mechanism may be described by
 (2.2)
(2.2)where ∆Qi is the adjustment function of reactive power output of the compensator associated with agent i. It is a nonlinear function of the voltage phasors that is communicated to agent i by the available communication links represented by the nonzero elements of matrix P(t). Nonlinear function, f, represents the nonlinear relationship between the bus voltage phasors and the reactive power output of the compensators. It incorporates the power network equations, the voltage dependence of loads and generators as well as the effects of disturbances (switching, sudden change of load and generation, etc.) indicated by vector u(t).
We assume that N reactive power compensators are connected to different buses of the power distribution feeder with the capability to inject a controllable value of reactive power between the minimum limit, Qmin, and maximum limit, Qmax. The reactive power injection level is adjusted by an agent of the MAS connected to a node of the communication network. Each agent is equipped with a bus voltage sensor that incorporates the PMU function and with a memory buffer where it cyclically stores both the measured phasors and the corresponding measurement times for a predefined time interval equal to twait.
The algorithm corresponds to the repeated execution of the following steps (indicated as a compensation cycle).
Measurement, information exchange, and calculation of ∆Q:
1. An agent, which we denote as agent h, is assumed to be activated by another agent that also provides its updated priority index ph as explained in the last steps.
2. Agent h randomly chooses a neighboring agent in the communication network, identified as agent k (by avoiding the agent that has activated him, if there is another one available).
3. Agent h sends to agent k the most updated values (present in the memory buffer) of both  and θh of the positive sequence voltage phasor of the bus to which its compensator is connected and the indication of corresponding measurement time tmeas. Moreover it sends the identifier of bus h, the value ph equal to its priority index, and the values of the margins between the current reactive output Qh of its compensator and the relevant minimum and maximum limits, that is,
 and
and  .
.
4. When agent k receives the information from agent h, it accepts the assignment only if ph is not lower than its priority index, otherwise it denies the assignment by sending the relevant message to agent h that concludes the compensation process with priority ph.
5. If agent k accepts the assignment, if necessary, it updates its priority index and singles out the bus voltage phasor Vk measured at tmeas stored in his memory buffer. It calculates the values  and
and  that represent the reactive power transfer from the nodes of the networks in which agent h and agent k are connected
 (2.3)
(2.3)
 (2.4)
(2.4)where ,  are the root mean square (RMS) values and θh, θk are the phases of the positive-sequence voltage synchrophasors Vh and Vk, respectively. Each agent is assumed to know the values of the effective impedances
  between the bus where its compensator is connected and the buses where the compensators of the neighboring agents are connected. In Ref. [32–34] it is shown that a sequence of repeated compensations of the mean value of (2.3) and (2.4) is globally convergent to the minimum network loss operating condition under some simplifying assumptions.
Moreover, analogous to agent h, it calculates reactive power margins  and
and  relevant to its compensator connected to bus k.
6. In order to define adjustment ∆Q of the compensator set point, agent k compares the value  with the maximum allowed variations of the reactive output of both compensators, that is, , and
  ,
, :
:
If and have different signs, then ∆Q is set equal to 0.
Implementation of ∆Q:
7. Agent k changes the output of its compensator by adding ∆Q only if at least one of the following two conditions is met:
 (2.6)
(2.6)where Vmax and Vmin are two values a few percent higher and lower than bus voltage rated value, respectively, so to define the voltage interval of the normal operating state. In the simulations, Vmax and Vmin are chosen equal to 1.03 and 0.97, respectively. If none of (2.6) is met, the reactive power output is not changed.
8. Agent k sends back value ∆Q to agent h.
9. If agent h does not receive the message from agent k before delay twait after tmeas, it randomly selects another agent k (step 2). Priority index ph remains unchanged.
10. If agent h receives the message from agent k, it changes the reactive output reference of its compensator by subtracting ∆Q only if at least one of the following two conditions is met:
 (2.7)
(2.7)Selection of the new couple of agents
11. Agent h randomly choses another agent to be activated as new agent h.
12. When the chosen agent receives the relevant message from agent h with the priority ph, it checks whether ph is greater or lower than its priority index. If it is equal or greater, the receiving agent becomes the new agent h. If necessary, it updates its priority index to ph and sends the relevant acknowledgment message back to the old agent h, which then returns in the idle state. If ph is lower than the priority index of the receiving agent, it denies the assignment by sending the relevant message to agent h that concludes the compensation process with priority ph.
13. The new agent h starts again the procedure from step 1, waiting at least twait after tmeas so to allow the stabilization of both compensators in the new operating conditions.
14. If the old agent h does not receive the acknowledgment message from the new one by twait after tmeas, it increments its priority index ph and randomly selects another agent to be activated (step 11).
Conditions (2.6) and (2.7) exploit the fact that the connection to the transmission network through the substation transformer guarantees the reactive power balance in the feeder.
In order to guarantee the persistence of the procedure also in the presence of packet losses, the algorithm includes the possibility of concurrent multiple var compensation processes. In order to limit the possible negative effects of unwanted and unsynchronized multiple compensation process, the association of an increasing priority index (ph) to each process is established. Concurrent compensation processes with priority indexes lower than the others are progressively stopped by the controllers. As a countermeasure against the complete failure of a critical communication links, a spontaneous activation is allowed after a predefined long time (eg, several minutes) in which a controller is never activated.
The countermeasure against communication latency is based on the availability of a memory buffer at each agent. The memory buffer stores the PMU–provided phasor data with the relevant time tag. This memory allows each couple of agents to estimate the reactive power flow by using synchronous values of voltage phasors. Another countermeasure against excessive communication latency is provided by the definition of a maximum delay twait after which the procedure carries on with the choice of a new active agent.
2.3. Role of ICT in the integration of distributed energy resources
In this section, an ICT power system cosimulation platform is used to assess the performances of the algorithm described in section 2.2.2 with a focus on the limitations due to the communication network, reproduced by means of a realistic model.
Cosimulation environments that integrate a simulator of the communication network with a power system simulator are very useful for the design and analysis of improved monitoring, control, and protection techniques in modern electric power systems, in particular when these functions rely on the exchange of information using a shared communication network.
In the literature, several approaches have been presented in order to develop ICT power system cosimulation platforms, as recently reviewed in Ref. [10,38]. The latter paper also presents an event-driven cosimulation environment implemented in Matlab/Simulink. Moreover, a review of cyber-physical system approaches in design and operation of power grids is available in Ref. [39].
One of the first platforms is the EPOCHS framework [40] that federates three off-the-shelf simulators: PSCAD/EMTDC for power system transients, Positive Sequence Load Flow for power system modeling, and Network Simulator 2 (ns-2) for communication network modeling. The same types of simulators are also included in the Global Event-driven CO-simulation (GECO) platform presented in Ref. [41] that uses a global event-driven mechanism in order to improve the synchronization. In Ref. [42] a cosimulation platform that integrates ns-2 with the utility power distribution system simulator OpenDss is used to analyze a compensation scheme of PV arrays outputs by means of distributed storage units controlled through a wireless communication network. An OpenDss/ns-2 integrated tool is used also in Ref. [43] to evaluate the impact of WiMAX communication system characteristics (with particular reference to rain fade) on DMS advanced functions. In Ref. [44] various cosimulation architectures are described and applied to the analysis of a DC power distribution system in a ship-board application. One of these architectures, based on the link between Opnet Modeler and the dynamic model of power electronic devices developed by using the Virtual Test Bed software environment, is described in detail in Ref. [45]. In Ref. [46] a hybrid simulation design based on high level architecture, IEC 61850, Object Linking and Embedding for Process Control and the Common Information Model is proposed with a focus on the evaluation of the real-time performance of wide-area monitoring, protection and control applications. In Ref. [47] a cosimulation tool based on the interface between the eMEGAsim real-time digital simulator and Opnet Modeler is proposed for the development of PMUs applications. In Ref. [48] a cosimulation environment built using OMNeT + + and OpenDSS is presented and in Ref. [49] this was used to test an integrated vehicle-to-grid, grid-to-vehicle, and RESs coordination algorithm. Examples of more general cosimulation tools for cyber-physical systems applied to power networks are the ADEVS/ns-2 integrated tool presented in Ref. [50] and the Modelica/ns-2 integrated tool presented in Refs. [51,52].
The developed platform is based on the interface between the communication simulator Riverbed Modeler (previously known as Opnet) and the electromagnetic transient program EMTP-rv, as described in Refs. [53,54]. As shown in Fig. 2.2, both the Riverbed Modeler and the EMTP-rv communicate with the outside environment through dynamic link libraries (DLLs) specifically developed for this cosimulation platform. The DLLs communicate with each other through socket application programming interfaces (APIs). The socket API allows the developed DLL to control and use the network sockets that are the endpoints of the interprocess communication flow.

Figure 2.2 Architecture of the cosimulation platform.
In the socket communication, the Riverbed Modeler controller works as a server (execution controller), while the EMTP-rv controller acts as a client. At the simulation start-up, Riverbed enables the communication in the execution controller, opens a socket channel, sets the parameters, and starts to listening/waiting for a possible connection from the external environment. The cosimulation begins when the EMTP-rv sends the connection request as a client to the specific port and IP address provided by the server.
The synchronization mechanism between the two simulators is based on the typical waiting order of a communication through sockets. Simulation interval ∆t is defined by the integration time-step adopted in EMTP-rv to solve the system of differential algebraic equations (for this paper ∆t = 1 ms). Time step ∆t is communicated to Riverbed Modeler that, in turn, executes the simulation until the subsequent sampling time t + ∆t. As ∆t is very small with respect to the analyzed transients, it is negligible the inaccuracy due the time shift of all Riverbed events that happen within a ∆t interval to the end of the same interval.
2.3.1. Models of the communication networks
A client–server communication model has been implemented for the interface between each agent that regulates a reactive power compensator in the EMTP-rv model and the relevant node of the communication network in the Riverbed model.
As described in Refs. [55,56], the interface through DLLs is defined by five main components: external system (Esys) module and the corresponding process model, external system definition/domain (ESD) model, simulation description (SD) file; Esys API package, and the external simulation access (ESA) API package. The Riverbed node models are extended by an Esys module that enables the management and the delivery of the communication packets between the agents. ESD model is an attribute of the Esys module that defines an Esys interface for each agent. The Esys module uses the information contained in the SD file for the link to the DLL that includes the specific C/C++ functions defined by the Esys API Package for the initialization and the flow control of each interface. The main header of the Esys API package is the ESA API package that contains the initialization of the sockets for the communication with EMTP-rv.
A message generated by the EMTP-rv model of the agents, implemented by using a specific DLL, is first transferred to the socket communication and then to the relevant Esys interface of the client in the Riverbed agent model. The message is built into the datagram and sent to the server of the destination agent through the communication network. The destination server processes the received datagram, extrapolates the information from the payload, and returns the message to the associated EMTP-rv interface.
The simulator implements both the model of a wired communication network and the model of a cellular network.
2.3.1.1. Wired communication network model
As shown in Fig. 2.3, both transmission control protocol (TCP) and user datagram protocol (UDP) are represented using Riverbed models. The TCP model establishes a connection–oriented point-to-point communication link and includes connection set-up, data exchange, acknowledgment, retransmission, and connection termination functionalities. In the UDP model, the communication is connectionless, that is, a message is sent from one end-point to another without prior arrangement or control.

Figure 2.3 (a) TCP and (b) UDP node models. hub_rx and hub_tx, physical layer; MAC (media access control) and arp (address resolution protocol), link layer; IP and ip_encap (which encapsulates packets into IP datagrams), internet layer; tcp or udp and transport_interface, transport layer.
In our application, the dimension of TCP packets is 408 bits for data exchange and 376 bits for set-up, acknowledgment and connection termination. The dimension of UDP packets is 312 bits.
In the Riverbed model, each agent node is connected to a router and to a background data traffic generator. The routers are connected to each other by a communication network with 64 kilobits per second (kbps) serial twisted-pair links and characterized by topology that follows the same tree configuration of the power distribution feeder. Each agent node is connected to the own router via a 10BaseT Ethernet link.
The background traffic (BT) in the communication links is represented by an IP layer traffic flow from each node towards the router located at the substation. Each communication link is also characterized by a packet discard ratio (PDR), representing the probability of a packet to be lost in the link.
2.3.1.2. Cellular communication network model
As described in [57], the simulator includes the model of a third generation mobile cellular network, namely a Universal Mobile Telecommunications System (UMTS). The Riverbed model represents the three basic components of the UMTS network: the user equipment (UE), that is, the UMTS module of each agent, the UMTS terrestrial radio access network (UTRAN), and the Core Network (CN). UTRAN includes the Node B and the radio network controller (RNC), which manages the Node B logical resources and also the UE-Node B interface resources. Each Node B controls the radio transmission and reception of a cell and performs the packet relay between UE and the corresponding RNC. CN contains the serving GPRS support node (SGSN) and the gateway GPRS support node (GGSN). SGSN maintains access controls, security functions and also keeps track of UE locations. The GGSN encapsulates the packets and routes them to the SGSN that are received from the external network or internet.
Fig. 2.4 shows the Riverbed model of the UMTS UE. The GMM module (GPRS mobility/session management) manages GPRS attachment, PDP context establishment, service requests, and radio access bearer activation and it handles the interface with the IP stack. The radio link control (RLC)_media access control (MAC) module performs RLC and MAC functionalities, both in UEs and router control planes. As described previously, the node model is extended by an Esys module that enables the Riverbed interface with the EMTP simulation environment.

Figure 2.4 UDP node model of UMTS UE.
AICH, acquisition indicator channel; CPCH, common packet channel; DCH, dedicated channel; DSCH, downlink shared channel; RACH/FACH, random access channel/forward access channel.
AICH, acquisition indicator channel; CPCH, common packet channel; DCH, dedicated channel; DSCH, downlink shared channel; RACH/FACH, random access channel/forward access channel.
The air interface between each UE and the Node B is based on the wideband code division multiple access access scheme and uses a direct spread with a chip rate of 3.84 MHz and nominal bandwidth of 5 MHz. The model supports frequency division duplexing duplex mode. The radio frame has a length of 10 ms and it is divided into 15 slots. Spreading factors vary from 256 to 4 for uplink and from 512 to 4 for downlink, which allow data rates of up to 2 Mbps. The model accounts for the block error rate (BLER) that is the percentage of transport blocks with errors over the total number of transport blocks. The communication channels between each Node B and RNC (and CN) are assumed wired with large data rate.
The Riverbed model supports the UMTS four main types of QoS: background, interactive, streaming and conversational. These attributes include the traffic class, maximum and guaranteed bit rates, delivery order, transfer delay, maximum size of the service data unit (SDU) and SDU error ratio. The UE RLC interface could operate in either unacknowledged mode or acknowledged mode (AM). Retransmission decreases the effects of the BLER but increases the communication delay.
In the simulations, the gossip-like procedure uses the interactive QoS class communication that has higher priority than background QoS although, as background, it does not guarantee a bit rate. We have chosen to operate in AM. The uplink and downlink dedicated signaling channels scheduling is adopted with the maximum bit rate of 64 kbps (as a default value for the interactive QoS traffic class).
In order to test the robustness of the gossip-like procedure with respect to delays generated in the communication network, some simulations includes BT, due to the presence of additional UEs other than those associated with the agents. These new UEs and also the agents, generate the BT by using some default mobile user traffic profiles defined by Riverbed Modeler according to the 3rd Generation Partnership Project (3GPP) technical report TR 36.822. Also the mobile user traffic has been represented by using the interactive QoS.
2.3.2. Model of the power distribution feeder
The EMTP-rv model of the network is mainly composed by the three-phase constant-parameters PI models for the representation of the unbalanced lines, a three-phase transformer model at the substation fed by a positive sequence constant voltage generator, the models of reactive power compensator loads, and OLTC transformers.
The OLTC model is adapted from Ref. [58]. The OLTC regulator changes the tap when the RMS value of voltage at the secondary side differs from the reference value more than a predefined dead band for at least 0.5 s. The first tap change of each control action is postponed by a fixed delay, while subsequent changes are applied after a maximum delay time, fixed or with an inverse law. In order to avoid unnecessary operations and wear of the OLTCs of a series of cascaded transformers, the upstream transformer sends a message to downstream transformers in order to delay their actions if those actions are of the same type of the one that the upstream transformer is applying [59]. Once the upstream transformer terminates its action, after twait it sends another message to downstream transformers in order to release their actions.
The compensators are represented by components able to inject assigned and adjustable three-phase active and reactive powers. A first approximation of the quasi steady-state behavior of both synchronous generators and power electronic interfaced sources connected to an unbalanced network is provided by a three positive-sequence current sources in parallel with a 3 × 3 Y matrix, as described in, for example, Refs. [60,61]. The DG model implemented in EMTP-rv is composed by two positive-sequence triplets of current generators. The amplitude of one triplet is controlled by a feedback regulator in order to inject the requested value of three-phase active power, while the phase angle between current and bus voltage is regulated so to achieve a zero value of reactive power. The regulators of the second triplets have a reverse function, that is, amplitude is controlled in order to inject the requested reactive power and phase angle is controlled in order to cancel out active injection. Reference value, Qi, of the reactive power injection of compensator, i, is dynamically changed by the associated agent taking into account the Qmax and Qmin limits. For the case of inverters, the values of Qmax,i and Qmin,i are dynamically updated on the basis of the active power value Pi, so that maximum inverter current Imax,i is met:
 (2.8)
(2.8)A smooth transition between different power levels in a short time window of few hundreds of milliseconds is represented.
Moreover, each compensator i is equipped with a fast local regulator that adjusts Qi, which is defined by the corresponding agent that participate to the gossip-like procedure, by a quantity  if
if  significantly differs from the rated value. Qi is decreased if
  and it is increased if
  :
:
 (2.9)
(2.9)where V'max and V'min are two values slightly lower and higher than Vmax and Vmin, respectively, used in (2.6) and (2.7), while ∆Vmax and ∆Vmin indicate the voltage deviations with respect to Vmax and Vmin, respectively, that cause a complete utilization of the available reactive power margins.
As EMTP-rv converts all the load models in RLC branches in time domain simulations, constant PQ and constant current three-phase unbalanced load models are represented by adopting the same two-triplets current generators structure used for the compensators, with the difference that a per-phase control of active and reactive power (negative) injections has been implemented.
The agent of each compensator also includes the model of a PMU that provides 10 estimates per second. The accuracy of PMUs is represented by the Normal distribution of the measurement errors of the PMU prototype described in Ref. [62], which addresses the issue of small phase shifts between different buses in MV distribution networks due to short line lengths and reduced power flows. In the simulations, the corresponding mean and standard deviation values are assumed equal to 10 μrad and 8.1 μrad for phase error and 120 × 10−6 pu and 9.3 × 10⁻⁶ pu for RMS error, respectively. The accuracy associated with a capacitive voltage divider is also included by means of a normal distribution with mean and standard deviation equal to −0.6 mrad and 7 μrad for the phase error and 2 × 10⁻³ and 58 × 10−6 pu for RMS error, respectively.
2.3.3. Test results
Numerical tests have been carried out for the two following test feeders (TFs) adapted from Ref. [63] with six additional three-phase reactive power compensators, indicated by Q1 – Q6:
| TF1: | IEEE 37 node test feeder, with six reactive power compensators connected to buses 702, 712, 706, 703, 708, and 711, respectively, and with an OLTC transformer at the substation (the secondary side node is 701 indicated with a blue dot). The scheme with the wired communication network is shown in Fig. 2.5a) and the scheme with the UMTS communication network is shown in Fig. 2.5b), in which two Node Bs are needed to guarantee the coverage (the corresponding two cells include the UEs at nodes 701, 702, 712, and 706,703,708,711, respectively). |
| TF2: | IEEE 123 node test feeder, with six reactive power compensators connected to buses 13, 28, 47, 67, 87, and 108, respectively (Fig. 2.6) and with two OLTC transformers (with the secondary side connected to nodes 149 and 67, respectively). |
The characteristics of unbalanced lines and loads have been defined as in Ref. [63]. In order to speed up the simulations, the constant power and constant current load models described in Section 2.3.2 have been applied only to the loads larger than 100 kW in TF1 and to the loads larger or equal than 40 kW in TF2, while the other loads are represented as constant impedances.

Figure 2.5 TF1.
Power feeder in black and communication network in light gray (red in the web version): (a) wired communication, (b) cellular communication [solid light gray (red in the web version) lines represent wired channels, dotted light gray (red in the web version) lines represent UMTS channels]. Gray (red in the web version) dots indicate the agents associated to compensators while blue dots indicate an agent that does not directly adjust the output of any compensator. In subpart (b) the dark gray (green in the web version) circles indicate the estimated coverage areas of the Node B antennas.
Power feeder in black and communication network in light gray (red in the web version): (a) wired communication, (b) cellular communication [solid light gray (red in the web version) lines represent wired channels, dotted light gray (red in the web version) lines represent UMTS channels]. Gray (red in the web version) dots indicate the agents associated to compensators while blue dots indicate an agent that does not directly adjust the output of any compensator. In subpart (b) the dark gray (green in the web version) circles indicate the estimated coverage areas of the Node B antennas.
Substation transformers are equipped with OLTC with ±8 tap increments of 1.875%. The tap mechanical delay is 2 s, the time to first tap change is 20 s and the maximum delay time of the subsequent tap changes is 15 s with an inverse time law. An agent is associated to the bus at the secondary side of the substation transformer. It participates to the regulation cycles of the VVC procedure but it does not directly adjust the output of any compensator.

Figure 2.6 TF2.
Power feeder in black and communication network in gray (red in the web version): (a) wired communication, (b) cellular communication [solid gray (red in the web version) lines represent wired channels, dotted gray (red in the web version) lines represent UMTS channels].
Power feeder in black and communication network in gray (red in the web version): (a) wired communication, (b) cellular communication [solid gray (red in the web version) lines represent wired channels, dotted gray (red in the web version) lines represent UMTS channels].
In TF2, the voltage regulator located between bus 160 and 67 has an OLTC with ±16 tap increments of 0.625%. The time to first change and the maximum time of subsequent changes inverse-law delay of are both 10 s and the mechanical delay is 2 s. The reactive power compensator connected to bus 67 participates to the MAS procedure only when the OLTC between bus 160 and 67 is not operating. When the OLTC is in operation, the agent set is divided into two independent groups: one relevant to the agents associated to nodes {149,13,28,47} and the other including the agents associated to nodes {67,87,108}. At each compensation cycle, both agent h and agent k must belong to the same group.
2.3.3.1. Results obtained with the wired communication network
As shown by Fig. 2.5a and Fig. 2.6a, the wired communication network has eight nodes with a tree topology that follows the same configuration of the power feeder: node 0 is located at the feeder substation for both TF1 and TF2. For the case of TF1, nodes 1, 2, 3, 4, 5, and 7 connect the agents associated with the reactive power compensators and node 6 is located in the path between node 5 and node 7. For the case of TF2, nodes 1, 2, 3, 4, 5, and 6 connect the agents associated with the reactive power compensators and node 7 is located in the path between nodes 1, 2, and 3.
In the simulation relevant to the wired communication network, three different BT levels are analyzed, identified as BT0, BT1, and BT2, which correspond to 0, 4.75, and 9.5 kbps, respectively, that each BT generator sends towards node 0. Each BT level is analyzed both without PDR (case identified as PDR0) and by assuming a 5% PDR (case identified as PDR5) for each communication link. For BT levels 0 and 1 we assume twait =1 s. For BT level 2, we have compared the results obtained for two twait values, namely a) twait =1 s (BT2a) and b) twait =10 s (BT2b). For the simulations with twait = 1 s, the final time is tf = 80 s, while when twait = 10 s, tf is extended to 100 s. In order to compare the promptness of the procedure in the various scenarios characterized by different BT levels, we define settling time, tset, as the time to enter and remain within a 500 W band for at least 30 s.
As a base case, limits for Qmax and Qmin are set equal to 500 and −500 var, respectively, for all the compensators. The active power injected by the compensators is null and initially the reactive power output is also null
For the case of TF1, Tables 2.1 and 2.2 compare the results obtained for the seven scenarios characterized by different values of BT and PDR by using TCP and UDP. Tables 2.3 and 2.4 compare the results for the same scenarios obtained for the case of TF2. These results are obtained with all OLTCs blocked in tap position 0 and the local voltage regulators not active.
Table 2.1
Mean and Standard Deviation Values of the Number of Compensation Cycles, Percentage of Incomplete Compensations, Power Loss Decrease, and Settling Time for TF1
| BT PDR Level | No. of Compensation Cycles, Mean (Stdev) | % of Incomplete Compensations, Mean (Stdev) | Power Loss Decrease (kW), Mean (Stdev) | Settling Time (s), Mean (Stdev) | ||||
| TCP | UDP | TCP | UDP | TCP | UDP | TCP | UDP | |
| BT0 PDR0 | 70.5 (0.5) | 75.8 (0.4) | 0 (0) | 0 (0) | 13.4 (0.1) | 13.5 (0.1) | 26.0 (13.0) | 28.3 (10.9) |
| BT1 PDR0 | 68.2 (0.5) | 74.5 (0.5) | 0 (0) | 0 (0) | 13.4 (0.2) | 13.5 (0.1) | 26.0 (10.6) | 23.1 (13.5) |
| BT2a PDR0 | 59.2 (1.9) | 63.4 (1.9) | 0 (0) | 0 (0) | 8.2 (3.1) | 7.9 (3.0) | 32.8 (19.3) | 31.6 (23.5) |
| BT2b PDR0 | 9.5 (0.6) | 10.0 (0.1) | 0 (0) | 0 (0) | 10.6 (2.5) | 11.5 (1.4) | – | – |
| BT0 PDR5 | 30.6 (11.8) | 67.9 (5.3) | 32.3 (11.5) | 6.1 (2.7) | 12.1 (1.9) | 13.0 (2.1) | 33.5 (21.9) | 28.1 (12.9) |
| BT2a PDR5 | 35.4 (5.1) | 58.3 (3.8) | 29.0 (10.3) | 7.3 (3.8) | 10.9 (3.3) | 10.7 (3.1) | 33.3 (15.3) | 33.8 (19.3) |
| BT2b PDR5 | 7.4 (1.3) | 9.2 (1.6) | 11.8 (14.8) | 5.0 (6.4) | 9.8 (2.4) | 10.7 (2.8) | – | – |

Table 2.2
Mean and Standard Deviation Values of the Number of Packets, Percentage of Ignored and Lost Packets, Packet Delay and Number of Stopped Processes for TF1
| BT (PDR) Level | No. of Packets, Mean (Stdev) | % of Packets Ignored or Lost, Mean (Stdev) | % of Packet Lost, Mean (Stdev) | Packet Delay (ms), Mean (Stdev) | No. of Stopped Processes, Mean (Stdev) | ||||
| TCP | UDP | TCP | UDP | UDP | TCP | UDP | TCP | UDP | |
| BT0 PDR0 | 282.0 (1.9) | 303.2 (1.5) | 0 (0) | 0 (0) | 0 (0) | 49 (14) | 11 (3) | 0 (0) | 0 (0) |
| BT1 PDR0 | 272.7 (1.7) | 297.9 (1.9) | 0 (0) | 0 (0) | 0 (0) | 66 (33) | 18 (16) | 0 (0) | 0 (0) |
| BT2a PDR0 | 245.9 (4.9) | 264.4 (5.6) | 4.2 (1.2) | 4.2 (0.8) | 0 (0) | 76 (39) | 22 (21) | 0 (0) | 0 (0) |
| BT2b PDR0 | 37.8 (2.5) | 39.9 (0.5) | 0 (0) | 0 (0) | 0 (0) | 462 (918) | 194 (523) | 0 (0) | 0 (0) |
| BT0 PDR5 | 188.6 (15.1) | 276.1 (18.8) | 47.2 (18.6) | 5.7 (1.5) | 5.7 (1.5) | 52 (36) | 12 (3) | 2.6 (1.5) | 1.8 (1.3) |
| BT2a PDR5 | 186.8 (7.3) | 247.9 (10.6) | 34.4 (6.6) | 9.8 (1.5) | 6.3 (1.4) | 93 (88) | 24 (33) | 4.3 (1.8) | 1.7 (1.3) |
| BT2b PDR5 | 30.7 (4.2) | 37.7 (6.1) | 11.2 (11.0) | 4.5 (4.1) | 4.5 (4.1) | 890 (1509) | 241 (561) | 0.3 (0.6) | 0.3 (0.6) |

Table 2.3
Mean and Standard Deviation Values of the Number of Compensation Cycles, Percentage of Incomplete Compensations, Power Loss Decrease, and Settling Time for TF2
| BT (PDR) Level | No of Compensations Cycles, Mean (Stdev) | % No. of Incomplete Compensations, Mean (Stdev) | Power Loss Decrease (kW), Mean (Stdev) | Settling Time (s), Mean (Stdev) | ||||
| TCP | UDP | TCP | UDP | TCP | UDP | TCP | UDP | |
| BT0 PDR0 | 70.7 (0.7) | 77 (0.0) | 0 (0) | 0 (0) | 11.4 (0.2) | 11.4 (0.1) | 24.7 (13.5) | 21.0 (11.6) |
| BT1 PDR0 | 68.1 (0.8) | 75.9 (0.4) | 0 (0) | 0 (0) | 11.4 (0.2) | 11.4 (0.2) | 26.2 (12.6) | 18.9 (12.9) |
| BT2a PDR0 | 59.1 (2.3) | 65.5 (1.8) | 0 (0) | 0 (0) | 8.9 (2.8) | 8.9 (2.3) | 30.3 (16.0) | 34.8 (21.2) |
| BT2b PDR0 | 9.3 (0.7) | 10.0 (0.2) | 0 (0) | 0 (0) | 9.9 (2.2) | 10.6 (1.4) | – | – |
| BT0 PDR5 | 32.6 (10.0) | 65.7 (6.3) | 34.8 (11.0) | 7.2 (3.7) | 10.8 (1.3) | 11.3 (0.5) | 31.7 (18.5) | 26.4 (15.6) |
| BT2a PDR5 | 32.8 (5.1) | 56.0 (10.4) | 28.1 (8.3) | 8.1 (4.1) | 9.3 (2.2) | 9.9 (2.0) | 34.6 (20.0) | 39.2 |
| BT2b PDR5 | 7.3 (1.9) | 8.6 (1.0) | 11.4 (11.4) | 5.1 (7.9) | 8.1 (2.6) | 9.3 (2.6) | – | – |

Table 2.4
Mean and Standard Deviation Values of the Number of Packets, Percentage of Ignored and Lost Packets, Packet Delay, and Number of Stopped Processes for TF2
| BT (PDR) Level | No. of Packets, Mean (Stdev) | % of Packets Ignored or Lost, Mean (Stdev) | % of Packet Lost, Mean (Stdev) | Packet Delay (ms), Mean (Stdev) | No. of Stopped Processes, Mean (Stdev) | ||||
| TCP | UDP | TCP | UDP | UDP | TCP | UDP | TCP | UDP | |
| BT0 PDR0 | 282.5 (2.5) | 308.0 (0.1) | 0 (0) | 0 (0) | 0 (0) | 61 (19) | 15 (5) | 0 (0) | 0 (0) |
| BT1 PDR0 | 271.7 (2.9) | 303.5 (1.7) | 0 (0) | 0 (0) | 0 (0) | 83 (33) | 22 (17) | 0 (0) | 0 (0) |
| BT2a PDR0 | 244.6 (7.3) | 271.7 (5.4) | 3.6 (1.1) | 3.5 (0.7) | 0 (0) | 98 (43) | 29 (24) | 0 (0) | 0 (0) |
| BT2b PDR0 | 36.8 (2.9) | 39.9 (0.7) | 0 (0) | 0 (0) | 0 (0) | 629 (1078) | 184 (513) | 0 (0) | 0 (0) |
| BT0 PDR5 | 188.0 (14.9) | 273.8 (25.3) | 44.5 (17.0) | 6.8 (1.4) | 6.8 (1.4) | 63 (35) | 15 (5) | 2.8 (1.8) | 2.9 (1.7) |
| BT2a PDR5 | 185.0 (10.9) | 240.2 (43.8) | 38.7 (8.0) | 10.2 (1.4) | 7.2 (1.9) | 99 (66) | 30 (36) | 3.7 (1.6) | 2.6 (1.3) |
| BT2b PDR5 | 30.6 (4.5) | 36.1 (3.0) | 13.7 (15.4) | 6.4 (4.1) | 6.4 (4.1) | 814 (1355) | 162 (413) | 0.2 (0.4) | 0.4 (0.7) |

Since the gossip-like procedure is based on the random choice of the active agents, the tables report the results of the statistical analysis carried out by performing 30 simulations for the same case. For each simulation, the pseudorandom number generator is initialized by different seed states associated with the computer system time. In Tables 2.1 and 2.3, the number of compensation cycles is the number of cycles in which at least one compensator changes its reactive power and the percentage of incomplete compensations indicates the percentage of cycles that do not complete regularly; the power loss decrease indicates the difference between the values of power losses at the starting time and at tset. In Tables 2.2 and 2.4, the number of packets takes into account only those carrying compensation data sent by the agents; the percentage of ignored or lost packets refers to those that arrive at destination after twait or do not arrive at all (for UDP the specific percentage of these lost packets is also provided); packets delay indicates the traveling time of the packets that regularly arrive at destination before twait; and the number of stopped process is the number of stopping actions on the basis of the priority index value. The packed delay values indicated in Tables 2.3 and 2.4 are the mean values of the statistical parameters obtained for each of the 30 simulations.
For TF1 and scenario BT0-PDR0, the mean value (standard deviation) in kvar of the final reactive power outputs of the six compensators is: 146.5 (25.6), 63.1 (2.2), 148.2 (1.4), 144.7 (7.6), 169.8 (4.0), and 164.7 (1.6). The limited values of the standard deviations show that the reactive output scheduling at the end of different compensation cycles is almost the same. The significant value of the first standard deviation is due to the proximity of node 702, where the first compensator is located, to the slack bus. The low value of the standard deviation relevant to the loss decrease (fractions of a kW) shown in Table 2.1 indicates that an analogous power flow conditions is achieved at the end of different sequence of compensations. The procedure converges in less than 30 s to a mean value of the final power losses of about 76.3 kW. The reduction of nearly 13.5 kW is in agreement with the results shown in Ref. [34]. The results are also in reasonable agreement with those obtained by applying the three-phase version of the mixed integer linear programming (MILP) model proposed in Refs. [14] and [64] to the same distribution system, despite the significant differences between the two approaches. The solution of the MILP model provides the following reactive power scheduling (in kvar): 140, 75, 150, 140, 170, and 170 (the reactive power output of the compensators in the implemented MILP model can be changed in steps of 5 kvar). The minimum power loss calculated by the MILP model is 76.27 kW, only some tens of watts lower than that achieved by the gossip procedure.
For TF2 and scenario BT0-PDR0, the mean value (standard deviation) in kvar of the final reactive power outputs of the six compensators is: 258.2 (67.7), 154.2 (2.3), 421.1 (2.3), 272.4 (56.2), -88.6 (17.0), and 132.7 (5.9). As for TF1, Table 2.3 shows that also for TF2 with efficient communication very small standard deviation values of loss decreases are obtained. Therefore analogous power flow conditions are achieved at the end of different sequence of compensations.
As shown in Tables 2.1 and 2.3 the results obtained for scenario BT1-PDR0 are similar to those of scenario BT0-PDR0. For the cases without packet loss (PDR0), as expected, the results show larger delays for increasing BT levels from 0 to 2. Even without PDR, in scenario BT2a due to the congestion of the communication links several packets do not reach the expected receiver within twait = 1 s and therefore they are ignored. Tables 2.2 and 2.4 show that in BT2b this problem is solved as twait is extended to 10 s. While for twait = 1 s the compensation procedure is fast enough so that tset could be considered the time at which the procedure converges, this is no longer true for BT2b. Therefore for BT2b the power loss decrease is evaluated at tf = 100 s, although the convergence is not yet reached due to the insufficient number of compensation cycles.
For the scenarios with PDR = 5%, the number of compensation cycles reduces in particular for TCP. The PDR causes an incomplete cycle when there is the loss of the packet that carries the information from agent k, which compensates first, to agent h. Moreover, the loss of the return packet from the new agent h and the old one causes the start of a process with increased priority index. The presence of concurrent processes is then eliminated by the stop of the process with lower priority index.
In Tables 2.2 and 2.4, we could distinguish between packets lost because of PDR5 from those ignored due to excessive delay only by using UDP, while this classification is not possible with the implemented TCP model because it closes the communication after twait.
The procedure has been also applied to both the case of a higher load level and a lower load level than that indicated in Ref. [63]. The former (high load) is obtained by multiplying both the original active and reactive power values at each load bus (normal load) by a different number obtained through a uniformed distribution between 1.3 and 1.7. The latter (low load) is obtained by using multipliers uniformly distributed between 0.3 and 0.7. The results have been obtained by using the same seed state for the random number generation, that is, by the same sequence of active agent pairs. The convergence of the procedure is similar for all the load levels and the obtained reductions of power losses are shown in Tables 2.5 and 2.6 for TF1 and TF2, respectively, and both scenario BT0-PDR0 and scenario BT0-PDR5.
Table 2.5
Power Loss Reductions Obtained for TF1 Without OLTC for Different Load Levels
| Load Level | Initial Power Loss (kW) | Power Loss Decrease (kW) | |||
| BT0-PDR0 | BT2-PDR5 | ||||
| TCP | UDP | TCP | UDP | ||
| Normal load | 89.8 | 13.5 | 13.5 | 11.8 | 12.9 |
| Low load | 25.2 | 3.9 | 3.9 | 3.4 | 3.8 |
| High load | 211.8 | 31.1 | 31.1 | 24.6 | 28.0 |

Table 2.6
Power Loss Reductions Obtained for TF2 Without OLTCs for Different Load Levels
| Load Profile | Initial Power Loss (kW) | Power Loss Decrease (kW) | |||
| BT0-PDR0 | BT2b-PDR 5 | ||||
| TCP | UDP | TCP | UDP | ||
| Normal load | 125.8 | 11.4 | 11.4 | 11.2 | 11.3 |
| Low load | 33.0 | 1.05 | 1.06 | 1.03 | 1.03 |
| High load | 300.0 | 43.2 | 43.2 | 40.0 | 42.5 |

For TF1, the coordination between the VVC procedure and the action of the OLTC at the substation is illustrated in Figs. 2.7 and 2.8. The value of the desired regulated voltage at the secondary side is 1.02 pu with a dead band limit of ±0.015 pu. The results show that in BT2-PDR5 cases the OLTC starts in tap position 0, operates a first tap change at 22 s and, after other two changes, reaches a final tap equal to −3 at 40 s. In BT1-PDR0 cases, the OLTC operates the first tap change at the same time, and after one additional change it reaches a steady state condition at tap −2 at 30 s. The improved action by the agents with efficient communication results in a lower OLTC regulation. The increase of the power losses after each tap change is due to the increased consumption of voltage dependent loads.

Figure 2.7 Power loss variation in TF1 with OLTC for different BT levels and PDR by using TCP and UDP.

Figure 2.8 Bus voltage variations in TF1 with OLTC for BT1-PDR0 with UDP.
For TF2, the sequence of compensations with both OLTCs in operation is illustrated by Figs. 2.9 and 2.10. The reference values of the secondary side voltage are: 1.01 pu for the substation transformer and 1 pu for OLTC transformer at bus 67, respectively, both with a dead band of ±0.015 pu. The substation transformer changes the tap to −1 position at 22 s and reaches the steady state condition. For BT1-PDR0 with both TCP and UDP, OLTC transformer at bus 67 changes at first the tap to −1 at 25.6 s and then at about 35.6 s (UDP), reaching the final tap −2. For BT2-PDR5 case with UDP, this OLTC after the first tap variation at 25.6 s changes again two other times, reaching a steady state condition at tap −3 at 44.8 s. For BT2-PDR5 case with TCP, the high BT level hinders the communication between node 0 and node 4. Therefore, the OLTC transformer at bus 67 anticipates the first change to nearly 12 s and it reaches the steady state condition with tap −4 at time 39.1 after three other changes.

Figure 2.9 Power loss variation in TF2 with two OLTCs in operation for two different BT levels by using TCP and UDP.

Figure 2.10 Voltage variations in TF2 with two OLTCs in operation for BT1 by using UDP.
2.3.3.2. Results obtained with the cellular communication network
In the simulation relevant to the UMTS network the simulations are repeated for two different BLER values: 1E−5 (case indicated as BLER0) and 0.1 (BLER1), which is a typical reference performance [65]. Moreover the simulations are repeated with BT (case indicated as BT1) and without the BT (BT0). In order to obtain a significant value of the BT, the UEs associated to the agents and six additional UEs are forced to generate the BT towards two additional UEs receivers belonging to the same RNC subnetwork.
We assume that each of converters that act as a reactive power compensator also injects a constant active power equal to 400 kW, while the initial reactive outputs are null. The OLTCs start in tap position 0.
Tables 2.7 and 2.8 compare the results obtained for the eight scenarios characterized by different values of BLER, BT, and load levels. For each case the calculation has been repeated 20 times. In Table 2.8, the numbers of packets (transmitted and received, if the relevant numbers differ) take into account only those packets carrying data relevant to the gossip algorithm.
Table 2.7
Number of Compensation Cycles, Percentage of Incomplete Compensations, Power Loss Decrease, and Settling Time for TF1 and TF2
| BLER BT (Load Level) | No of Compensation Cycles, Mean (Stdev) | % of Incomplete Compensations, Mean (Stdev) | Power Loss Decrease (kW), Mean (Stdev) | Settling Time (s), Mean (Stdev) | ||||
| TF1 | TF2 | TF1 | TF2 | TF1 | TF2 | TF1 | TF2 | |
| BLER0 BT0 (normal) | 154 | 154 | 0 | 0 | 15.8 (0.1) | 5.5 (0.1) | 62.4 (12.6) | 31.5 (6.9) |
| BLER1 BT0 (normal) | 117.5 (32.5) | 117.2 (24.2) | 15.5 (3.2) | 16.6 (4.0) | 15.3 (1.4) | 5.5 (0.1) | 63.0 (17.0) | 40.4 (11.8) |
| BLER0 BT1 (normal) | 119.5 (19.5) | 122.9 (14.2) | 16.0 (4.3) | 11.6 (2.3) | 15.3 (1.2) | 5.4 (0.2) | 71.0 (20.8) | 43.6 (15.9) |
| BLER1 BT1 (normal) | 102.0 (18.9) | 107.0 (15.1) | 29.9 (5.0) | 26.6 (5.4) | 15.5 (0.9) | 5.4 (0.5) | 77.5 (20.3) | 42.6 (18.0) |
| BLER0 BT0 (high) | 154 | 154 | 0 | 0 | 25.6 (0.05) | 19.4 (0.5) | 78.3 (11.5) | 93.9 (36.4) |
| BLER1 BT0 (high) | 129.3 (12.6) | 115.9 (30.7) | 17.6 (3.3) | 16.3 (2.8) | 25.5 (0.9) | 18.0 (3.4) | 102.2 (29.8) | 91.2 (27.0) |
| BLER0 BT1 (high) | 119.9 (18.8) | 121.0 (23.1) | 16.4 (3.9) | 11.0 (3.3) | 25.0 (2.3) | 18.5 (3.3) | 87.7 (16.3) | 79.2 (17.5) |
| BLER1 BT1 (high) | 101.4 (22.3) | 108.3 (11.2) | 32.4 (7.2) | 25.6 (4.9) | 24.3 (3.8) | 17.9 (1.4) | 105.2 (39.2) | 122.2 (21.2) |

Table 2.8
Number of Packets (Tx, Transmitted; Rx, Received), Percentage of Ignored and Lost Packets, Packet Delay, and Number of Stopped Process for TF1 and TF2
| BLER BT (Load Level) | No. of Packets Mean (Stdev) Tx, Mean (Stdev) Rx | % of Packets Ignored, Mean (Stdev) | % of Packet Lost, Mean (Stdev) | Packet Delay (ms), Mean (Stdev) | No. of Stopped Processes, Mean (Stdev) | |||||
| TF1 | TF2 | TF1 | TF2 | TF1 | TF2 | TF1 | TF2 | TF1 | TF2 | |
| BLER0 BT0 (normal) | 618.2(1.3) 618.2(1.3) | 618.8(1.4) 618.8(1.4) | 0 | 0 | 0 | 0 | 145.2 (10.2) | 145.0 (10.1) | 0 | 0 |
| BLER1 BT0 (normal) | 542.6(125.8) 447.3(104.8) | 526.5(104.4) 434.6(87.0) | 5.5 (1.2) | 6.0 (1.0) | 11.9 (5.7) | 11.5 (1.5) | 147.2 (32.7) | 146.2 (29.6) | 11.1 (3.4) | 11.1 (3.6) |
| BLER0 BT1 (normal) | 528.2(77.5) 443.9(68.7) | 551.7(52.7) 478.2(50.6) | 7.6 (1.3) | 6.3 (1.1) | 8.5 (1.3) | 7.2 (1.0) | 212.0 (154.1) | 239.3 (173.5) | 7.0 (2.6) | 7.4 (2.7) |
| BLER1 BT1 (normal) | 527(91.0) 371.6(62.6) | 510.1(68.7) 378.4(55.3) | 13.0 (1.4) | 12.2 (1.8) | 16.2 (4.2) | 13.8 (1.7) | 244.6 (197.8) | 259.0 (202.3) | 13.0 (5.3) | 9.6 (3.0) |
| BLER0 BT0 (high) | 618.5(1.3) 618.5(1.3) | 618.4(1.5) 618.4(1.5) | 0 | 0 | 0 | 0 | 145.1 (10.1) | 145.4 (10.4) | 0 | 0 |
| BLER1 BT0 (high) | 569.9(56.6) 474.5(30.5) | 520.0(139.1) 433.1(116.1) | 5.3 (0.7) | 5.7 (1.0) | 11.5 (1.7) | 10.9 (1.3) | 146.2 (26.4) | 147.0 (31.3) | 11.5 (3.4) | 11.5 (4.0) |
| BLER0 BT1 (high) | 548.6(49.1) 457.3(43.4) | 543.5(102.9) 472.6(92.0) | 7.2 (1.3) | 6.1 (1.3) | 9.3 (5.8) | 7.3 (1.3) | 213.0 (157.0) | 239.0 (173.6) | 6.9 (2.9) | 7.9 (2.8) |
| BLER1 BT1 (high) | 488.7(104.7) 347.5(75.0) | 524.2(37.3) 389.6(36.5) | 13.4 (2.3) | 12.0 (1.4) | 15.3 (1.9) | 13.8 (1.9) | 244.5 (195.7) | 260.3 (205.3) | 10.5 (4.0) | 12.0 (3.7) |

The final values of the bus voltages at the compensator buses are significantly improved with respect to the initial condition (eg, for TF1 in BLER0, BT0, and normal load the maximum deviation form 1 pu is equal to 1.1%). For BLER1, the number of compensation cycles reduces and the higher BLER causes both the interruption of incomplete processes and the start of concurrent processes (progressively stopped on the basis of their priority index) due to the loss of packets that carries critical information. Also for BT1, the additional transmissions cause a reduction of the number of compensation cycles and at the same time the increasing of the packets delay.
2.4. Conclusions
This chapter provides a review of the issues and most relevant typical countermeasures concerning the integration of DERs in distribution power systems. In general, modern solutions tend to increase the use of communication networks for the operation of power distribution systems. Moreover, improved equipment for both monitoring and control purposes are being installed. In particular, there is an increasing interest for PMUs, which are now commonly used for the operation of many transmission grids.
In order to provide an example, with a focus on the VVC of distribution feeders, this chapter analyses of the performances of a leaderless MAS scheme based on the information provided by PMUs. The analysis is carried out by means of a specifically developed ICT power cosimulation platform that accurately represents the transient phenomena in the power distribution system and the behavior of the communication network.
This application example illustrates the typical limitations induced by BT and loss of information in the communication channels, by means of the results obtained using both the model of a wired network and that of a cellular network. The specific countermeasures implemented in the MAS approach are described. In particular, a mechanism based on a priority index allows for the start of multiple concurrent compensations processes whenever packet carrying critical information is lost. The processes with low priority indexes are progressively stopped by the agents included in the scheme in order to guarantee the convergence performances of the algorithm. The results show that the performances of the adopted MAS approach appear reasonably good also for medium values of background data traffic and loss of information, taking also into account the expected accuracy of PMUs for MV distribution networks.
Acknowledgment
The application example shown in this chapter is based on results obtained in the framework of the research activities supported in part by University of Bologna (FARB FFBO122030) and by ENIACJU/CALL 2011-1/296131 E2SG “Energy to smart grid”. These activities have been carried out in collaboration with several colleagues who are the coauthors of the papers in which the obtained results have been originally presented: Davood Babazadeh (Kungliga Tekniska Högskolan - KTH), Marina Barbiroli (University of Bologna), Riccardo Bottura (University of Bologna), Fabio Napolitano (University Bologna), Lars Nordstrom (KTH), and Kun Zhu (KTH). Riverbed modeler software has been used thanks to the Riverbed University Program. The EMTP-rv simulation environment has been used in the framework of the Powersys Company Education partnership.
..................Content has been hidden....................
You can't read the all page of ebook, please click here login for view all page.