After studying this chapter, you should be able to:
PREVIEW OF CHAPTER 9
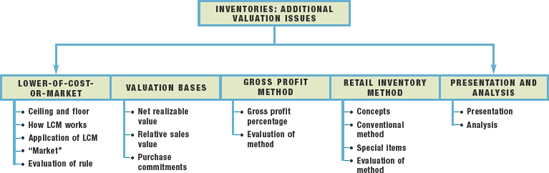
As our opening story indicates, information on inventories and changes in inventory helps to predict financial performance—in particular, profits. In this chapter we discuss some of the valuation and estimation concepts that companies use to develop relevant inventory information. The content and organization of the chapter are as follows.
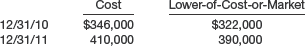
Inventories are recorded at their cost. However, if inventory declines in value below its original cost, a major departure from the historical cost principle occurs. Whatever the reason for a decline—obsolescence, price-level changes, or damaged goods—a company should write down the inventory to market to report this loss. A company abandons the historical cost principle when the future utility (revenue-producing ability) of the asset drops below its original cost. Companies therefore report inventories at the lower-of-cost-or-market at each reporting period.
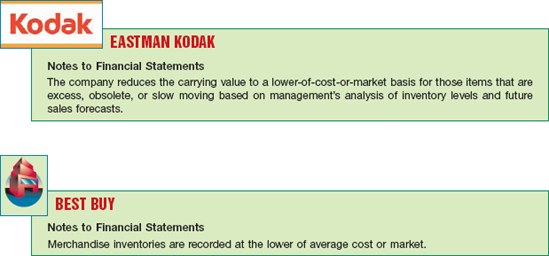
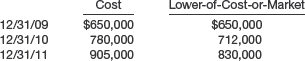
Illustration 9-1 shows how Eastman Kodak and Best Buy reported this information.
Recall that cost is the acquisition price of inventory computed using one of the historical cost-based methods—specific identification, average cost, FIFO, or LIFO. The term market in the phrase "the lower-of-cost-or-market" (LCM) generally means the cost to replace the item by purchase or reproduction. For a retailer like Nordstrom, the term "market" refers to the market in which it purchases goods, not the market in which it sells them. For a manufacturer like William Wrigley Jr., the term "market" refers to the cost to reproduce. Thus the rule really means that companies value goods at cost or cost to replace, whichever is lower.

iGAAP defines market as net realizable value; U.S. GAAP defines market as replacement cost subject to certain constraints.
For example, say Target purchased a Timex calculator wristwatch for $30 for resale. Target can sell the wristwatch for $48.95 and replace it for $25. It should therefore value the wristwatch at $25 for inventory purposes under the lower-of-cost-or-market rule. Target can use the lower-of-cost-or-market rule of valuation after applying any of the cost flow methods discussed above to determine the inventory cost.
A departure from cost is justified because a company should charge a loss of utility against revenues in the period in which the loss occurs, not in the period of sale. Note also that the lower-of-cost-or-market method is a conservative approach to inventory valuation. That is, when doubt exists about the value of an asset, a company should use the lower value for the asset, which also reduces net income.
Why use replacement cost to represent market value? Because a decline in the replacement cost of an item usually reflects or predicts a decline in selling price. Using replacement cost allows a company to maintain a consistent rate of gross profit on sales (normal profit margin). Sometimes, however, a reduction in the replacement cost of an item fails to indicate a corresponding reduction in its utility. This requires using two additional valuation limitations to value ending inventory—net realizable value and net realizable value less a normal profit margin.
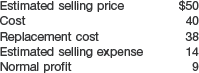
Net realizable value (NRV) is the estimated selling price in the ordinary course of business, less reasonably predictable costs of completion and disposal (often referred to as net selling price). A normal profit margin is subtracted from that amount to arrive at net realizable value less a normal profit margin.
To illustrate, assume that Jerry Mander Corp. has unfinished inventory with a sales value of $1,000, estimated cost of completion and disposal of $300, and a normal profit margin of 10 percent of sales. Jerry Mander determines the following net realizable value.

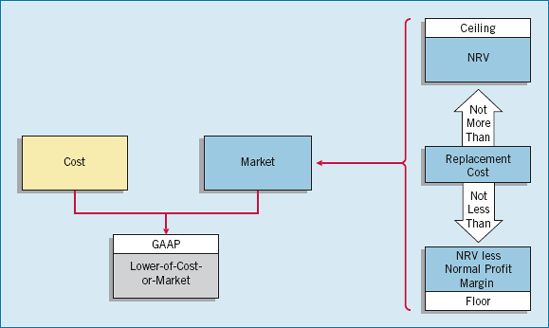
The general lower-of-cost-or-market rule is: A company values inventory at the lower-of-cost-or-market, with market limited to an amount that is not more than net realizable value or less than net realizable value less a normal profit margin. [1]
The upper (ceiling) is the net realizable value of inventory. The lower (floor) is the the net realizable value less a normal profit margin. What is the rationale for these two limitations? Establishing these limits for the value of the inventory prevents companies from over- or understating inventory.
The maximum limitation, not to exceed the net realizable value (ceiling), prevents overstatement of the value of obsolete, damaged, or shopworn inventories. That is, if the replacement cost of an item exceeds its net realizable value, a company should not report inventory at replacement cost. The company can receive only the selling price less cost of disposal. To report the inventory at replacement cost would result in an overstatement of inventory and understatement of the loss in the current period.
To illustrate, assume that Staples paid $1,000 for a color laser printer that it can now replace for $900. The printer's net realizable value is $700. At what amount should Staples report the laser printer in its financial statements? To report the replacement cost of $900 overstates the ending inventory and understates the loss for the period. Therefore, Staples should report the printer at $700.
The minimum limitation (floor) is not to be less than net realizable value reduced by an allowance for an approximately normal profit margin. The floor establishes a value below which a company should not price inventory, regardless of replacement cost. It makes no sense to price inventory below net realizable value less a normal margin. This minimum amount (floor) measures what the company can receive for the inventory and still earn a normal profit. Use of a floor deters understatement of inventory and overstatement of the loss in the current period.
Illustration 9-3 (on page 440) graphically presents the guidelines for valuing inventory at the lower-of-cost-or-market.
The designated market value is the amount that a company compares to cost. It is always the middle value of three amounts: replacement cost, net realizable value, and net realizable value less a normal profit margin. To illustrate how to compute designated market value, assume the information relative to the inventory of Regner Foods, Inc., as shown in Illustration 9-4.
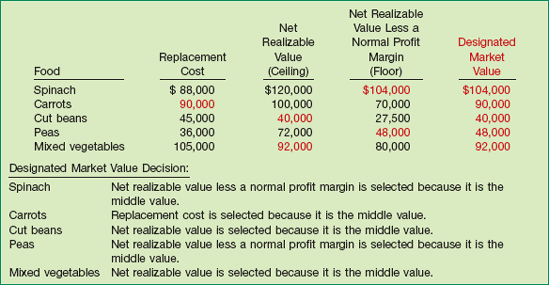
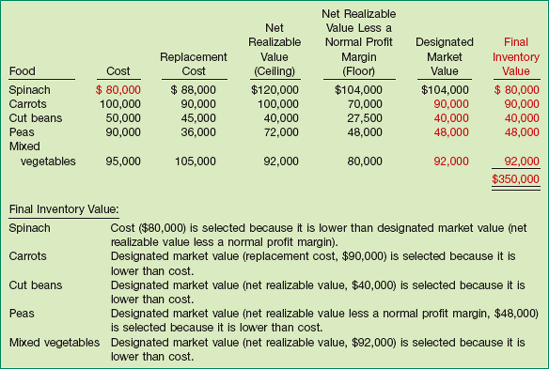
Regner Foods then compares designated market value to cost to determine the lower-of-cost-or-market. It determines the final inventory value as shown in Illustration 9-5 (on page 441).
The application of the lower-of-cost-or-market rule incorporates only losses in value that occur in the normal course of business from such causes as style changes, shift in demand, or regular shop wear. A company reduces damaged or deteriorated goods to net realizable value. When material, it may carry such goods in separate inventory accounts.
In the Regner Foods illustration, we assumed that the company applied the lower-of-cost-or-market rule to each individual type of food. However, companies may apply the lower-of-cost-or-market rule either directly to each item, to each category, or to the total of the inventory. If a company follows a major category or total inventory approach in applying the lower-of-cost-or-market rule, increases in market prices tend to offset decreases in market prices. To illustrate, assume that Regner Foods separates its food products into two major categories, frozen and canned, as shown in Illustration 9-6.
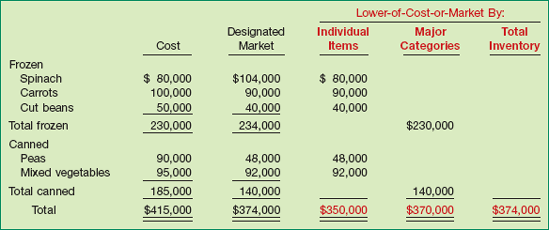
If Regner Foods applied the lower-of-cost-or-market rule to individual items, the amount of inventory is $350,000. If applying the rule to major categories, it jumps to $370,000. If applying LCM to the total inventory, it totals $374,000. Why this difference? When a company uses a major categories or total inventory approach, market values higher than cost offset market values lower than cost. For Regner Foods, using the major categories approach partially offsets the high market value for spinach. Using the total inventory approach totally offsets it.
Companies usually price inventory on an item-by-item basis. In fact, tax rules require that companies use an individual-item basis barring practical difficulties. In addition, the individual-item approach gives the most conservative valuation for balance sheet purposes.[122] Often, a company prices inventory on a total-inventory basis when it offers only one end product (comprised of many different raw materials). If it produces several end products, a company might use a category approach instead. The method selected should be the one that most clearly reflects income. Whichever method a company selects, it should apply the method consistently from one period to another.[123]
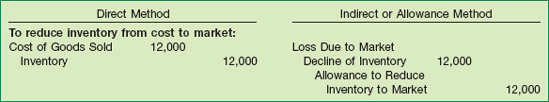
One of two methods is used for recording inventory at market. One method, referred to as the direct method, substitutes the (lower) market value figure for cost when valuing the inventory. As a result, the company does not report a loss in the income statement because the cost of goods sold already includes the amount of the loss. The second method, referred to as the indirect method or allowance method, does not change the cost amount. Rather, it establishes a separate contra asset account and a loss account to record the write-off.
We use the following inventory data to illustrate entries under both methods.
Illustration 9-7 shows the entries for both the direct and indirect methods, assuming the use of a perpetual inventory system.

The income statement under the direct method presentation lacks representational faithfulness. The cost of goods sold does not represent what it purports to represent. However, allowing this presentation illustrates the concept of materiality. That is, the presentation does not affect net income and would not "change the judgment of a reasonable person."
Identifying the loss due to market decline shows the loss separate from cost of goods sold in the income statement (but not as an extraordinary item). The advantage of this approach is that it does not distort the cost of goods sold.
Illustration 9-8 (on page 443) contrasts the differing amounts reported in the income statements under the two methods, using data from the preceding illustration.
The direct-method presentation buries the loss in the cost of goods sold. The indirect-method presentation is preferable, because it clearly discloses the loss resulting from the market decline of inventory prices.
Using the indirect method, the company would report the Allowance to Reduce Inventory to Market on the balance sheet as a $12,000 deduction from the inventory. This deduction permits both the income statement and the balance sheet to show the ending inventory of $82,000, although the balance sheet shows a net amount of $70,000. It also keeps subsidiary inventory ledgers and records in correspondence with the control account without changing unit prices.

Figure 9-8. Income Statement Presentation—Direct and Indirect Methods of Reducing Inventory to Market
Use of an allowance account permits balance sheet disclosure of the inventory at cost and at the lower-of-cost-or-market. However, it raises the problem of how to dispose of the balance of the allowance account in the following period. If the company still has on hand the merchandise in question, it should retain the allowance account. If it does not keep that account, the company will overstate beginning inventory and cost of goods. However, if the company has sold the goods, then it should close the account. It then establishes a "new allowance account" for any decline in inventory value that takes place in the current year.[124]
Some accountants leave the allowance account on the books. They merely adjust the balance at the next year-end to agree with the discrepancy between cost and the lower-of-cost-or-market at that balance sheet date. Thus, if prices are falling, the company records a loss. If prices are rising, the company recovers a loss recorded in prior years, and it records a "gain," as shown in Illustration 9-9. Note that this "gain" is not really a gain, but a recovery of a previously recognized loss.
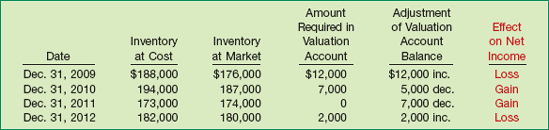
We can think of this net "gain" under the indirect method as the excess of the credit effect of closing the beginning allowance balance over the debit effect of setting up the current year-end allowance account. Recognizing a gain or loss has the same effect on net income as closing the allowance balance to beginning inventory or to cost of goods sold.
The lower-of-cost-or-market rule is designed to provide timely information about the decline in the value of inventory. When the value of inventory declines, income takes a hit in the period of the write-down.
What happens in the periods after the write-down? For some companies, gross margins and bottom lines get a boost when they sell inventory that had been written down in a previous period. For example, as the following table shows, Vishay Intertechnology, Transwitch, and Cisco Systems reported gains from selling inventory that had previously been written down. The table also evaluates how clearly these companies disclosed the effects of the reversal of inventory write-downs.
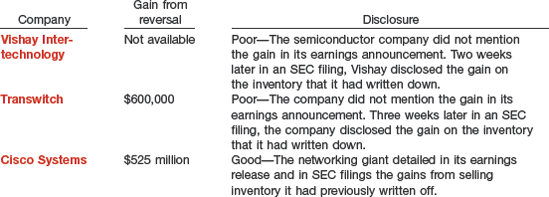
For Transwitch, the reversal of fortunes amounted to 23 percent of net income. The problem is that the $600,000 credit had little to do with the company's ongoing operations, and the company did not do a good job disclosing the effect of the reversal on current-year profitability.
Even when companies do disclose a reversal, it is sometimes hard to determine the impact on income. For example, Intel disclosed that is had sold inventory that had been written down in prior periods but did not specify how much reserved inventory was sold.
After the recent accounting scandals, transparency of financial reporting has become a top priority. With better disclosure of the reversals that boost profits in the current period, financial transparency would also get a boost.
Source: S. E. Ante, "The Secret Behind Those Profit Jumps," Business Week Online (December 8, 2003).
The lower-of-cost-or-market rule suffers some conceptual deficiencies:
A company recognizes decreases in the value of the the asset and the charge to expense in the period in which the loss in utility occurs—not in the period of sale. On the other hand, it recognizes increases in the value of the asset only at the point of sale. This inconsistent treatment can distort income data.
Application of the rule results in inconsistency because a company may value the inventory at cost in one year and at market in the next year.
Lower-of-cost-or-market values the inventory in the balance sheet conservatively, but its effect on the income statement may or may not be conservative. Net income for the year in which a company takes the loss is definitely lower. Net income of the subsequent period may be higher than normal if the expected reductions in sales price do not materialize.
Application of the lower-of-cost-or-market rule uses a "normal profit" in determining inventory values. Since companies estimate "normal profit" based on past experience (which they may not attain in the future), this subjective measure presents an opportunity for income manipulation.
Many financial statement users appreciate the lower-of-cost-or-market rule because they at least know that it prevents overstatement of inventory. In addition, recognizing all losses but anticipating no gains generally results in lower income.
For the most part, companies record inventory at cost or at the lower-of-cost-or-market.[125] However, many believe that for purposes of applying the lower-of-cost-or-market rule, companies should define "market" as net realizable value (selling price less estimated costs to complete and sell), rather than as replacement cost. This argument is based on the fact that the amount that companies will collect from this inventory in the future is the net realizable value.[126]
Under limited circumstances, support exists for recording inventory at net realizable value, even if that amount is above cost. GAAP permits this exception to the normal recognition rule under the following conditions: (1) when there is a controlled market with a quoted price applicable to all quantities, and (2) when no significant costs of disposal are involved. For example, mining companies ordinarily report inventories of certain minerals (rare metals, especially) at selling prices because there is often a controlled market without significant costs of disposal. Similar treatment is given agricultural products that are immediately marketable at quoted prices.
A third reason for allowing valuation at net realizable value is that sometimes it is too difficult to obtain the cost figures. Cost figures are not difficult to determine in, say, a manufacturing plant, where the company combines various raw materials and purchased parts to create a finished product. The manufacturer can use the cost basis to account for various items in inventory, because it knows the cost of each individual component part. The situation is different in a meat-packing plant, however. The "raw material" consists of, say, cattle, each unit of which the company purchases as a whole and then divides into parts that are the products. Instead of one product out of many raw materials or parts, the meat-packing company makes many products from one "unit" of raw material. To allocate the cost of the animal "on the hoof" into the cost of, say, ribs, chuck, and shoulders, is a practical impossibility. It is much easier and more useful for the company to determine the market price of the various products and value them in the inventory at selling price less the various costs necessary to get them to market (costs such as shipping and handling). Hence, because of a peculiarity of the industry, meat-packing companies sometimes carry inventories at sales price less distribution costs.
A special problem arises when a company buys a group of varying units in a single lump-sum purchase, also called a basket purchase.
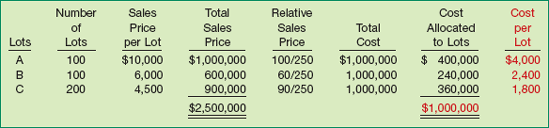
To illustrate, assume that Woodland Developers purchases land for $1 million that it will subdivide into 400 lots. These lots are of different sizes and shapes but can be roughly sorted into three groups graded A, B, and C. As Woodland sells the lots, it apportions the purchase cost of $1 million among the lots sold and the lots remaining on hand.
You might wonder why Woodland would not simply divide the total cost of $1 million by 400 lots, to get a cost of $2,500 for each lot. This approach would not recognize that the lots vary in size, shape, and attractiveness. Therefore, to accurately value each unit, the common and most logical practice is to allocate the total among the various units on the basis of their relative sales value.
Illustration 9-10 shows the allocation of relative sales value for the Woodland Developers example.
Using the amounts given in the "Cost Per Lot" column, Woodland can determine the cost of lots sold and the gross profit as follows.
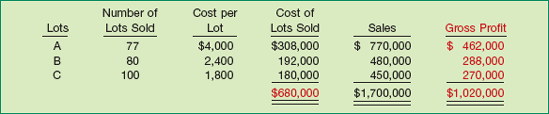
The ending inventory is therefore $320,000 ($1,000,000 − $680,000).
Woodland also can compute this inventory amount another way. The ratio of cost to selling price for all the lots is $1 million divided by $2,500,000, or 40 percent. Accordingly, if the total sales price of lots sold is, say $1,700,000, then the cost of the lots sold is 40 percent of $1,700,000, or $680,000. The inventory of lots on hand is then $1 million less $680,000, or $320,000.
The petroleum industry widely uses the relative sales value method to value (at cost) the many products and by-products obtained from a barrel of crude oil.
In many lines of business, a company's survival and continued profitability depends on its having a sufficient stock of merchandise to meet customer demand. Consequently, it is quite common for a company to make purchase commitments, which are agreements to buy inventory weeks, months, or even years in advance. Generally, the seller retains title to the merchandise or materials covered in the purchase commitments. Indeed, the goods may exist only as natural resources as unplanted seed (in the case of agricultural commodities), or as work in process (in the case of a product).[127]
Usually it is neither necessary nor proper for the buyer to make any entries to reflect commitments for purchases of goods that the seller has not shipped. Ordinary orders, for which the buyer and seller will determine prices at the time of shipment and which are subject to cancellation, do not represent either an asset or a liability to the buyer. Therefore the buyer need not record such purchase commitments or report them in the financial statements.
What happens, though, if a buyer enters into a formal, noncancelable purchase contract? Even then, the buyer recognizes no asset or liability at the date of inception, because the contract is "executory" in nature: Neither party has fulfilled its part of the contract. However, if material, the buyer should disclose such contract details in a note to its financial statements. Illustration 9-12 shows an example of a purchase commitment disclosure.
In the disclosure in Illustration 9-12, the contract price was less than the market price at the balance sheet date. If the contract price is greater than the market price, and the buyer expects that losses will occur when the purchase is effected, the buyer should recognize losses in the period during which such declines in market prices take place. [3]
As an example, at one time many Northwest forest-product companies such as Boise Cascade, Georgia-Pacific, and Weyerhaeuser signed long-term timber-cutting contracts with the U.S. Forest Service. These contracts required that the companies pay $310 per thousand board feet for timber-cutting rights. Unfortunately, the market price for timber-cutting rights in late 1984 dropped to $80 per thousand board feet. As a result, a number of these companies had long-term contracts that, if fulfilled, would result in substantial future losses.
To illustrate the accounting problem, assume that St. Regis Paper Co. signed timber-cutting contracts to be executed in 2012 at a price of $10,000,000. Assume further that the market price of the timber cutting rights on December 31, 2011, dropped to $7,000,000. St. Regis would make the following entry on December 31, 2011.
Reporting the loss is conservative. However, reporting the decline in market price is debatable because no asset is recorded. This area demonstrates the need for good definitions of assets and liabilities.
St. Regis would report this unrealized holding loss in the income statement under "Other expenses and losses." And because the contract is to be executed within the next fiscal year, St. Regis would report the Estimated Liability on Purchase Commitments in the current liabilities section on the balance sheet. When St. Regis cuts the timber at a cost of $10 million, it would make the following entry.
The result of the purchase commitment was that St. Regis paid $10 million for a contract worth only $7 million. It recorded the loss in the previous period—when the price actually declined.
If St. Regis can partially or fully recover the contract price before it cuts the timber, it reduces the Estimated Liability on Purchase Commitments. In that case, it then reports in the period of the price increase a resulting gain for the amount of the partial or full recovery. For example, Congress permitted some of the forest-products companies to buy out of their contracts at reduced prices in order to avoid potential bankruptcies. To illustrate, assume that Congress permitted St. Regis to reduce its contract price and therefore its commitment by $1,000,000. The entry to record this transaction is as follows.
If the market price at the time St. Regis cuts the timber is more than $2,000,000 below the contract price, St. Regis will have to recognize an additional loss in the period of cutting and record the purchase at the lower-of-cost-or-market.
Are purchasers at the mercy of market price declines? Not totally. Purchasers can protect themselves against the possibility of market price declines of goods under contract by hedging. In hedging, the purchaser in the purchase commitment simultaneously enters into a contract in which it agrees to sell in the future the same quantity of the same (or similar) goods at a fixed price. Thus the company holds a buy position in a purchase commitment and a sell position in a futures contract in the same commodity. The purpose of the hedge is to offset the price risk of the buy and sell positions: The company will be better off under one contract by approximately (maybe exactly) the same amount by which it is worse off under the other contract.
For example, St. Regis Paper Co. could have hedged its purchase commitment contract with a futures contract for timber rights of the same amount. In that case, its loss of $3,000,000 on the purchase commitment could have been offset by a $3,000,000 gain on the futures contract.[128]
As easy as this makes it sound, accounting for purchase commitments is still unsettled and controversial. Some argue that companies should report purchase commitments as assets and liabilities at the time they sign the contract.[129] Others believe that the present recognition at the delivery date is more appropriate. FASB Concepts Statement No. 6 states, "a purchase commitment involves both an item that might be recorded as an asset and an item that might be recorded as a liability. That is, it involves both a right to receive assets and an obligation to pay. ... If both the right to receive assets and the obligation to pay were recorded at the time of the purchase commitment, the nature of the loss and the valuation account that records it when the price falls would be clearly seen." Although the discussion in Concepts Statement No. 6 does not exclude the possibility of recording assets and liabilities for purchase commitments, it contains no conclusions or implications about whether companies should record them.[130]
Companies take a physical inventory to verify the accuracy of the perpetual inventory records or, if no records exist, to arrive at an inventory amount. Sometimes, however, taking a physical inventory is impractical. In such cases, companies use substitute measures to approximate inventory on hand.
One substitute method of verifying or determining the inventory amount is the gross profit method (also called the gross margin method). Auditors widely use this method in situations where they need only an estimate of the company's inventory (e.g., interim reports). Companies also use this method when fire or other catastrophe destroys either inventory or inventory records. The gross profit method relies on three assumptions:
The beginning inventory plus purchases equal total goods to be accounted for.
Goods not sold must be on hand.
The sales, reduced to cost, deducted from the sum of the opening inventory plus purchases, equal ending inventory.
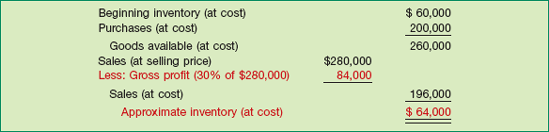
To illustrate, assume that Cetus Corp. has a beginning inventory of $60,000 and purchases of $200,000, both at cost. Sales at selling price amount to $280,000. The gross profit on selling price is 30 percent. Cetus applies the gross margin method as follows.
The current period's records contain all the information Cetus needs to compute inventory at cost, except for the gross profit percentage. Cetus determines the gross profit percentage by reviewing company policies or prior period records. In some cases, companies must adjust this percentage if they consider prior periods unrepresentative of the current period.[131]
In most situations, the gross profit percentage is stated as a percentage of selling price. The previous illustration, for example, used a 30 percent gross profit on sales. Gross profit on selling price is the common method for quoting the profit for several reasons: (1) Most companies state goods on a retail basis, not a cost basis. (2) A profit quoted on selling price is lower than one based on cost. This lower rate gives a favorable impression to the consumer. (3) The gross profit based on selling price can never exceed 100 percent.[132]
In Illustration 9-13, the gross profit was a given. But how did Cetus derive that figure? To see how to compute a gross profit percentage, assume that an article cost $15 and sells for $20, a gross profit of $5. As shown in the computations in Illustration 9-14, this markup is ¼ or 25 percent of retail, and ⅓ or, 33⅓ percent of cost.
Although companies normally compute the gross profit on the basis of selling price, you should understand the basic relationship between markup on cost and markup on selling price. For example, assume that a company marks up a given item by 25 percent. What, then, is the gross profit on selling price? To find the answer, assume that the item sells for $1. In this case, the following formula applies.
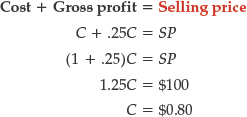
The gross profit equals $0.20 ($1.00 − $0.80). The rate of gross profit on selling price is therefore 20 percent ($0.20/$1.00).
Conversely, assume that the gross profit on selling price is 20 percent. What is the markup on cost? To find the answer, again assume that the item sells for $1. Again, the same formula holds:
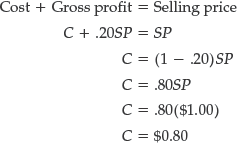
As in the previous example, the markup equals $0.20 ($1.00 − $0.80). The markup on cost is 25 percent ($0.20/$0.80).
Retailers use the following formulas to express these relationships:

To understand how to use these formulas, consider their application in the following calculations.
Because selling price exceeds cost, and with the gross profit amount the same for both, gross profit on selling price will always be less than the related percentage based on cost. Note that companies do not multiply sales by a cost-based markup percentage. Instead, they must convert the gross profit percentage to a percentage based on selling price.
What are the major disadvantages of the gross profit method? One disadvantage is that it provides an estimate. As a result, companies must take a physical inventory once a year to verify the inventory. Second, the gross profit method uses past percentages in determining the markup. Although the past often provides answers to the future, a current rate is more appropriate. Note that whenever significant fluctuations occur, companies should adjust the percentage as appropriate. Third, companies must be careful in applying a blanket gross profit rate. Frequently, a store or department handles merchandise with widely varying rates of gross profit. In these situations, the company may need to apply the gross profit method by subsections, lines of merchandise, or a similar basis that classifies merchandise according to their respective rates of gross profit. The gross profit method is normally unacceptable for financial reporting purposes because it provides only an estimate. GAAP requires a physical inventory as additional verification of the inventory indicated in the records. Nevertheless, GAAP permits the gross profit method to determine ending inventory for interim (generally quarterly) reporting purposes, provided a company discloses the use of this method. Note that the gross profit method will follow closely the inventory method used (FIFO, LIFO, average cost) because it relies on historical records.
Managers and analysts closely follow gross profits. A small change in the gross profit rate can significantly affect the bottom line. In 1993, Apple Computer suffered a textbook case of shrinking gross profits. In response to pricing wars in the personal computer market, Apple had to quickly reduce the price of its signature Macintosh computers—reducing prices more quickly than it could reduce its costs. As a result its gross profit rate fell from 44 percent in 1992 to 40 percent in 1993. Though the drop of 4 percent seems small, its impact on the bottom line caused Apple's stock price to drop from $57 per share on June 1, 1993, to $27.50 by mid-July 1993. As another example, Debenham, the second largest department store in the United Kingdom, experienced a 14 percentage share price decline. The cause? Markdowns on slow-moving inventory reduced its gross margin. On the positive side, an increase in the gross profit rate provides a positive signal to the market. For example, just a 1 percent boost in Dr. Pepper's gross profit rate cheered the market, indicating the company was able to avoid the squeeze of increased commodity costs by raising its prices.
Source: Alison Smith, "Debenham's Shares Hit by Warning," Financial Times (July 24, 2002), p. 21; and D. Kardous, "Higher Pricing Helps Boost Dr. Pepper Snapple's Net," Wall Street Journal Online (June 5, 2008).
Accounting for inventory in a retail operation presents several challenges. Retailers with certain types of inventory may use the specific identification method to value their inventories. Such an approach makes sense when a retailer holds significant individual inventory units, such as automobiles, pianos, or fur coats. However, imagine attempting to use such an approach at Target, True-Value Hardware, Sears Holdings, or Bloomingdale's—high-volume retailers that have many different types of merchandise. It would be extremely difficult to determine the cost of each sale, to enter cost codes on the tickets, to change the codes to reflect declines in value of the merchandise, to allocate costs such as transportation, and so on.
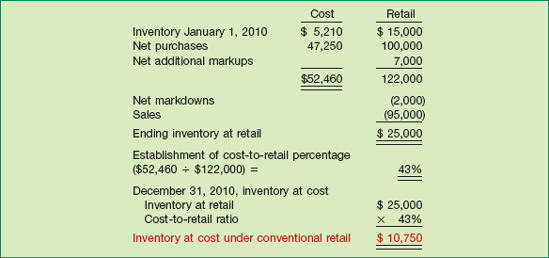
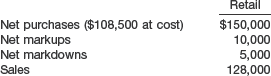
An alternative is to compile the inventories at retail prices. For most retailers, an observable pattern between cost and price exists. The retailer can then use a formula to convert retail prices to cost. This method is called the retail inventory method. It requires that the retailer keep a record of (1) the total cost and retail value of goods purchased, (2) the total cost and retail value of the goods available for sale, and (3) the sales for the period. Use of the retail inventory method is very common. For example, Safeway supermarkets uses the retail inventory method, as does Target Corp., Wal-Mart, and Best Buy.
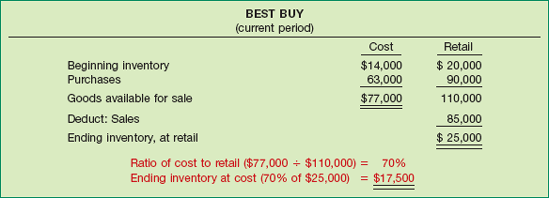
Here is how it works at a company like Best Buy: Beginning with the retail value of the goods available for sale, Best Buy deducts the sales for the period. This calculation determines an estimated inventory (goods on hand) at retail. It next computes the cost-to-retail ratio for all goods. The formula for this computation is to divide the cost of total goods available for sale at cost by the total goods available at retail price. Finally, to obtain ending inventory at cost, Best Buy applies the cost-to-retail ratio to the ending inventory valued at retail. Illustration 9-17 shows the retail inventory method calculations for Best Buy (assumed data).
There are different versions of the retail inventory method. These include the conventional method (based on lower-of-average-cost-or-market), the cost method, the LIFO retail method, and the dollar-value LIFO retail method. Regardless of which version a company uses, the IRS, various retail associations, and the accounting profession all sanction use of the retail inventory method. One of its advantages is that a company like Target can approximate the inventory balance without a physical count. However, to avoid a potential overstatement of the inventory, Target makes periodic inventory counts. Such counts are especially important in retail operations where loss due to shoplifting or breakage is common.
The retail inventory method is particularly useful for any type of interim report, because such reports usually need a fairly quick and reliable measure of the inventory. Also, insurance adjusters often use this method to estimate losses from fire, flood, or other type of casualty. This method also acts as a control device because a company will have to explain any deviations from a physical count at the end of the year. Finally, the retail method expedites the physical inventory count at the end of the year. The crew taking the physical inventory need record only the retail price of each item. The crew does not need to look up each item's invoice cost, thereby saving time and expense.
The amounts shown in the "Retail" column of Illustration 9-17 represent the original retail prices, assuming no price changes. In practice, though, retailers frequently mark up or mark down the prices they charge buyers.
For retailers, the term markup means an additional markup of the original retail price. (In another context, such as the gross profit discussion on pages 450–451, we often think of markup on the basis of cost.) Markup cancellations are decreases in prices of merchandise that the retailer had marked up above the original retail price.
In a competitive market, retailers often need to use markdowns, which are decreases in the original sales prices. Such cuts in sales prices may be necessary because of a decrease in the general level of prices, special sales, soiled or damaged goods, overstocking, and market competition. Markdowns are common in retailing these days. Markdown cancellations occur when the markdowns are later offset by increases in the prices of goods that the retailer had marked down—such as after a one-day sale, for example. Neither a markup cancellation nor a markdown cancellation can exceed the original markup or markdown.
To illustrate these concepts, assume that Designer Clothing Store recently purchased 100 dress shirts from Marroway, Inc. The cost for these shirts was $1,500, or $15 a shirt. Designer Clothing established the selling price on these shirts at $30 a shirt. The shirts were selling quickly in anticipation of Father's Day, so the manager added a markup of $5 per shirt. This markup made the price too high for customers, and sales slowed. The manager then reduced the price to $32. At this point we would say that the shirts at Designer Clothing have had a markup of $5 and a markup cancellation of $3.
Right after Father's Day, the manager marked down the remaining shirts to a sale price of $23. At this point, an additional markup cancellation of $2 has taken place, and a $7 markdown has occurred. If the manager later increases the price of the shirts to $24, a markdown cancellation of $1 would occur.
Retailers use markup and markdown concepts in developing the proper inventory valuation at the end of the accounting period. To obtain the appropriate inventory figures, companies must give proper treatment to markups, markup cancellations, markdowns, and markdown cancellations.
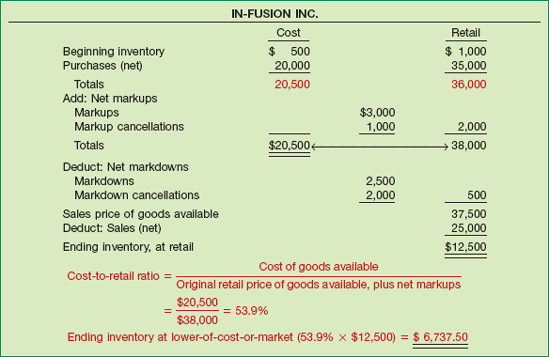
To illustrate the different possibilities, consider the data for In-Fusion Inc., shown in Illustration 9-18 (on page 454). In-Fusion can calculate its ending inventory at cost under two assumptions, A and B. (We'll explain the reasons for the two later.)
Assumption A: Computes a cost ratio after markups (and markup cancellations) but before markdowns.
Assumption B: Computes a cost ratio after both markups and markdowns (and cancellations).

The computations for In-Fusion are:
Ending inventory at retail × Cost ratio = Value of ending inventory
The question becomes: Which assumption and which percentage should In-Fusion use to compute the ending inventory valuation? The answer depends on which retail inventory method In-Fusion chooses.
One approach uses only assumption A (a cost ratio using markups but not markdowns). It approximates the lower-of-average-cost-or-market. We will refer to this approach as the conventional retail inventory method or the lower-of-cost-or-market approach.
To understand why this method considers only the markups, not the markdowns, in the cost percentage, you must understand how a retail business operates. A markup normally indicates an increase in the market value of the item. On the other hand, a markdown means a decline in the utility of that item. Therefore, to approximate the lower-of-cost-or-market, we would consider markdowns a current loss and so would not include them in calculating the cost-to-retail ratio. Omitting the markdowns would make the cost-to-retail ratio lower, which leads to an approximate lower-of-cost-or-market.
An example will make the distinction between the two methods clear: In-Fusion purchased two items for $5 apiece; the original sales price was $10 each. One item was subsequently written down to $2. Assuming no sales for the period, if markdowns are considered in the cost-to-retail ratio (assumption B—the cost method), we compute the ending inventory in the following way.

This approach (the cost method) reflects an average cost of the two items of the commodity without considering the loss on the one item. It values ending inventory at $10.
If markdowns are not considered in the cost-to-retail ratio (assumption A—the conventional retail method), we compute the ending inventory as follows.
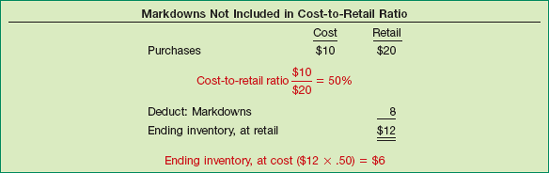
Under this approach (the conventional retail method, in which markdowns are not considered), ending inventory would be $6. The inventory valuation of $6 reflects two inventory items, one inventoried at $5 and the other at $1. It reflects the fact that In-Fusion reduced the sales price from $10 to $2, and reduced the cost from $5 to $1.[133]
To approximate the lower-of-cost-or-market, In-Fusion must establish the cost-to-retail ratio. It does this by dividing the cost of goods available for sale by the sum of the original retail price of these goods plus the net markups. This calculation excludes markdowns and markdown cancellations. Illustration 9-21 (on page 456) shows the basic format for the retail inventory method using the lower-of-cost-or-market approach along with the In-Fusion Inc. information.
Because an averaging effect occurs, an exact lower-of-cost-or-market inventory valuation is ordinarily not obtained, but an adequate approximation can be achieved. In contrast, adding net markups and deducting net markdowns yields approximate cost.
The retail inventory method becomes more complicated when we consider such items as freight-in, purchase returns and allowances, and purchase discounts. In the retail method, we treat such items as follows.
In short, the treatment for the items affecting the cost column of the retail inventory approach follows the computation for cost of goods available for sale.[134]
Note also that sales returns and allowances are considered as proper adjustments to gross sales. However, when sales are recorded gross, companies do not recognize sales discounts. To adjust for the sales discount account in such a situation would provide an ending inventory figure at retail that would be overvalued.
In addition, a number of special items require careful analysis:
Transfers-in from another department are reported in the same way as purchases from an outside enterprise.
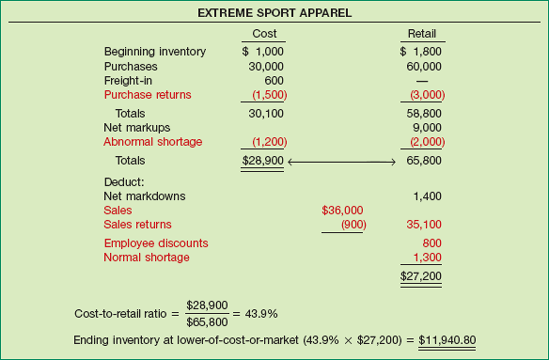
Normal shortages (breakage, damage, theft, shrinkage) should reduce the retail column because these goods are no longer available for sale. Such costs are reflected in the selling price because a certain amount of shortage is considered normal in a retail enterprise. As a result, companies do not consider this amount in computing the cost-to-retail percentage. Rather, to arrive at ending inventory at retail, they show normal shortages as a deduction similar to sales.
Abnormal shortages, on the other hand, are deducted from both the cost and retail columns and reported as a special inventory amount or as a loss. To do otherwise distorts the cost-to-retail ratio and overstates ending inventory.
Employee discounts (given to employees to encourage loyalty, better performance, and so on) are deducted from the retail column in the same way as sales. These discounts should not be considered in the cost-to-retail percentage because they do not reflect an overall change in the selling price.
Illustration 9-22 shows some of these concepts. The company, Extreme Sport Apparel, determines its inventory using the conventional retail inventory method.
Companies like Gap Inc., Circuit City, or your local department store use the retail inventory method of computing inventory for the following reasons: (1) to permit the computation of net income without a physical count of inventory, (2) as a control measure in determining inventory shortages, (3) in regulating quantities of merchandise on hand, and (4) for insurance information.
One characteristic of the retail inventory method is that it has an averaging effect on varying rates of gross profit. This can be problematic when companies apply the method to an entire business, where rates of gross profit vary among departments. There is no allowance for possible distortion of results because of such differences. Companies refine the retail method under such conditions by computing inventory separately by departments or by classes of merchandise with similar gross profits. In addition, the reliability of this method assumes that the distribution of items in inventory is similar to the "mix" in the total goods available for sale.
Accounting standards require financial statement disclosure of the composition of the inventory, inventory financing arrangements, and the inventory costing methods employed. The standards also require the consistent application of costing methods from one period to another.
Manufacturers should report the inventory composition either in the balance sheet or in a separate schedule in the notes. The relative mix of raw materials, work in process, and finished goods helps in assessing liquidity and in computing the stage of inventory completion.

Significant or unusual financing arrangements relating to inventories may require note disclosure. Examples include transactions with related parties, product financing arrangements, firm purchase commitments, involuntary liquidation of LIFO inventories, and pledging of inventories as collateral. Companies should present inventories pledged as collateral for a loan in the current assets section rather than as an offset to the liability.
A company should also report the basis on which it states inventory amounts (lower-of-cost-or-market) and the method used in determining cost (LIFO, FIFO, average cost, etc.). For example, the annual report of Mumford of Wyoming contains the following disclosures.
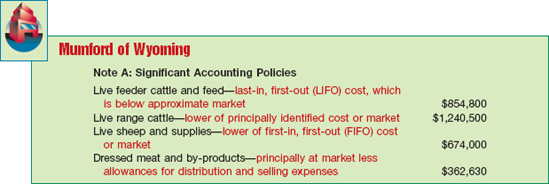
The preceding illustration shows that a company can use different pricing methods for different elements of its inventory. If Mumford changes the method of pricing any of its inventory elements, it must report a change in accounting principle. For example, if Mumford changes its method of accounting for live sheep from FIFO to average cost, it should separately report this change, along with the effect on income, in the current and prior periods. Changes in accounting principle require an explanatory paragraph in the auditor's report describing the change in method.
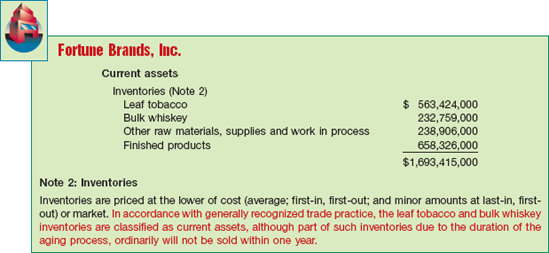
Fortune Brands, Inc. reported its inventories in its annual report as follows (note the "trade practice" followed in classifying inventories among the current assets).
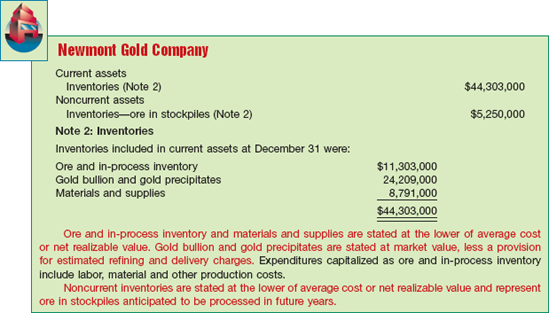
The following inventory disclosures by Newmont Gold Company reveal the use of different bases of valuation, including market value, for different classifications of inventory.
As our opening story illustrates, the amount of inventory that a company carries can have significant economic consequences. As a result, companies must manage inventories. But, inventory management is a double-edged sword. It requires constant attention. On the one hand, management wants to stock a great variety and quantity of items. Doing so will provide customers with the greatest selection. However, such an inventory policy may incur excessive carrying costs (e.g., investment, storage, insurance, taxes, obsolescence, and damage). On the other hand, low inventory levels lead to stockouts, lost sales, and disgruntled customers.
Using financial ratios helps companies to chart a middle course between these two dangers. Common ratios used in the management and evaluation of inventory levels are inventory turnover and a related measure, average days to sell the inventory.
The inventory turnover ratio measures the number of times on average a company sells the inventory during the period. It measures the liquidity of the inventory. To compute inventory turnover, divide the cost of goods sold by the average inventory on hand during the period.
Barring seasonal factors, analysts compute average inventory from beginning and ending inventory balances. For example, in its 2007 annual report Kellogg Company reported a beginning inventory of $924 million, an ending inventory of $824 million, and cost of goods sold of $6,597 million for the year. Illustration 9-26 shows the inventory turnover formula and Kellogg Company's 2007 ratio computation below.
A variant of the inventory turnover ratio is the average days to sell inventory. This measure represents the average number of days' sales for which a company has inventory on hand. For example, the inventory turnover for Kellogg Company of 7.5 times divided into 365 is approximately 49 days.
There are typical levels of inventory in every industry. However, companies that keep their inventory at lower levels with higher turnovers than those of their competitors, and that still can satisfy customer needs, are the most successful.

The major iGAAP requirements related to accounting and reporting for inventories are found in IAS 2 ("Inventories"), IAS 18 ("Revenue"), and IAS 41 ("Agriculture"). In most cases, iGAAP and U.S. GAAP are the same. The major differences are that iGAAP prohibits the use of the LIFO cost flow assumption and records market in the lower-of-cost-or-market differently.
The requirements for accounting for and reporting inventories are more principles-based under iGAAP. That is, U.S. GAAP provides more detailed guidelines in inventory accounting.
Who owns the goods—goods in transit, consigned goods, special sales agreements—as well as the costs to include in inventory are essentially accounted for the same under iGAAP and U.S. GAAP.
A major difference between iGAAP and U.S. GAAP relates to the LIFO cost flow assumption. U.S. GAAP permits the use of LIFO for inventory valuation. iGAAP prohibits its use. FIFO and average cost are the only two acceptable cost flow assumptions permitted under iGAAP. Both sets of GAAP permit specific identification where appropriate.
In the lower-of-cost-or-market test for inventory valuation, iGAAP defines market as net realizable value. U.S. GAAP, on the other hand, defines market as replacement cost subject to the constraints of net realizable value (the ceiling) and net realizable value less a normal markup (the floor). That is, iGAAP does not use a ceiling or a floor to determine market.
In U.S. GAAP, if inventory is written down under the lower-of-cost-or-market valuation, the new basis is now considered its cost. As a result, the inventory may not be written back up to its original cost in a subsequent period. Under iGAAP, the write-down may be reversed in a subsequent period up to the amount of the previous write-down. Both the write-down and any subsequent reversal should be reported on the income statement.
Unlike property, plant, and equipment, iGAAP does not permit the option of valuing inventories at fair value. As indicated above, iGAAP requires inventory to be written down, but inventory cannot be written up above its original cost.
Similar to U.S. GAAP, certain agricultural products and mineral products can be reported at net realizable value using iGAAP.
Presented below is a disclosure under iGAAP related to inventories for Nokia Corporation, which reflects application of iGAAP to its inventories.
Nokia Corporation
Notes to the Consolidated Financial Statements (in part)
Note 1. Accounting principles
Inventories
Inventories are stated at the lower of cost or net realizable value. Cost is determined using standard cost, which approximates actual cost on a FIFO basis. Net realizable value is the amount that can be realized from the sale of the inventory in the normal course of business after allowing for the costs of realization. In addition to the cost of materials and direct labor, an appropriate proportion of production overhead is included in the inventory values. An allowance is recorded for excess inventory and obsolescence based on the lower of cost or net realizable value.
Note 18. Inventories (000,000 euros)
One convergence issue that will be difficult to resolve relates to the use of the LIFO cost flow assumption. As indicated, iGAAP specifically prohibits its use. Conversely, the LIFO cost flow assumption is widely used in the United States because of its favorable tax advantages. In addition, many argue that LIFO from a financial reporting point of view provides a better matching of current costs against revenue and therefore enables companies to compute a more realistic income.
A number of retail establishments have changed from the more conventional treatment to a LIFO retail method. For example, the world's largest retailer, Wal-Mart uses the LIFO retail method. The primary reason to do so is for the tax advantages associated with valuing inventories on a LIFO basis. In addition, adoption of LIFO results in a better matching of costs and revenues.
The use of LIFO retail is made under two assumptions: (1) stable prices and (2) fluctuating prices.
It is much more complex to compute the final inventory balance using a LIFO flow than using the conventional retail method. Under the LIFO retail method, companies like Wal-Mart or Target consider both markups and markdowns in obtaining the proper cost-to-retail percentage. Furthermore, since the LIFO method is concerned only with the additional layer, or the amount that should be subtracted from the previous layer, the beginning inventory is excluded from the cost-to-retail percentage.
A major assumption of the LIFO retail method is that the markups and markdowns apply only to the goods purchased during the current period and not to the beginning inventory. This assumption is debatable and may explain why some companies do not adopt this method.
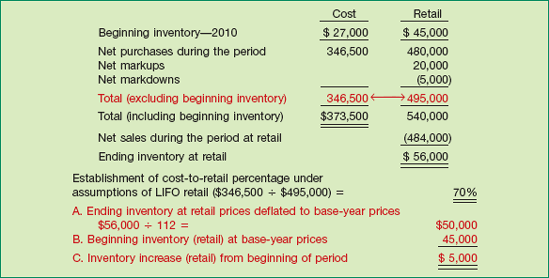
Illustration 9A-1 presents the major concepts involved in the LIFO retail method applied to the Hernandez Company. Note that, to simplify the accounting, we have assumed that the price level has remained unchanged.
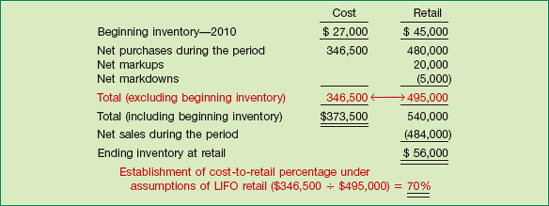
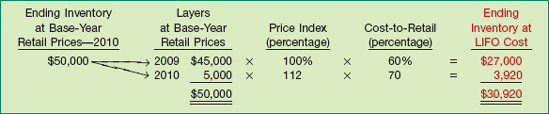
Illustration 9A-2 indicates that the inventory is composed of two layers: the beginning inventory and the additional increase that occurred in the inventory this period (2010). When we start the next period (2011), the beginning inventory will be composed of those two layers. If an increase in inventory occurs again, an additional layer will be added.
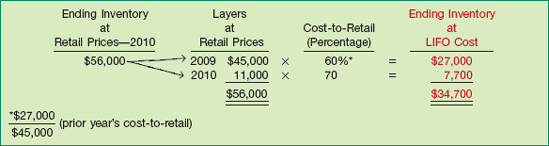
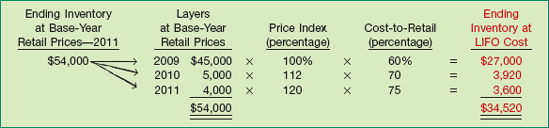
However, if the final inventory figure is below the beginning inventory, Hernandez must reduce the beginning inventory starting with the most recent layer. For example, assume that the ending inventory for 2011 at retail is $50,000. Illustration 9A-3 shows the computation of the ending inventory at cost. Notice that the 2010 layer is reduced from $11,000 to $5,000.
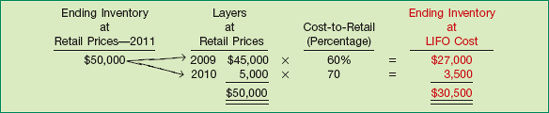
The previous example simplified the LIFO retail method by ignoring changes in the selling price of the inventory. Let us now assume that a change in the price level of the inventories occurs (as is usual). If the price level does change, the company must eliminate the price change so as to measure the real increase in inventory, not the dollar increase. This approach is referred to as the dollar-value LIFO retail method.
To illustrate, assume that the beginning inventory had a retail market value of $10,000 and the ending inventory had a retail market value of $15,000. Assume further that the price level has risen from 100 to 125. It is inappropriate to suggest that a real increase in inventory of $5,000 has occurred. Instead, the company must deflate the ending inventory at retail, as the computation in Illustration 9A-4 shows.
This approach is essentially the dollar-value LIFO method discussed in Chapter 8. In computing the LIFO inventory under a dollar-value LIFO approach, the company finds the dollar increase in inventory and deflates it to beginning-of-the-year prices. This indicates whether actual increases or decreases in quantity have occurred. If an increase in quantities occurs, the company prices this increase at the new index, in order to compute the value of the new layer. If a decrease in quantities happens, the company subtracts the increase from the most recent layers to the extent necessary.
The following computations, based on those in Illustration 9A-1 for Hernandez Company, illustrate the differences between the dollar-value LIFO retail method and the regular LIFO retail approach. Assume that the current 2010 price index is 112 (prior year = 100) and that the inventory ($56,000) has remained unchanged. In comparing Illustrations 9A-1 and 9A-5 (see page 464), note that the computations involved in finding the cost-to-retail percentage are exactly the same. However, the dollar-value method determines the increase that has occurred in the inventory in terms of base-year prices.
From this information, we compute the inventory amount at cost:
As Illustration 9A-6 shows, before the conversion to cost takes place, Hernandez must restate layers of a particular year to the prices in effect in the year when the layer was added.
Note the difference between the LIFO approach (stable prices) and the dollar-value LIFO method as indicated below.

The difference of $3,780 ($34,700 − $30,920) results from an increase in the price of goods, not from an increase in the quantity of goods.
The dollar-value LIFO retail method follows the same procedures in subsequent periods as the traditional dollar-value method discussed in Chapter 8. That is, when a real increase in inventory occurs, Hernandez adds a new layer.
To illustrate, using the data from the previous example, assume that the retail value of the 2011 ending inventory at current prices is $64,800, the 2011 price index is 120 percent of base-year, and the cost-to-retail percentage is 75 percent. In base-year dollars, the ending inventory is therefore $54,000 ($64,800/120%). Illustration 9A-8 shows the computation of the ending inventory at LIFO cost.
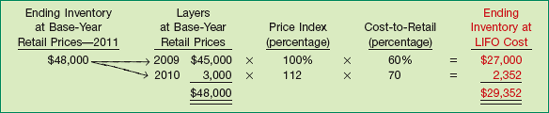
Conversely, when a real decrease in inventory develops, Hernandez "peels off" previous layers at prices in existence when the layers were added. To illustrate, assume that in 2011 the ending inventory in base-year prices is $48,000. The computation of the LIFO inventory is as follows.
The advantages and disadvantages of the lower-of-cost-or-market method (conventional retail) versus LIFO retail are the same for retail operations as for non-retail operations. As a practical matter, a company's selection of which retail inventory method to use often involves determining which method provides a lower taxable income. It might appear that retail LIFO will provide the lower taxable income in a period of rising prices. But this is not always the case. LIFO will provide an approximate current cost matching, but it states ending inventory at cost. The conventional retail method may have a large write-off because of the use of the lower-of-cost-or-market approach, which may offset the LIFO current cost matching.
Because conventional retail is a lower-of-cost-or-market approach, the company must restate beginning inventory to a cost basis when changing from the conventional retail to the LIFO method.[135] The usual approach is to compute the cost basis from the purchases of the prior year, adjusted for both markups and markdowns.[136]
To illustrate, assume that Clark Clothing Store employs the conventional retail method but wishes to change to the LIFO retail method beginning in 2010. The amounts shown by the firm's books are as follows.

Illustration 9A-10 shows computation of ending inventory under the conventional retail method for 2010.
Clark Clothing can then quickly approximate the ending inventory for 2010 under the LIFO retail method as shown in Illustration 9A-11.
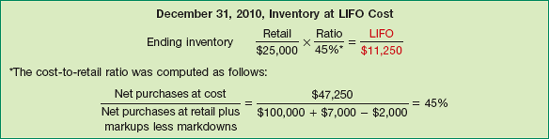
The difference of $500 ($11,250 − $10,750) between the LIFO retail method and the conventional retail method in the ending inventory for 2010 is the amount by which the company must adjust beginning inventory for 2011. The entry to adjust the inventory to a cost basis is as follows.
SUMMARY OF LEARNING OBJECTIVE FOR APPENDIX 9A

Procedures under stable prices: (a) Because the LIFO method is a cost method, both markups and markdowns must be considered in obtaining the proper cost-to-retail percentage. (b) Since the LIFO method is concerned only with the additional layer, or the amount that should be subtracted from the previous layer, the beginning inventory is excluded from the cost-to-retail percentage. (c) The markups and markdowns apply only to the goods purchased during the current period and not to the beginning inventory.
Procedures under fluctuating prices: The steps are the same as for stable prices except that in computing the LIFO inventory under a dollar-value LIFO approach, the dollar increase in inventory is found and deflated to beginning-of-the-year prices. Doing so will determine whether actual increases or decreases in quantity have occurred. If quantities increase, this increase is priced at the new index to compute the new layer. If quantities decrease, the decrease is subtracted from the most recent layers to the extent necessary.
FASB Codification References
FASB ASC 330-10-35. [Predecessor literature: "Restatement and Revision of Accounting Research Bulletins," Accounting Research Bulletin No. 43 (New York: AICPA, 1953), Ch. 4, par. 8).]
FASB ASC 330-10-35. [Predecessor literature: "Restatement and Revision of Accounting Research Bulletins," Accounting Research Bulletin No. 43 (New York: AICPA, 1953), Ch. 4.]
FASB ASC 330-10-35-16 through 18. [Predecessor literature: "Restatement and Revision of Accounting Research Bulletins," Accounting Research Bulletin No. 43 (New York: AICPA, 1953), Ch. 4, par. 16).]
Note: All asterisked Questions, Exercises, and Problems relate to material in the appendix to the chapter.
Where there is evidence that the utility of inventory goods, as part of their disposal in the ordinary course of business, will be less than cost, what is the proper accounting treatment?
Explain the rationale for the ceiling and floor in the lower-of-cost-or-market method of valuing inventories.
Why are inventories valued at the lower-of-cost-or-market? What are the arguments against the use of the LCM method of valuing inventories?
What approaches may be employed in applying the lower-of-cost-or-market procedure? Which approach is normally used and why?
In some instances accounting principles require a departure from valuing inventories at cost alone. Determine the proper unit inventory price in the following cases.
What method(s) might be used in the accounts to record a loss due to a price decline in the inventories? Discuss.
What factors might call for inventory valuation at sales prices (net realizable value or market price)?
Under what circumstances is relative sales value an appropriate basis for determining the price assigned to inventory?
At December 31, 2011, Ashley Co. has outstanding purchase commitments for purchase of 150,000 gallons, at $6.20 per gallon, of a raw material to be used in its manufacturing process. The company prices its raw material inventory at cost or market, whichever is lower. Assuming that the market price as of December 31, 2011, is $5.90, how would you treat this situation in the accounts?
What are the major uses of the gross profit method?
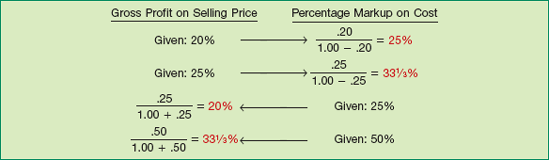
Distinguish between gross profit as a percentage of cost and gross profit as a percentage of sales price. Convert the following gross profit percentages based on cost to gross profit percentages based on sales price: 25% and 33⅓%. Convert the following gross profit percentages based on sales price to gross profit percentages based on cost: 33⅓% and 60%.
Adriana Co. with annual net sales of $5 million maintains a markup of 25% based on cost. Adriana's expenses average 15% of net sales. What is Adriana's gross profit and net profit in dollars?
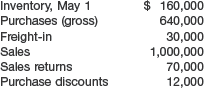
A fire destroys all of the merchandise of Assante Company on February 10, 2011. Presented below is information compiled up to the date of the fire.
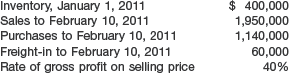
What is the approximate inventory on February 10, 2011?
What conditions must exist for the retail inventory method to provide valid results?
The conventional retail inventory method yields results that are essentially the same as those yielded by the lower-of-cost-or-market method. Explain. Prepare an illustration of how the retail inventory method reduces inventory to market.
Determine the ending inventory under the conventional retail method for the furniture department of Mayron Department Stores from the following data.
If the results of a physical inventory indicated an inventory at retail of $295,000, what inferences would you draw?
Deere and Company reported inventory in its balance sheet as follows:

What additional disclosures might be necessary to present the inventory fairly?
Of what significance is inventory turnover to a retail store?

* What modifications to the conventional retail method are necessary to approximate a LIFO retail flow?

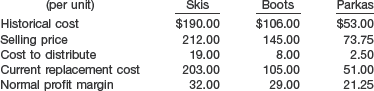
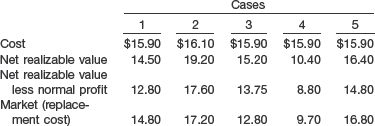
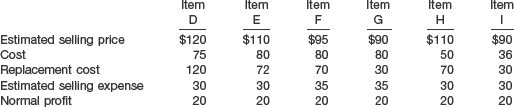
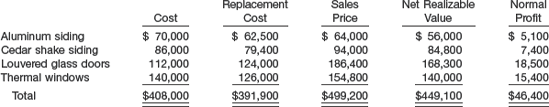
Determine the following: (a) the two limits to market value (i.e., the ceiling and the floor) that should be used in the lower-of-cost-or-market computation for skis; (b) the cost amount that should be used in the lower-of-cost-or-market comparison of boots; and (c) the market amount that should be used to value parkas on the basis of the lower-of-cost-or-market.
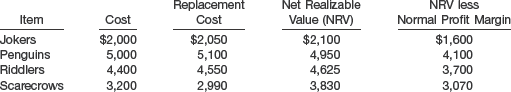
Determine the final lower-of-cost-or-market inventory value for each item.


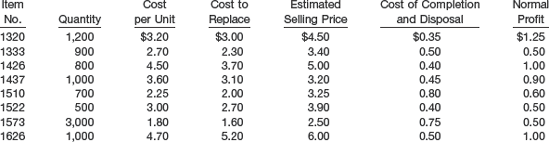
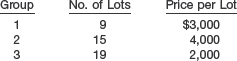
Determine the cost per CD for each group, using the relative sales value method.


Instructions
Determine the inventory as of December 31, 2011, by the lower-of-cost-or-market method, applying this method directly to each item.
Determine the inventory by the lower-of-cost-or-market method, applying the method to the total of the inventory.
Instructions
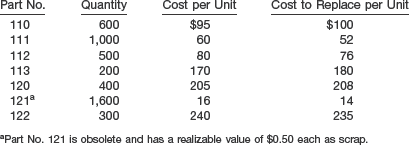
Using the lower-of-cost-or-market rule, determine the proper unit value for balance sheet reporting purposes at December 31, 2011, for each of the inventory items above.
Instructions
From the information above, determine the amount of Sedato Company inventory.
Instructions
Prepare the journal entries required at December 31, 2010, and December 31, 2011, assuming that the inventory is recorded at lower-of-cost-or-market, and a perpetual inventory system (direct method) is used.
Prepare journal entries required at December 31, 2010, and December 31, 2011, assuming that the inventory is recorded at cost and an allowance account is adjusted at each year-end under a perpetual system.
Which of the two methods above provides the higher net income in each year?
Instructions
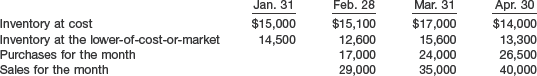
From the information, prepare (as far as the data permit) monthly income statements in columnar form for February, March, and April. The inventory is to be shown in the statement at cost, the gain or loss due to market fluctuations is to be shown separately, and a valuation account is to be set up for the difference between cost and the lower-of-cost-or-market.
Prepare the journal entry required to establish the valuation account at January 31 and entries to adjust it monthly thereafter.
There were 1,000 units of product X on hand at December 31, 2010. Product X was incorrectly valued at $38 per unit for reporting purposes. All 1,000 units were sold in 2011.
Instructions
Compute the effect of this error on net income for 2010 and the effect on net income for 2011, and indicate the direction of the misstatement for each year.
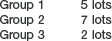
Operating expenses for the year allocated to this project total $18,200. Lots unsold at the year-end were as follows.
Instructions
At the end of the fiscal year Larsen Realty Corporation instructs you to arrive at the net income realized on this operation to date.
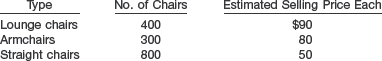
During 2011, Crawford sells 200 lounge chairs, 100 armchairs, and 120 straight chairs.
Instructions
What is the amount of gross profit realized during 2011? What is the amount of inventory of unsold straight chairs on December 31, 2011?
Instructions
What entry would you make on December 31, 2011, to recognize these facts?
Instructions
Assuming that the market price as of December 31, 2011, is $3.30, how would this matter be treated in the accounts and statements? Explain.
Assuming that the market price as of December 31, 2011, is $2.70, instead of $3.30, how would you treat this situation in the accounts and statements?
Give the entry in January 2012, when the 40,000-gallon shipment is received, assuming that the situation given in (b) above existed at December 31, 2011, and that the market price in January 2012 was $2.70 per gallon. Give an explanation of your treatment.
20%.
25%.
33⅓%.
50%.
Instructions
Indicate the gross profit percentage in terms of sales for each of the above.
Instructions
Compute the estimated inventory at May 31, assuming that the gross profit is 25% of sales.
Compute the estimated inventory at May 31, assuming that the gross profit is 25% of cost.
Instructions
Compute the cost of goods destroyed.
Compute the cost of goods destroyed, assuming that the gross profit is 33⅓% of sales.

Merchandise with a selling price of $21,000 remained undamaged after the fire. Damaged merchandise with an original selling price of $15,000 had a net realizable value of $5,300.
Instructions
Compute the amount of the loss as a result of the fire, assuming that the corporation had no insurance coverage.
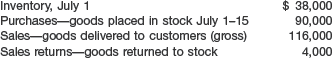
Your client reports that the goods on hand on July 16 cost $30,500, but you determine that this figure includes goods of $6,000 received on a consignment basis. Your past records show that sales are made at approximately 25% over cost. Garnett's insurance covers only goods owned.
Instructions
Compute the claim against the insurance company.
On August 18, a fire destroyed the office, lumber shed, and a considerable portion of the lumber stacked in the yard. To file a report of loss for insurance purposes, the company must know what the inventories were immediately preceding the fire. No detail or perpetual inventory records of any kind were maintained. The only pertinent information you are able to obtain are the following facts from the general ledger, which was kept in a fireproof vault and thus escaped destruction.
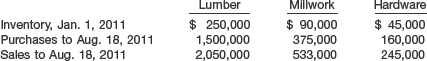
Instructions
Submit your estimate of the inventory amounts immediately preceding the fire.

Instructions
Compute the ending inventory, assuming that (a) gross profit is 40% of sales; (b) gross profit is 60% of cost; (c) gross profit is 35% of sales; and (d) gross profit is 25% of cost.
Instructions
Compute the ending inventory at retail.
Compute a cost-to-retail percentage (round to two decimals) under the following conditions.
Excluding both markups and markdowns.
Excluding markups but including markdowns.
Excluding markdowns but including markups.
Including both markdowns and markups.
Which of the methods in (b) above (1, 2, 3, or 4) does the following?
Provides the most conservative estimate of ending inventory.
Provides an approximation of lower-of-cost-or-market.
Is used in the conventional retail method.
Compute ending inventory at lower-of-cost-or-market (round to nearest dollar).
Compute cost of goods sold based on (d).
Compute gross margin based on (d).
Instructions
Compute the inventory by the conventional retail inventory method.
Instructions
Compute the ending inventory by the conventional retail inventory method.
Instructions
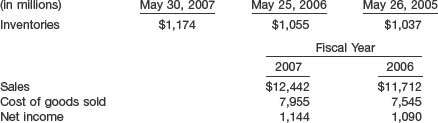
Compute General Mills's (a) inventory turnover and (b) the average days to sell inventory for 2007 and 2006.
On December 31, 2011, the store management considers adopting the LIFO retail system and desires to know how the December 31, 2011, inventory would appear under both systems. All pertinent data regarding purchases, sales, markups, and markdowns are shown below. There has been no change in the price level.
Instructions
Determine the cost of the 2011 ending inventory under both (a) the conventional retail method and (b) the LIFO retail method.
Instructions
Compute the cost of the 2011 ending inventory under both (a) the conventional retail method and (b) the LIFO retail method.
Instructions
Compute the cost of the inventory on December 31, 2010, assuming that the inventory at retail is (a) $294,300 and (b) $359,700.
Instructions
Compute the ending inventory under the dollar-value LIFO method at December 31, 2011. The cost-to-retail ratio for 2011 was 55%.
Instructions
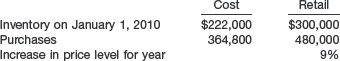
Assume Mander decided to adopt the conventional retail method. Compute the ending inventory to be reported in the balance sheet.
Assume instead that Mander decides to adopt the dollar-value LIFO retail method. The appropriate price indexes are 100 at January 1 and 110 at December 31. Compute the ending inventory to be reported in the balance sheet.
On the basis of the information in part (b), compute cost of goods sold.
The price index at January 1, 2009, is 100.
Instructions
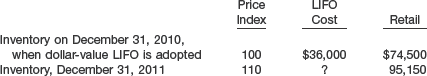
Compute the ending inventory at December 31 of the years 2009–2012. Round to the nearest dollar.
Instructions
Assuming that Mueller Ltd.'s ending inventory for 2010 under the conventional retail inventory method was $205,000, prepare the appropriate journal entry on January 1, 2011.
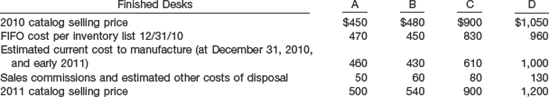
The 2010 catalog was in effect through November 2010 and the 2011 catalog is effective as of December 1, 2010. All catalog prices are net of the usual discounts. Generally, the company attempts to obtain a 20% gross margin on selling price and has usually been successful in doing so.
Instructions
At what amount should each of the four desks appear in the company's December 31, 2010, inventory, assuming that the company has adopted a lower-of-FIFO-cost-or-market approach for valuation of inventories on an individual-item basis?

Alcide assigned Patricia Devereaux, an intern from a local college, the task of calculating the amount that should appear on Garcia's May 31, 2010, financial statements for inventory under the lower-of-cost-or-market rule as applied to each item in inventory. Devereaux expressed concern over departing from the cost principle.
Instructions
Determine the proper balance in the Allowance to Reduce Inventory to Market at May 31, 2010.
For the fiscal year ended May 31, 2010, determine the amount of the gain or loss that would be recorded due to the change in the Allowance to Reduce Inventory to Market.
Explain the rationale for the use of the lower-of-cost-or-market rule as it applies to inventories.
(CMA adapted)
Instructions
Prepare the journal entries required at December 31, 2010, and at December 31, 2011, assuming that a perpetual inventory system and the direct method of adjusting to lower-of-cost-or-market is used.
Prepare the journal entries required at December 31, 2010, and at December 31, 2011, assuming that a perpetual inventory is recorded at cost and reduced to lower-of-cost-or-market through the use of an allowance account (indirect method).

Merchandise with a selling price of $30,000 remained undamaged after the fire, and damaged merchandise has a salvage value of $8,150. The company does not carry fire insurance on its inventory.
Instructions
Prepare a formal labeled schedule computing the fire loss incurred. (Do not use the retail inventory method.)
The following data and information have been gathered.
The fiscal year of the corporation ends on December 31.
An examination of the April bank statement and canceled checks revealed that checks written during the period April 1–15 totaled $13,000: $5,700 paid to accounts payable as of March 31, $3,400 for April merchandise shipments, and $3,900 paid for other expenses. Deposits during the same period amounted to $12,950, which consisted of receipts on account from customers with the exception of a $950 refund from a vendor for merchandise returned in April.
Correspondence with suppliers revealed unrecorded obligations at April 15 of $15,600 for April merchandise shipments, including $2,300 for shipments in transit (f.o.b. shipping point) on that date.
Customers acknowledged indebtedness of $46,000 at April 15, 2011. It was also estimated that customers owed another $8,000 that will never be acknowledged or recovered. Of the acknowledged indebtedness, $600 will probably be uncollectible.
The companies insuring the inventory agreed that the corporation's fire-loss claim should be based on the assumption that the overall gross profit ratio for the past 2 years was in effect during the current year. The corporation's audited financial statements disclosed this information:
Inventory with a cost of $7,000 was salvaged and sold for $3,500. The balance of the inventory was a total loss.
Instructions
Prepare a schedule computing the amount of inventory fire loss. The supporting schedule of the computation of the gross profit should be in good form.
(AICPA adapted)
Instructions
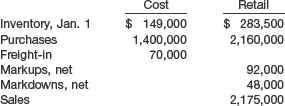
Compute the inventory for this department as of January 31, at retail prices.
Compute the ending inventory using lower-of-average-cost-or-market.

Instructions
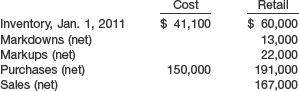
Assuming that Waveland Inc. uses the conventional retail inventory method, compute the cost of its ending inventory at December 31, 2011.
Instructions
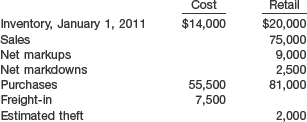
Using the conventional retail method, prepare a schedule computing estimated lower-of-cost-or-market inventory for October 31, 2011.
A department store using the conventional retail inventory method estimates the cost of its ending inventory as $60,000. An accurate physical count reveals only $47,000 of inventory at lower-of-cost-or-market. List the factors that may have caused the difference between the computed inventory and the physical count.
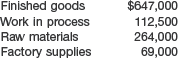
The following information relates to Maddox's inventory and operations.
The finished goods inventory consists of the items analyzed below.
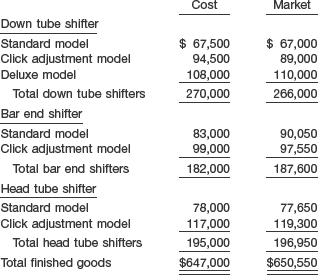
One-half of the head tube shifter finished goods inventory is held by catalog outlets on consignment.
Three-quarters of the bar end shifter finished goods inventory has been pledged as collateral for a bank loan.
One-half of the raw materials balance represents derailleurs acquired at a contracted price 20 percent above the current market price. The market value of the rest of the raw materials is $127,400.
The total market value of the work in process inventory is $108,700.
Included in the cost of factory supplies are obsolete items with an historical cost of $4,200. The market value of the remaining factory supplies is $65,900.
Maddox applies the lower-of-cost-or-market method to each of the three types of shifters in finished goods inventory. For each of the other three inventory accounts, Maddox applies the lower-of-cost-or-market method to the total of each inventory account.
Consider all amounts presented above to be material in relation to Maddox's financial statements taken as a whole.
Instructions
Prepare the inventory section of Maddox's balance sheet as of November 30, 2010, including any required note(s).
Without prejudice to your answer to (a), assume that the market value of Maddox's inventories is less than cost. Explain how this decline would be presented in Maddox's income statement for the fiscal year ended November 30, 2010.
Assume that Maddox has a firm purchase commitment for the same type of derailleur included in the raw materials inventory as of November 30, 2010, and that the purchase commitment is at a contracted price 15% greater than the current market price. These derailleurs are to be delivered to Maddox after November 30, 2010. Discuss the impact, if any, that this purchase commitment would have on Maddox's financial statements prepared for the fiscal year ended November 30, 2010.
(CMA adapted)
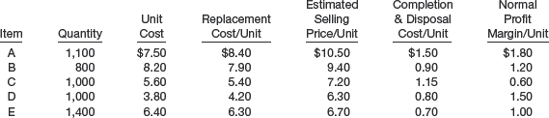
Instructions
Greg Forda is an accounting clerk in the accounting department of Fiedler Co., and he cannot understand why the market value keeps changing from replacement cost to net realizable value to something that he cannot even figure out. Greg is very confused, and he is the one who records inventory purchases and calculates ending inventory. You are the manager of the department and an accountant.
Calculate the lower-of-cost-or-market using the "individual item" approach.
Show the journal entry he will need to make in order to write down the ending inventory from cost to market.
Then write a memo to Greg explaining what designated market value is as well as how it is computed. Use your calculations to aid in your explanation.
To prepare the store's financial statements at June 30, 2010, you obtain the following data.
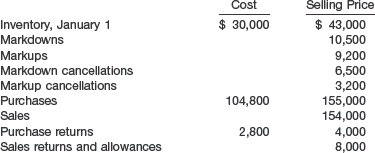
Instructions
Prepare a schedule to compute Aristotle's June 30, 2010, inventory under the conventional retail method of accounting for inventories.
Without prejudice to your solution to part (a), assume that you computed the June 30, 2010, inventory to be $59,400 at retail and the ratio of cost to retail to be 70%. The general price level has increased from 100 at January 1, 2010, to 108 at June 30, 2010. Prepare a schedule to compute the June 30, 2010, inventory at the June 30 price level under the dollar-value LIFO retail method.
(AICPA adapted)
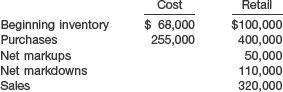
According to the November 30, 2010, physical inventory, the actual inventory at retail is $115,000.
Instructions
Describe the circumstances under which the retail inventory method would be applied and the advantages of using the retail inventory method.
Assuming that prices have been stable, calculate the value, at cost, of Becker Department Stores' ending inventory using the last-in, first-out (LIFO) retail method. Be sure to furnish supporting calculations.
Estimate the amount of shortage, at retail, that has occurred at Becker Department Stores during the year ended November 30, 2010.
Complications in the retail method can be caused by such items as (1) freight-in costs, (2) purchase returns and allowances, (3) sales returns and allowances, and (4) employee discounts. Explain how each of these four special items is handled in the retail inventory method.
(CMA adapted)
Amounts as shown below appear on the store's books before adjustment.
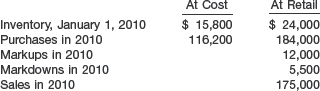
You are to assume that all markups and markdowns apply to 2010 purchases, and that it is appropriate to treat the entire inventory as a single department.
Instructions
Compute the inventory at December 31, 2010, under the following methods.
The conventional retail method.
The last-in, first-out retail method, effecting the change in method as of January 1, 2010. Assume that the cost-to-retail percentage for 2009 was recomputed correctly in accordance with procedures necessary to change to LIFO. This ratio was 59%.
(AICPA adapted)
Here is the available information.
The inventory at January 1, 2009, had a retail value of $56,000 and cost of $29,800 based on the conventional retail method.
Transactions during 2009 were as follows.

The retail value of the December 31, 2010, inventory was $75,600, the cost ratio for 2010 under the LIFO retail method was 61%, and the regional price index was 105% of the January 1, 2010, price level.
The retail value of the December 31, 2011, inventory was $62,640, the cost ratio for 2011 under the LIFO retail method was 60%, and the regional price index was 108% of the January 1, 2010, price level.
Instructions
Prepare a schedule showing the computation of the cost of inventory on hand at December 31, 2009, based on the conventional retail method.
Prepare a schedule showing the recomputation of the inventory to be reported on December 31, 2009, in accordance with procedures necessary to convert from the conventional retail method to the LIFO retail method beginning January 1, 2010. Assume that the retail value of the December 31, 2009, inventory was $60,000.
Without prejudice to your solution to part (b), assume that you computed the December 31, 2009, inventory (retail value $60,000) under the LIFO retail method at a cost of $33,300. Prepare a schedule showing the computations of the cost of the store's 2010 and 2011 year-end inventories under the dollar-value LIFO method.
(AICPA adapted)

Instructions
The financial VP asks you to answer the following questions.
What is the purpose of the lower-of-cost-or-market method?
What is meant by "market"? (Hint: Discuss the ceiling and floor constraints.)
Do you apply the lower-of-cost-or-market method to each individual item, to a category, or to the total of the inventory? Explain.
What are the potential disadvantages of the lower-of-cost-or-market method?

Instructions
Answer the following questions.
What, if any, is the ethical issue involved?
Is any stakeholder harmed if Dick Wright's preference is used?
What should Sheryl Conan do?
CA9-3 (Lower-of-Cost-or-Market) Ogala Corporation purchased a significant amount of raw materials inventory for a new product that it is manufacturing.
Ogala uses the lower-of-cost-or-market rule for these raw materials. The replacement cost of the raw materials is above the net realizable value, and both are below the original cost.
Ogala uses the average cost inventory method for these raw materials. In the last 2 years, each purchase has been at a lower price than the previous purchase, and the ending inventory quantity for each period has been higher than the beginning inventory quantity for that period.
Instructions
At which amount should Ogala's raw materials inventory be reported on the balance sheet? Why?
In general, why is the lower-of-cost-or-market rule used to report inventory?
What would have been the effect on ending inventory and cost of goods sold had Ogala used the LIFO inventory method instead of the average-cost inventory method for the raw materials? Why?
Instructions
Prepare a report to the president explaining the retail method of pricing inventories. Your report should include the following points.
Description and accounting features of the method.
The conditions that may distort the results under the method.
A comparison of the advantages of using the retail method with those of using cost methods of inventory pricing.
The accounting theory underlying the treatment of net markdowns and net markups under the method.
(AICPA adapted)
CA9-5 (Cost Determination, LCM, Retail Method) Olson Corporation, a retailer and wholesaler of national brand-name household lighting fixtures, purchases its inventories from various suppliers.
Instructions
What criteria should be used to determine which of Olson's costs are inventoriable?
Are Olson's administrative costs inventoriable? Defend your answer.
Olson uses the lower-of-cost-or-market rule for its wholesale inventories. What are the theoretical arguments for that rule?
The replacement cost of the inventories is below the net realizable value less a normal profit margin, which, in turn, is below the original cost. What amount should be used to value the inventories? Why?
Olson calculates the estimated cost of its ending inventories held for sale at retail using the conventional retail inventory method. How would Olson treat the beginning inventories and net markdowns in calculating the cost ratio used to determine its ending inventories? Why?
(AICPA adapted)
Instructions
What are the ethical issues, if any?
Is any particular stakeholder harmed by the financial vice president's decision?
What should the controller do?
*CA9-7 (Retail Inventory Method and LIFO Retail) Presented below are a number of items that may be encountered in computing the cost to retail percentage when using the conventional retail method or the LIFO retail method.
Markdowns.
Markdown cancellations.
Cost of items transferred in from other departments.
Retail value of items transferred in from other departments.
Sales discounts.
Purchases discounts (purchases recorded gross).
Estimated retail value of goods broken or stolen.
Cost of beginning inventory.
Retail value of beginning inventory.
Cost of purchases.
Retail value of purchases.
Markups.
Markup cancellations.
Employee discounts (sales recorded net).
Instructions
For each of the items listed above, indicate whether this item would be considered in the cost to retail percentage under (a) conventional retail and (b) LIFO retail.
The financial statements of P&G are presented in Appendix 5B or can be accessed at the book's companion website, www.wiley.com/college/kieso.
Instructions
How does P&G value its inventories? Which inventory costing method does P&G use as a basis for reporting its inventories?
How does P&G report its inventories in the balance sheet? In the notes to its financial statements, what three descriptions are used to classify its inventories?
What costs does P&G include in Inventory and Cost of Products Sold?
What was P&G's inventory turnover ratio in 2007? What is its gross profit percentage? Evaluate P&G's inventory turnover ratio and its gross profit percentage.
Instructions
Go to the book's companion website and use information found there to answer the following questions related to The Coca-Cola Company and PepsiCo, Inc.
What inventory costing methods are used by Coca-Cola and PepsiCo? How does each company value its inventories?
In the notes, what classifications (description) are used by Coca-Cola and PepsiCo to categorize their inventories?
Compute and compare the inventory turnover ratios and days to sell inventory for Coca-Cola and PepsiCo for 2007. Indicate why there might be a significant difference between the two companies.
Prab Robots, Inc., reported the following information regarding 2009–2010 inventory.
Prab Robots, Inc.

Notes to Consolidated Financial Statements
Note 1 (in part): Nature of Business and Significant Accounting Policies
Inventories—Inventories are stated at the lower-of-cost-or-market. Cost is determined by the last-in, first-out (LIFO) method by the parent company and by the first-in, first-out (FIFO) method by its subsidiaries.
Note 2: Inventories

Inventories are stated at the lower of cost determined by the LIFO method or market for Prab Robots, Inc. Inventories for the two wholly-owned subsidiaries, Prab Command, Inc. (U.S.) and Prab Limited (U.K.) are stated on the FIFO method which amounted to $566,000 at October 31, 2009. No inventory is stated on the FIFO method at October 31, 2010. Included in inventory stated at FIFO cost was $32,815 at October 31, 2009, of Prab Command inventory classified as an asset from discontinued operations (see Note 14). If the FIFO method had been used for the entire consolidated group, inventories after an adjustment to the lower-of-cost-or-market, would have been approximately $2,000,000 and $3,800,000 at October 31, 2010 and 2009, respectively.
Inventory has been written down to estimated net realizable value, and results of operations for 2010, 2009, and 2008 include a corresponding charge of approximately $868,000, $960,000, and $273,000, respectively, which represents the excess of LIFO cost over market.
Inventory of $294,546 and $1,468,779 at October 31, 2010 and 2009, respectively, shown on the balance sheet as a noncurrent asset represents that portion of the inventory that is not expected to be sold currently.
Reduction in inventory quantities during the years ended October 31, 2010, 2009, and 2008 resulted in liquidation of LIFO inventory quantities carried at a lower cost prevailing in prior years as compared with the cost of fiscal 2004 purchases. The effect of these reductions was to decrease the net loss by approximately $24,000, $157,000 and $90,000 at October 31, 2010, 2009, and 2008, respectively.
Instructions
Why might Prab Robots, Inc., use two different methods for valuing inventory?
Comment on why Prab Robots, Inc., might disclose how its LIFO inventories would be valued under FIFO.
Why does the LIFO liquidation reduce operating costs?
Comment on whether Prab would report more or less income if it had been on a FIFO basis for all its inventory.
Barrick Gold Corporation, with headquarters in Toronto, Canada, is the world's most profitable and largest gold mining company outside South Africa. Part of the key to Barrick's success has been due to its ability to maintain cash flow while improving production and increasing its reserves of gold-containing property. During 2004, Barrick achieved record growth in cash flow, production, and reserves.
The company maintains an aggressive policy of developing previously identified target areas that have the possibility of a large amount of gold ore, and that have not been previously developed. Barrick limits the riskiness of this development by choosing only properties that are located in politically stable regions, and by the company's use of internally generated funds, rather than debt, to finance growth.
Barrick's inventories are as follows:
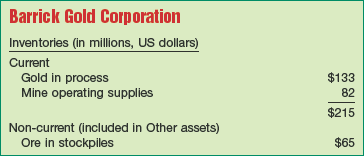
Instructions
Why do you think that there are no finished goods inventories? Why do you think the raw material, ore in stockpiles, is considered to be a non-current asset?
Consider that Barrick has no finished goods inventories. What journal entries are made to record a sale?
Suppose that gold bullion that cost $1.8 million to produce was sold for $2.4 million. The journal entry was made to record the sale, but no entry was made to remove the gold from the gold in process inventory. How would this error affect the following?
Instructions
Access the FASB Codification at http://asc.fasb.org/home to conduct research using the Codification Research System to prepare responses to the following items. Provide Codification references for your responses.
Identify the primary authoritative guidance for the accounting for inventories. What is the predecessor literature?
List three types of goods that are classified as inventory. What characteristic will automatically exclude an item from being classified as inventory?
Define "market" as used in the phrase "lower-of-cost-or-market."
Explain when it is acceptable to state inventory above cost and which industries allow this practice.
Go to the book's companion website, at www.wiley.com/college/kieso, to find an interactive problem that simulates the computerized CPA exam. The professional simulation for this chapter asks you to address questions related to inventory valuation and measurement.
Remember to check the book's companion website to find additional resources for this chapter.
[122] If a company uses dollar-value LIFO, determining the LIFO cost of an individual item may be more difficult. The company might decide that it is more appropriate to apply the lower-of-cost-or-market rule to the total amount of each pool. The AICPA Task Force on LIFO Inventory Problems concluded that the most reasonable approach to applying the lower-of-cost-or-market provisions to LIFO inventories is to base the determination on reasonable groupings of items. A pool constitutes a reasonable grouping.
[123] Inventory accounting for financial statement purposes can be different from income tax purposes. For example, companies cannot use the lower-of-cost-or-market rule with LIFO for tax purposes. However, companies may use the lower-of-cost-or-market and LIFO for financial accounting purposes.
[124] The AICPA Task Force on LIFO Inventory Problems concluded that for LIFO inventories, companies should close the allowance from the prior year and should base the allowance at the end of the year on a new lower-of-cost-or-market computation. Issues Paper (New York: AICPA, November 30, 1984), pp. 50–55.
[125] Manufacturing companies frequently employ a standardized cost system that predetermines the unit costs for material, labor, and manufacturing overhead and that values raw materials, work in process, and finished goods inventories at their standard costs. For financial reporting purposes, it is acceptable to price inventories at standard costs if there is no significant difference between the actual costs and standard costs. If there is a significant difference, companies should adjust the inventory amounts to actual cost. In Accounting Research and Terminology Bulletin, Final Edition, the profession notes that "standard costs are acceptable if adjusted at reasonable intervals to reflect current conditions." Burlington Industries and Hewlett-Packard use standard costs for valuing at least a portion of their inventories.
[126] "The Accounting Basis of Inventories," Acconting Research Study No. 13 (New York: AICPA, 1973) recommends that companies adopt net realizable value. We also should note that companies frequently fail to apply the rules of lower-of-cost-or-market in practice. For example, companies rarely compute and apply the lower limit—net realizable value less a normal markup—because it is a fairly subjective computation. In addition, companies often do not reduce inventory to market unless its disposition is expected to result in a loss. Furthermore, if the net realizable value of finished goods exceeds cost, companies usually assume that both work in process and raw materials do also. In practice, therefore, authoritative literature [2] is considered a guide, and accountants often exercise professional judgment in lieu of following the pronouncements literally.
[127] One study noted that about 30 percent of public companies have purchase commitments outstanding, with an estimated value of $725 billion ("SEC Staff Report on Off-Balance Sheet Arrangements, Special Purpose Entities, and Related Issues,") http://www.sec.gov/news/studies/soxoffbalancerpt.pdf, June 2005). Purchase commitments are popular because the buyer can secure a supply of inventory at a known price. The seller also benefits in these arrangements by knowing how much to produce.
[128] Appendix 17A provides a complete discussion of hedging and the use of derivatives such as futures.
[129] See, for example, Yuji Ijiri, Recognition of Contractual Rights and Obligations, Research Report (Stamford, Conn.: FASB, 1980), who argues that companies should capitalize firm purchase commitments. "Firm" means that it is unlikely that companies can avoid performance under the contract without a severe penalty.
Also, see Mahendra R. Gujarathi and Stanley F. Biggs, "Accounting for Purchase Commitments: Some Issues and Recommendations," Accounting Horizons (September 1988), pp. 75–78. They conclude, "Recording an asset and liability on the date of inception for the noncancelable purchase commitments is suggested as the first significant step towards alleviating the accounting problems associated with the issue. At year-end, the potential gains and losses should be treated as contingencies which provides a coherent structure for the reporting of such gains and losses."
[130] "Elements of Financial Statements," Statement of Financial Accounting Concepts No. 6 (Stamford, Conn.: FASB, 1985), pars. 251–253.
[131] An alternative method of estimating inventory using the gross profit percentage is considered by some to be less complicated than the traditional method. This alternative method uses the standard income statement format as follows. (Assume the same data as in the Cetus example above.)
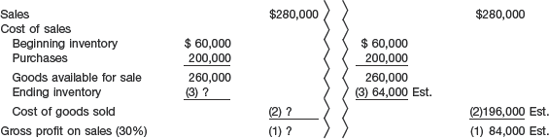
Compute the unknowns as follows: first the gross profit amount, then cost of goods sold, and finally the ending inventory, as shown below.
$280,000 × 30% = $84,000 (gross profit on sales).
$280,000 × $84,000 = $196,000 (cost of goods sold).
$260,000 × $196,000 = $64,000 (ending inventory).
[132] The terms gross margin percentage, rate of gross profit, and percentage markup are synonymous, although companies more commonly use markup in reference to cost and gross profit in reference to sales.
[133] This figure is not really market (replacement cost), but it is net realizable value less the normal margin that is allowed. In other words, the sale price of the goods written down is $2, but subtracting a normal margin of 50 percent ($5 cost, $10 price), the figure becomes $1.
[134] When the purchase allowance is not reflected by a reduction in the selling price, no adjustment is made to the retail column.
[135] Changing from the conventional retail method to LIFO retail represents a change in accounting principle. We provide an expanded discussion of accounting principle changes in Chapter 22.
[136] A logical question to ask is, "Why are only the purchases from the prior period considered and not also the beginning inventory?" Apparently the IRS believes that "the purchases-only approach" provides a more reasonable cost basis. The IRS position is debatable. However, for our purposes, it seems appropriate to use the purchases-only approach.