LEARNING OBJECTIVES
After studying this chapter, you should be able to:
"There Ought to Be a Law"
As one manager noted, "There ought to be a law that before you can buy a stock, you must be able to read a balance sheet." We agree, and the same can be said for a statement of cash flows.
Krispy Kreme Doughnuts provides an example of how stunning earnings growth can hide real problems. Not long ago the doughnut maker was a glamour stock with a 60 percent earnings per share growth rate and a price-earnings ratio around 70. Seven months later its stock price had dropped 72 percent. What happened? Stockholders alleged that Krispy Kreme may have been inflating its revenues and not taking enough bad debt expense (which inflated both assets and income). In addition, Krispy Kreme's operating cash flow was negative. Most financially sound companies throw off positive cash flow.
Following are additional examples of how one rating agency rated the earnings quality of some companies, using some key balance sheet and statement of cash flow measurements.
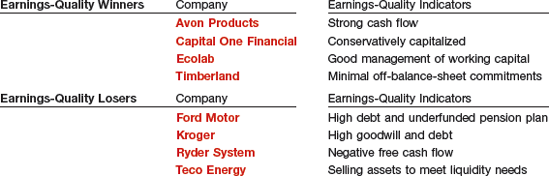
Just as a deteriorating balance sheet and statement of cash flows warn of earnings declines (and falling stock prices), improving balance sheet and cash flow information is a leading indicator of improved earnings.
Source: Adapted from Gretchen Morgenson, "How Did They Value Stocks? Count the Absurd Ways," New York Times on the Web (March 18, 2001), and from K. Badanhausen, J. Gage, C. Hall, and M. Ozanian, "Beyond Balance Sheet: Earnings Quality," Forbes.com (January 28, 2005).
PREVIEW OF CHAPTER 5
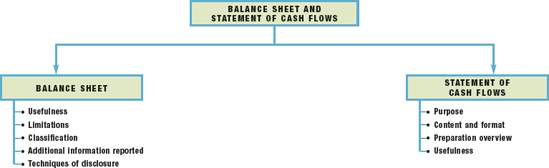
Readers of the financial statements sometimes ignore important information in the balance sheet and statement of cash flows. As our opening story shows, analyzing these financial statements helps investors avoid surprises in earnings. In this chapter we examine the many different types of assets, liabilities, and stockholders' equity items that affect the balance sheet and the statement of cash flows. The content and organization of the chapter are as follows.
The balance sheet, sometimes referred to as the statement of financial position, reports the assets, liabilities, and stockholders' equity of a business enterprise at a specific date. This financial statement provides information about the nature and amounts of investments in enterprise resources, obligations to creditors, and the owners' equity in net resources.[60] It therefore helps in predicting the amounts, timing, and uncertainty of future cash flows.
By providing information on assets, liabilities, and stockholders' equity, the balance sheet provides a basis for computing rates of return and evaluating the capital structure of the enterprise. As our opening story indicates, analysts also use information in the balance sheet to assess a company's risk[61] and future cash flows. In this regard, analysts use the balance sheet to assess a company's liquidity, solvency, and financial flexibility.

Liquidity describes "the amount of time that is expected to elapse until an asset is realized or otherwise converted into cash or until a liability has to be paid."[62] Creditors are interested in short-term liquidity ratios, such as the ratio of cash (or near cash) to short-term liabilities. These ratios indicate whether a company, like Amazon, will have the resources to pay its current and maturing obligations. Similarly, stockholders assess liquidity to evaluate the possibility of future cash dividends or the buyback of shares. In general, the greater Amazon's liquidity, the lower its risk of failure.
The terrorist attacks of September 11, 2001, showed how vulnerable the major airlines are to falling demand for their services. Since that infamous date, major airlines have reduced capacity and slashed jobs to avoid bankruptcy. United Airlines, Northwest Airlines, US Airways, and several smaller competitors filed for bankruptcy in the wake of 9/11.
Delta Airlines made the following statements in its annual report issued shortly after 9/11:
"If we are unsuccessful in further reducing our operating costs ... we will need to restructure our costs under Chapter 11 of the U.S. Bankruptcy Code.... We have substantial liquidity needs and there is no assurance that we will be able to obtain the necessary financing to meet those needs on acceptable terms, if at all."
The financial distress related to the airline industry was not an insider's secret. The airlines' balance sheets clearly revealed their financial inflexibility and low liquidity even before September 11. For example, major airlines such as Braniff, Continental, Eastern, Midway, and America West declared bankruptcy before September 11.
These financial flexibility challenges have continued, exacerbated by ever-increasing fuel prices and labor costs. Not surprisingly, several of the major airlines (Delta, Northwest, Continental, United) have been exploring mergers as a way to build some competitive synergies and to bolster their financial flexibility.
Solvency refers to the ability of a company to pay its debts as they mature. For example, when a company carries a high level of long-term debt relative to assets, it has lower solvency than a similar company with a low level of long-term debt. Companies with higher debt are relatively more risky because they will need more of their assets to meet their fixed obligations (interest and principal payments).
Liquidity and solvency affect a company's financial flexibility, which measures the "ability of an enterprise to take effective actions to alter the amounts and timing of cash flows so it can respond to unexpected needs and opportunities."[63] For example, a company may become so loaded with debt—so financially inflexible—that it has little or no sources of cash to finance expansion or to pay off maturing debt. A company with a high degree of financial flexibility is better able to survive bad times, to recover from unexpected setbacks, and to take advantage of profitable and unexpected investment opportunities. Generally, the greater an enterprise's financial flexibility, the lower its risk of failure.
Some of the major limitations of the balance sheet are:
Most assets and liabilities are reported at historical cost. As a result, the information provided in the balance sheet is often criticized for not reporting a more relevant fair value. For example, Georgia-Pacific owns timber and other assets that may appreciate in value after purchase. Yet, Georgia-Pacific reports any increase only if and when it sells the assets.
Companies use judgments and estimates to determine many of the items reported in the balance sheet. For example, in its balance sheet, Dell estimates the amount of receivables that it will collect, the useful life of its warehouses, and the number of computers that will be returned under warranty.
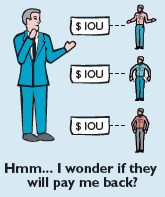
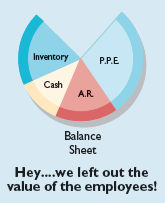
The balance sheet necessarily omits many items that are of financial value but that a company cannot record objectively. For example, the knowledge and skill of Intel employees in developing new computer chips are arguably the company's most significant asset. However, because Intel cannot reliably measure the value of its employees and other intangible assets (such as customer base, research superiority, and reputation), it does not recognize these items in the balance sheet. Similarly, many liabilities are reported in an "off-balance-sheet" manner, if at all.
The recent bankruptcy of Enron, the seventh-largest U.S. company at the time, highlights the omission of important items in the balance sheet. In Enron's case, it failed to disclose certain off-balance-sheet financing obligations in its main financial statements.[64]
Balance sheet accounts are classified. That is, balance sheets group together similar items to arrive at significant subtotals. Furthermore, the material is arranged so that important relationships are shown.
The FASB has often noted that the parts and subsections of financial statements can be more informative than the whole. Therefore, the FASB discourages the reporting of summary accounts alone (total assets, net assets, total liabilities, etc.). Instead, companies should report and classify individual items in sufficient detail to permit users to assess the amounts, timing, and uncertainty of future cash flows. Such classification also makes it easier for users to evaluate the company's liquidity and financial flexibility, profitability, and risk.
To classify items in financial statements, companies group those items with similar characteristics and separate items with different characteristics.[65] For example, companies should report separately:
Assets that differ in their type or expected function in the company's central operations or other activities. For example, IBM reports merchandise inventories separately from property, plant, and equipment.
Assets and liabilities with different implications for the company's financial flexibility. For example, a company that uses assets in its operations, like Walgreens, should report those assets separately from assets held for investment and assets subject to restrictions, such as leased equipment.
Assets and liabilities with different general liquidity characteristics. For example, Boeing Company reports cash separately from inventories.
The three general classes of items included in the balance sheet are assets, liabilities, and equity. We defined them in Chapter 2 as follows.
Companies then further divide these items into several subclassifications. Illustration 5-1 indicates the general format of balance sheet presentation.

A company may classify the balance sheet in some other manner, but in practice you usually see little departure from these major subdivisions. A proprietorship or partnership does present the classifications within the owners' equity section a little differently, as we will show later in the chapter.
Current assets are cash and other assets a company expects to convert into cash, sell, or consume either in one year or in the operating cycle, whichever is longer. The operating cycle is the average time between when a company acquires materials and supplies and when it receives cash for sales of the product (for which it acquired the materials and supplies). The cycle operates from cash through inventory, production, receivables, and back to cash. When several operating cycles occur within one year (which is generally the case for service companies), a company uses the one-year period. If the operating cycle is more than one year, a company uses the longer period.
Current assets are presented in the balance sheet in order of liquidity. The five major items found in the current assets section, and their bases of valuation, are shown in Illustration 5-2.

A company does not report these five items as current assets if it does not expect to realize them in one year or in the operating cycle, whichever is longer. For example, a company excludes from the current assets section cash restricted for purposes other than payment of current obligations or for use in current operations. Generally, if a company expects to convert an asset into cash or to use it to pay a current liability within a year or the operating cycle, whichever is longer, it classifies the asset as current.
This rule, however, is subject to interpretation. A company classifies an investment in common stock as either a current asset or a noncurrent asset depending on management's intent. When it has small holdings of common stocks or bonds that it will hold long-term, it should not classify them as current.
Although a current asset is well defined, certain theoretical problems also develop. For example, how is including prepaid expenses in the current assets section justified? The rationale is that if a company did not pay these items in advance, it would instead need to use other current assets during the operating cycle. If we follow this logic to its ultimate conclusion, however, any asset previously purchased saves the use of current assets during the operating cycle and would be considered current.
Another problem occurs in the current-asset definition when a company consumes plant assets during the operating cycle. Conceptually, it seems that a company should place in the current assets section an amount equal to the current depreciation charge on the plant assets, because it will consume them in the next operating cycle. However, this conceptual problem is ignored. This example illustrates that the formal distinction made between some current and noncurrent assets is somewhat arbitrary.
Cash is generally considered to consist of currency and demand deposits (monies available on demand at a financial institution). Cash equivalents are short-term highly liquid investments that will mature within three months or less. Most companies use the caption "Cash and cash equivalents," and they indicate that this amount approximates fair value.
A company must disclose any restrictions or commitments related to the availability of cash. As an example, see the excerpt from the annual report of Alterra Healthcare Corp. in Illustration 5-3 on the next page.

Alterra Healthcare restricted cash to meet an obligation due currently. Therefore, Alterra included this restricted cash under current assets.
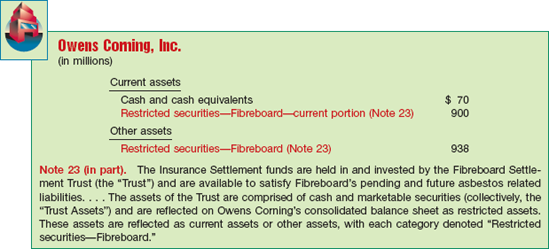
If a company restricts cash for purposes other than current obligations, it excludes the cash from current assets. Illustration 5-4 shows an example of this, from the annual report of Owens Corning, Inc.
Companies group investments in debt and equity securities into three separate portfolios for valuation and reporting purposes:
Held-to-maturity: Debt securities that a company has the positive intent and ability to hold to maturity.
Trading: Debt and equity securities bought and held primarily for sale in the near term to generate income on short-term price differences.
Available-for-sale: Debt and equity securities not classified as held-to-maturity or trading securities.
A company should report trading securities (whether debt or equity) as current assets. It classifies individual held-to-maturity and available-for-sale securities as current or noncurrent depending on the circumstances. It should report held-to-maturity securities at amortized cost. All trading and available-for-sale securities are reported at fair value. [1][67]
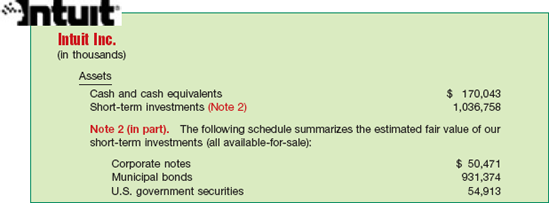
For example, see Illustration 5-5 on the next page, which is an excerpt from the annual report of Intuit Inc. with respect to its available-for-sale investments.
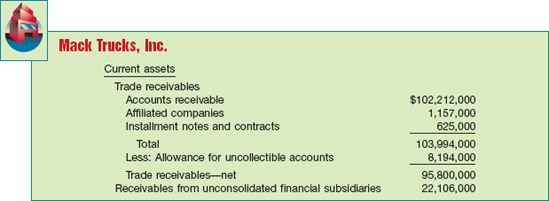
A company should clearly identify any anticipated loss due to uncollectibles, the amount and nature of any nontrade receivables, and any receivables used as collateral. Major categories of receivables should be shown in the balance sheet or the related notes. For receivables arising from unusual transactions (such as sale of property, or a loan to affiliates or employees), companies should separately classify these as long-term, unless collection is expected within one year. Mack Trucks, Inc. reported its receivables as shown in Illustration 5-6.
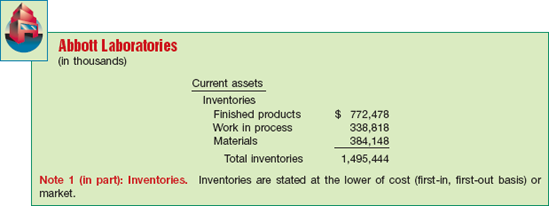
To present inventories properly, a company discloses the basis of valuation (e.g., lower-of-cost-or-market) and the cost flow assumption used (e.g., FIFO or LIFO). A manufacturing concern (like Abbott Laboratories, shown in Illustration 5-7) also indicates the stage of completion of the inventories.
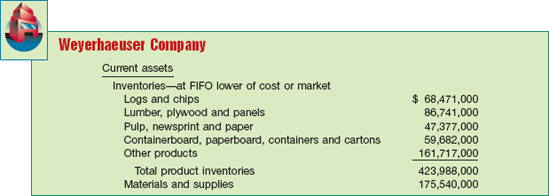
Weyerhaeuser Company, a forestry company and lumber manufacturer with several finished-goods product lines, reported its inventory as shown in Illustration 5-8.
A company includes prepaid expenses in current assets if it will receive benefits (usually services) within one year or the operating cycle, whichever is longer.[68] As we discussed earlier, these items are current assets because if they had not already been paid, they would require the use of cash during the next year or the operating cycle. A company reports prepaid expenses at the amount of the unexpired or unconsumed cost.
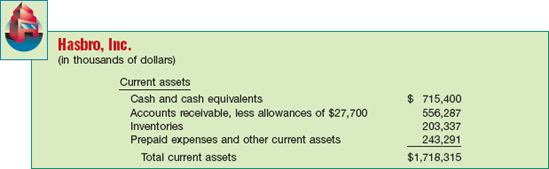
A common example is the prepayment for an insurance policy. A company classifies it as a prepaid expense because the payment precedes the receipt of the benefit of coverage. Other common prepaid expenses include prepaid rent, advertising, taxes, and office or operating supplies. Hasbro, Inc., for example, listed its prepaid expenses in current assets as shown in Illustration 5-9.
Noncurrent assets are those not meeting the definition of current assets. They include a variety of items, as we discuss in the following sections.
Long-term investments, often referred to simply as investments, normally consist of one of four types:
Investments in securities, such as bonds, common stock, or long-term notes.
Investments in tangible fixed assets not currently used in operations, such as land held for speculation.
Investments set aside in special funds such as a sinking fund, pension fund, or plant expansion fund. This includes the cash surrender value of life insurance.
Investments in nonconsolidated subsidiaries or affiliated companies.
Companies expect to hold long-term investments for many years. They usually present them on the balance sheet just below "Current assets," in a separate section called "Investments." Realize that many securities classified as long-term investments are, in fact, readily marketable. But a company does not include them as current assets unless it intends to convert them to cash in the short-term—that is, within a year or in the operating cycle, whichever is longer. As indicated earlier, securities classified as available-for-sale are reported at fair value, and held-to-maturity securities are reported at amortized cost.
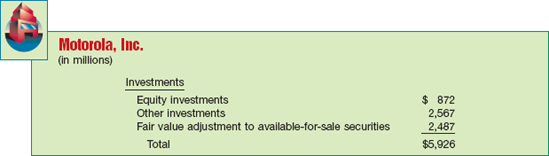
Motorola, Inc. reported its investments section, located between "Property, plant, and equipment" and "Other assets," as shown in Illustration 5-10.
Property, plant, and equipment are tangible long-lived assets used in the regular operations of the business. These assets consist of physical property such as land, buildings, machinery, furniture, tools, and wasting resources (timberland, minerals). With the exception of land, a company either depreciates (e.g., buildings) or depletes (e.g., timberlands or oil reserves) these assets.
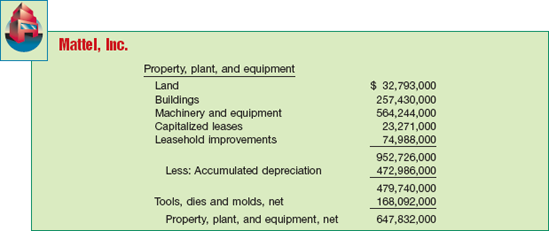
Mattel, Inc. presented its property, plant, and equipment in its balance sheet as shown in Illustration 5-11.
A company discloses the basis it uses to value property, plant, and equipment; any liens against the properties; and accumulated depreciation—usually in the notes to the statements.
Intangible assets lack physical substance and are not financial instruments (see definition on page 193). They include patents, copyrights, franchises, goodwill, trademarks, trade names, and customer lists. A company writes off (amortizes) limited-life intangible assets over their useful lives. It periodically assesses indefinite-life intangibles (such as goodwill) for impairment. Intangibles can represent significant economic resources, yet financial analysts often ignore them, because valuation is difficult.
PepsiCo, Inc. reported intangible assets in its balance sheet as shown in Illustration 5-12.

The items included in the section "Other assets" vary widely in practice. Some include items such as long-term prepaid expenses, prepaid pension cost, and noncurrent receivables. Other items that might be included are assets in special funds, deferred income taxes, property held for sale, and restricted cash or securities. A company should limit this section to include only unusual items sufficiently different from assets included in specific categories.
Similar to assets, companies classify liabilities as current or long-term.
Current liabilities are the obligations that a company reasonably expects to liquidate either through the use of current assets or the creation of other current liabilities. This concept includes:
Payables resulting from the acquisition of goods and services: accounts payable, wages payable, taxes payable, and so on.
Collections received in advance for the delivery of goods or performance of services, such as unearned rent revenue or unearned subscriptions revenue.
Other liabilities whose liquidation will take place within the operating cycle, such as the portion of long-term bonds to be paid in the current period or short-term obligations arising from purchase of equipment.
At times, a liability that is payable within the next year is not included in the current liabilities section. This occurs either when the company expects to refinance the debt through another long-term issue [3] or to retire the debt out of noncurrent assets. This approach is used because liquidation does not result from the use of current assets or the creation of other current liabilities.
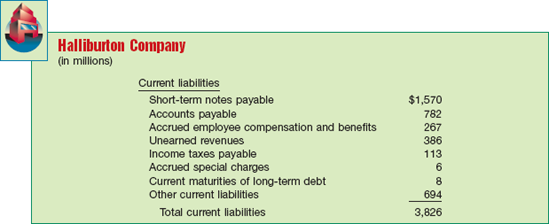
Companies do not report current liabilities in any consistent order. In general, though, companies most commonly list notes payable, accounts payable, or short-term debt as the first item. Income taxes payable, current maturities of long-term debt, or other current liabilities are commonly listed last. For example, see Halliburton Company's current liabilities section in Illustration 5-13 on the next page.
Current liabilities include such items as trade and nontrade notes and accounts payable, advances received from customers, and current maturities of long-term debt. If the amounts are material, companies classify income taxes and other accrued items separately. A company should fully describe in the notes any information about a secured liability—for example, stock held as collateral on notes payable—to identify the assets providing the security.
The excess of total current assets over total current liabilities is referred to as working capital (or sometimes net working capital). Working capital represents the net amount of a company's relatively liquid resources. That is, it is the liquidity buffer available to meet the financial demands of the operating cycle.
Companies seldom disclose on the balance sheet an amount for working capital. But bankers and other creditors compute it as an indicator of the short-run liquidity of a company. To determine the actual liquidity and availability of working capital to meet current obligations, however, requires analysis of the composition of the current assets and their nearness to cash.
Before the dot-com bubble burst, concerns about liquidity and solvency led creditors of many dotcom companies to demand more assurances that these companies could pay their bills when due. A key indicator for creditors is the amount of working capital. For example, when a report predicted that Amazon.com's working capital would turn negative, the company's vendors began to explore steps that would ensure that Amazon would pay them.
Some vendors demanded that their dot-com customers sign notes stating that the goods shipped to them would serve as collateral for the transaction. Other vendors began shipping goods on consignment—an arrangement whereby the vendor retains ownership of the goods until a third party buys and pays for them.
Another recent bubble in the real estate market created a working capital and liquidity crisis for no less a revered financial institution than Bear Stearns. What happened? Bear Stearns was one of the biggest investors in mortgage-backed securities. But when the housing market cooled off and the value of the collateral backing Bear Stearns's mortgage securities dropped dramatically, the market began to question Bear's ability to meet its obligations. The result: The Federal Reserve stepped in to avert a collapse of the company, backing a bailout plan that guaranteed $30 billion of Bear Stearns's investments. This paved the way for a buy-out by J.P. Morgan Chase at $2 per share (later amended to $10 a share)—quite a bargain since Bear Stearns had been trading above $80 a share just a month earlier.
Source: Robin Sidel, Greg Ip, Michael M. Phillips, and Kate Kelly, "The Week That Shook Wall Street: Inside the Demise of Bear Stearns," Wall Street Journal (March 18, 2008), p. A1.
Long-term liabilities are obligations that a company does not reasonably expect to liquidate within the normal operating cycle. Instead, it expects to pay them at some date beyond that time. The most common examples are bonds payable, notes payable, some deferred income tax amounts, lease obligations, and pension obligations. Companies classify long-term liabilities that mature within the current operating cycle as current liabilities if payment of the obligation requires the use of current assets.
Generally, long-term liabilities are of three types:
Obligations arising from specific financing situations, such as the issuance of bonds, long-term lease obligations, and long-term notes payable.
Obligations arising from the ordinary operations of the company, such as pension obligations and deferred income tax liabilities.
Obligations that depend on the occurrence or non-occurrence of one or more future events to confirm the amount payable, or the payee, or the date payable, such as service or product warranties and other contingencies.
Companies generally provide a great deal of supplementary disclosure for long-term liabilities, because most long-term debt is subject to various covenants and restrictions for the protection of lenders.[69]
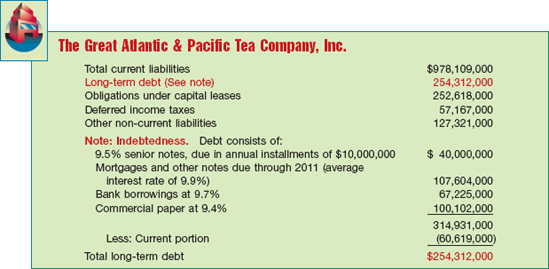
It is desirable to report any premium or discount separately as an addition to or subtraction from the bonds payable. Companies frequently describe the terms of all long-term liability agreements (including maturity date or dates, rates of interest, nature of obligation, and any security pledged to support the debt) in notes to the financial statements. Illustration 5-14 provides an example of this, taken from an excerpt from The Great Atlantic & Pacific Tea Company's financials.
The owners' equity (stockholders' equity) section is one of the most difficult sections to prepare and understand. This is due to the complexity of capital stock agreements and the various restrictions on stockholders' equity imposed by state corporation laws, liability agreements, and boards of directors. Companies usually divide the section into three parts:
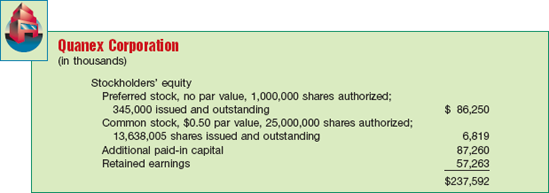
For capital stock, companies must disclose the par value and the authorized, issued, and outstanding share amounts. A company usually presents the additional paid-in capital in one amount, although subtotals are informative if the sources of additional capital are varied and material. The retained earnings amount may be divided between the unappropriated (the amount that is usually available for dividend distribution) and restricted (e.g., by bond indentures or other loan agreements) amounts. In addition, companies show any capital stock reacquired (treasury stock) as a reduction of stockholders' equity.
Illustration 5-15 presents an example of the stockholders' equity section from Quanex Corporation.
The ownership or stockholders' equity accounts in a corporation differ considerably from those in a partnership or proprietorship. Partners show separately their permanent capital accounts and the balance in their temporary accounts (drawing accounts). Proprietorships ordinarily use a single capital account that handles all of the owner's equity transactions.
One common arrangement that companies use in presenting a classified balance sheet is the account form. It lists assets, by sections, on the left side, and liabilities and stockholders' equity, by sections, on the right side. The main disadvantage is the need for a sufficiently wide space in which to present the items side by side. Often, the account form requires two facing pages.
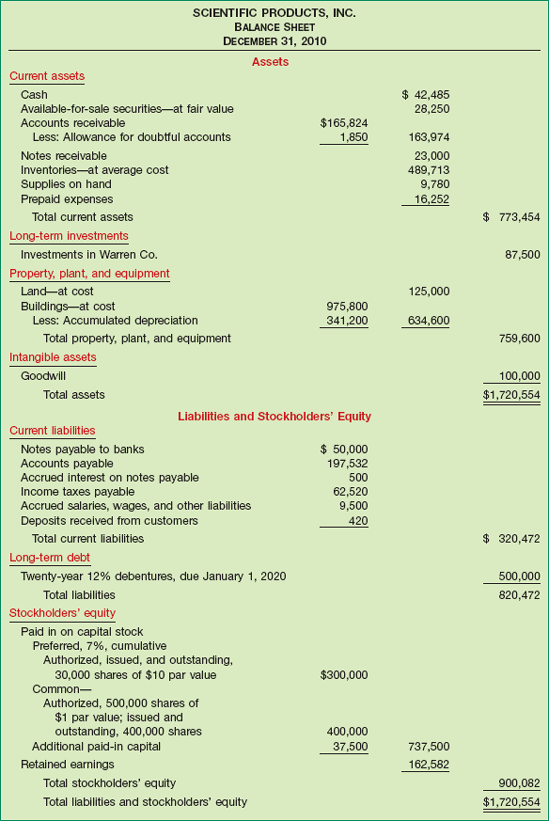
To avoid this disadvantage, the report form lists the sections one above the other, on the same page. See, for example, Illustration 5-16, which lists assets, followed by liabilities and stockholders' equity directly below, on the same page.[70]

The presentation of balance sheet information meets one of the objectives of financial reporting—to provide information about enterprise resources, claims to resources, and changes in them.
Infrequently, companies use other balance sheet formats. For example, companies sometimes deduct current liabilities from current assets to arrive at working capital. Or, they deduct all liabilities from all assets.
Analysts use balance sheet information in models designed to predict financial distress. Researcher E. I. Altman pioneered a bankruptcy-prediction model that derives a "Z-score" by combining balance sheet and income measures in the following equation.
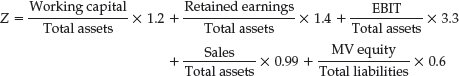
Following extensive testing, Altman found that companies with Z-scores above 3.0 are unlikely to fail. Those with Z-scores below 1.81 are very likely to fail.
Altman developed the original model for publicly held manufacturing companies. He and others have modified the model to apply to companies in various industries, emerging companies, and companies not traded in public markets.
At one time, the use of Z-scores was virtually unheard of among practicing accountants. Today, auditors, management consultants, and courts of law use this measure to help evaluate the overall financial position and trends of a firm. In addition, banks use Z-scores for loan evaluation. While a low score does not guarantee bankruptcy, the model has been proven accurate in many situations.
Source: Adapted from E. I. Altman and E. Hotchkiss, Corporate Financial Distress and Bankruptcy, 3rd edition (New York: John Wiley and Sons, 2005).

The balance sheet is not complete if a company simply lists the assets, liabilities, and owners' equity accounts. It still needs to provide important supplemental information. This may be information not presented elsewhere in the statement, or it may elaborate on items in the balance sheet. There are normally four types of information that are supplemental to account titles and amounts presented in the balance sheet. They are listed below.
The basis for including additional information should meet the full disclosure principle. That is, the information should be of sufficient importance to influence the judgment of an informed user.
A contingency is an existing situation involving uncertainty as to possible gain (gain contingency) or loss (loss contingency) that will ultimately be resolved when one or more future events occur or fail to occur. In short, contingencies are material events with an uncertain future. Examples of gain contingencies are tax operating-loss carryforwards or company litigation against another party. Typical loss contingencies relate to litigation, environmental issues, possible tax assessments, or government investigations. We examine the accounting and reporting requirements involving contingencies more fully in Chapter 13.
GAAP recommends disclosure for all significant accounting principles and methods that involve selection from among alternatives or those that are peculiar to a given industry. [5] For instance, companies can compute inventories under several cost flow assumptions (e.g., LIFO and FIFO), depreciate plant and equipment under several accepted methods (e.g., double-declining balance and straight-line), and carry investments at different valuations (e.g., cost, equity, and fair value). Sophisticated users of financial statements know of these possibilities and examine the statements closely to determine the methods used.
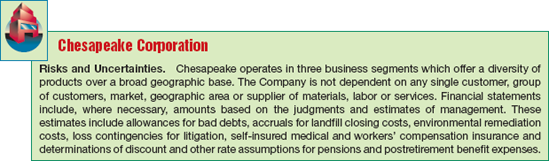
Companies must also disclose information about the nature of their operations, the use of estimates in preparing financial statements, certain significant estimates, and vulnerabilities due to certain concentrations. [6] Illustration 5-17 shows an example of such a disclosure.
Disclosure of significant accounting principles and methods and of risks and uncertainties is particularly useful if given in a separate Summary of Significant Accounting Policies preceding the notes to the financial statements or as the initial note.
Companies should disclose contractual situations, if significant, in the notes to the financial statements. For example, they must clearly state the essential provisions of lease contracts, pension obligations, and stock option plans in the notes. Analysts want to know not only the amount of the liabilities, but also how the different contractual provisions affect the company at present and in the future.
Companies must disclose the following commitments if the amounts are material: commitments related to obligations to maintain working capital, to limit the payment of dividends, to restrict the use of assets, and to require the maintenance of certain financial ratios. Management must exercise considerable judgment to determine whether omission of such information is misleading. The rule in this situation is, "When in doubt, disclose." It is better to disclose a little too much information than not enough.
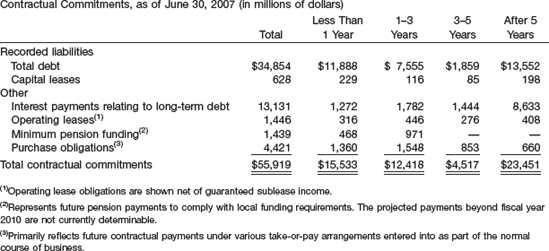
Many of the recent accounting scandals related to the nondisclosure of significant contractual obligations. In response, the SEC has mandated that companies disclose contractual obligations in a tabular summary in the management discussion and analysis section of the company's annual report.
Presented below, as an example, is a disclosure from The Procter & Gamble Company.
As we have discussed, fair value information may be more useful than historical cost for certain types of assets and liabilities. This is particularly so in the case of financial instruments. Financial instruments are defined as cash, an ownership interest, or a contractual right to receive or obligation to deliver cash or another financial instrument. Such contractual rights to receive cash or other financial instruments are assets. Contractual obligations to pay are liabilities. Cash, investments, accounts receivable, and payables are examples of financial instruments.
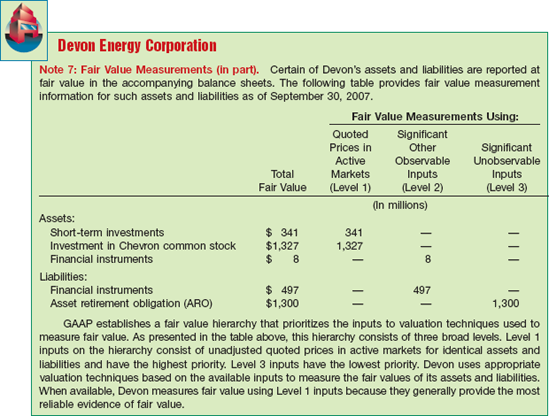
Given the expanded use of fair value measurements, as discussed in Chapter 2, GAAP also has expanded disclosures about fair value measurements. [7] To increase consistency and comparability in the use of fair value measures, companies follow a fair value hierarchy that provides insight into how to determine fair value. The hierarchy has three levels. Level 1 measures (the most reliable) are based on observable inputs, such as market prices for identical assets or liabilities. Level 2 measures (less reliable) are based on market-based inputs other than those included in Level 1, such as those based on market prices for similar assets or liabilities. Level 3 measures (least reliable) are based on unobservable inputs, such as a company's own data or assumptions.[71]
For major groups of assets and liabilities, companies must make the following fair value disclosures: (1) the fair value measurement and (2) the fair value hierarchy level of the measurements as a whole, classified by Level 1, 2, or 3. Illustration 5-18 (page 194) provides a disclosure for Devon Energy for its assets and liabilities measured at fair value.
In addition, companies must provide significant additional disclosure related to Level 3 measurements. The disclosures related to Level 3 are substantial and must identify what assumptions the company used to generate the fair value numbers and any related income effects. Companies will want to use Level 1 and 2 measurements as much as possible. In most cases, these valuations should be very reliable, as the fair value measurements are based on market information. In contrast, a company that uses Level 3 measurements extensively must be carefully evaluated to understand the impact these valuations have on the financial statements.
Companies should disclose as completely as possible the effect of various contingencies on financial condition, the methods of valuing assets and liabilities, and the company's contracts and agreements. To disclose this pertinent information, companies may use parenthetical explanations, notes, cross reference and contra items, and supporting schedules.
Companies often provide additional information by parenthetical explanations following the item. For example, Illustration 5-19 shows a parenthetical explanation of the number of shares issued by Ford Motor Company on the balance sheet under "Stockholders' equity."

The user-specific quality of understandability requires accountants to be careful in describing transactions and events.
This additional pertinent balance sheet information adds clarity and completeness. It has an advantage over a note because it brings the additional information into the body of the statement where readers will less likely overlook it. Companies, however, should avoid lengthy parenthetical explanations, which might be distracting.
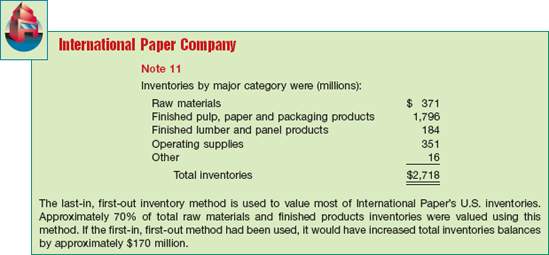
Companies use notes if they cannot conveniently show additional explanations as parenthetical explanations. Illustration 5-20 shows how International Paper Company reported its inventory costing methods in its accompanying notes.
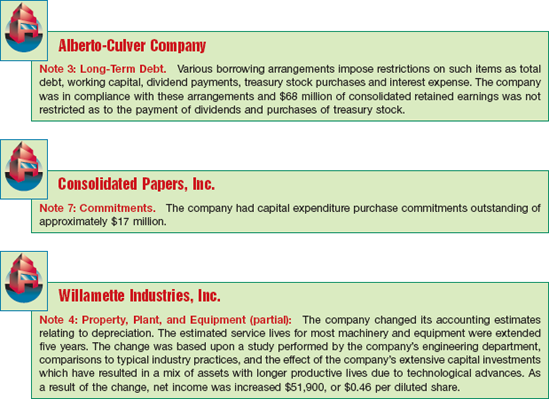
Companies commonly use notes to disclose the following: the existence and amount of any preferred stock dividends in arrears, the terms of or obligations imposed by purchase commitments, special financial arrangements and instruments, depreciation policies, any changes in the application of accounting principles, and the existence of contingencies.
Notes therefore must present all essential facts as completely and succinctly as possible. Careless wording may mislead rather than aid readers. Notes should add to the total information made available in the financial statements, not raise unanswered questions or contradict other portions of the statements. The following notes illustrate the presentation of such information.
Companies "cross-reference" a direct relationship between an asset and a liability on the balance sheet. For example, as shown in Illustration 5-22, on December 31, 2010, a company might show the following entries—one listed among the current assets, and the other listed among the current liabilities.
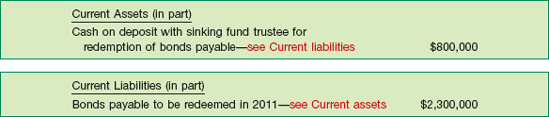
This cross-reference points out that the company will redeem $2,300,000 of bonds payable currently, for which it has only set aside $800,000. Therefore, it needs additional cash from unrestricted cash, from sales of investments, from profits, or from some other source. Alternatively, the company can show the same information parenthetically.
Another common procedure is to establish contra or adjunct accounts. A contra account on a balance sheet reduces either an asset, liability, or owners' equity account. Examples include Accumulated Depreciation and Discount on Bonds Payable. Contra accounts provide some flexibility in presenting the financial information. With the use of the Accumulated Depreciation account, for example, a reader of the statement can see the original cost of the asset as well as the depreciation to date.
An adjunct account, on the other hand, increases either an asset, liability, or owners' equity account. An example is Premium on Bonds Payable, which, when added to the Bonds Payable account, describes the total bond liability of the company.
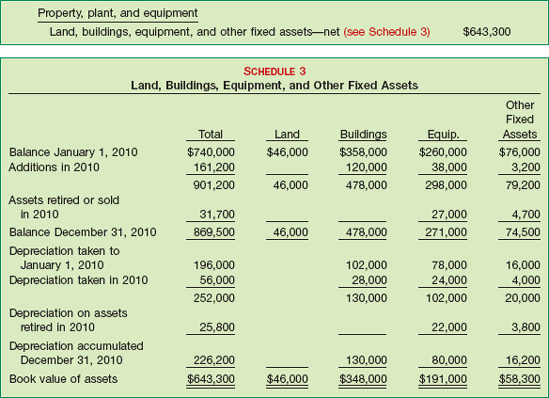
Often a company needs a separate schedule to present more detailed information about certain assets or liabilities, as follows.

Internationally, accounting terminology is a problem. Confusion arises even between nations that share a language. For example, U.S. investors normally think of "stock" as "equity" or "ownership"; to the British, "stocks" means inventory. In the United States "fixed assets" generally refers to "property, plant, and equipment"; in Britain the category includes more items.
The account titles in the general ledger do not necessarily represent the best terminology for balance sheet purposes. Companies often use brief account titles and include technical terms that only accountants understand. But many persons unacquainted with accounting terminology examine balance sheets. Thus, balance sheets should contain descriptions that readers will generally understand and clearly interpret.
For example, companies have used the term "reserve" in differing ways: to describe amounts deducted from assets (contra accounts such as accumulated depreciation and allowance for doubtful accounts); as a part of the title of contingent or estimated liabilities; and to describe an appropriation of retained earnings. Because of the different meanings attached to this term, misinterpretation often resulted from its use. Therefore, the profession has recommended that companies use the word reserve only to describe an appropriation of retained earnings. The use of the term in this narrower sense—to describe appropriated retained earnings—has resulted in a better understanding of its significance when it appears in a balance sheet. However, the term "appropriated" appears more logical, and we encourage its use.
For years the profession has recommended that the use of the word surplus be discontinued in balance sheet presentations of owners' equity. The use of the terms capital surplus, paid-in surplus, and earned surplus is confusing. Although condemned by the profession, these terms appear all too frequently in current financial statements.
Chapter 2 indicated that one of the three basic objectives of financial reporting is "assessing the amounts, timing, and uncertainty of cash flows." The three financial statements we have looked at so far—the income statement, the statement of stockholders' equity, and the balance sheet—each present some information about the cash flows of an enterprise during a period. But they do so to a limited extent. For instance, the income statement provides information about resources provided by operations, but not exactly cash. The statement of stockholders' equity shows the amount of cash used to pay dividends or purchase treasury stock. Comparative balance sheets might show what assets the company has acquired or disposed of and what liabilities it has incurred or liquidated.
Useful as they are, none of these statements presents a detailed summary of all the cash inflows and outflows, or the sources and uses of cash during the period. To fill this need, the FASB requires the statement of cash flows (also called the cash flow statement). [8]
The primary purpose of a statement of cash flows is to provide relevant information about the cash receipts and cash payments of an enterprise during a period. To achieve this purpose, the statement of cash flows reports the following: (1) the cash effects of operations during a period, (2) investing transactions, (3) financing transactions, and (4) the net increase or decrease in cash during the period.[72]
Reporting the sources, uses, and net increase or decrease in cash helps investors, creditors, and others know what is happening to a company's most liquid resource. Because most individuals maintain a checkbook and prepare a tax return on a cash basis, they can comprehend the information reported in the statement of cash flows.
The statement of cash flows provides answers to the following simple but important questions:
Where did the cash come from during the period?
What was the cash used for during the period?
What was the change in the cash balance during the period?
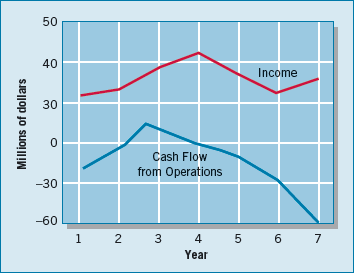
Investors usually focus on net income measured on an accrual basis. However, information on cash flows can be important for assessing a company's liquidity, financial flexibility, and overall financial performance. The graph below shows W. T. Grant's financial performance over 7 years.
Although W. T. Grant showed consistent profits and even some periods of earnings growth, its cash flow began to "go south" starting in about year 3. The company filed for bankruptcy shortly after year 7. Financial statement readers who studied the company's cash flows would have found early warnings of W. T. Grant's problems. The Grant experience is a classic case, illustrating the importance of cash flows as an early-warning signal of financial problems.
A more recent retailer case is Target. Although Target has shown good profits, some are concerned that a bit too much of its sales have been made on credit rather than cash. Why is this a problem? Like W. T. Grant, the earnings of profitable lenders can get battered in future periods if they have to start adding large amounts to their bad-loan reserve to catch up with credit losses. And if losses ramp up on Target-branded credit cards, Target may get hit in this way.
Source: Peter Eavis, "Is Target Corp.'s Credit Too Generous?" Wall Street Journal (March 11, 2008), p. C1.
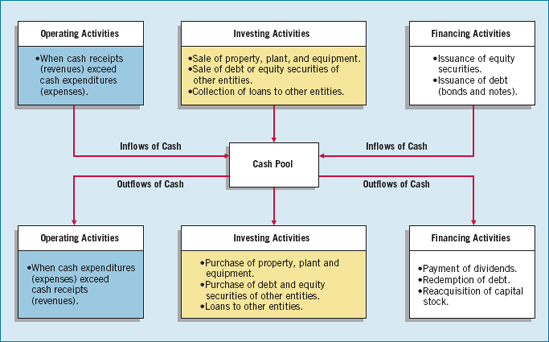
Companies classify cash receipts and cash payments during a period into three different activities in the statement of cash flows—operating, investing, and financing activities, defined as follows.
Operating activities involve the cash effects of transactions that enter into the determination of net income.
Investing activities include making and collecting loans and acquiring and disposing of investments (both debt and equity) and property, plant, and equipment.
Financing activities involve liability and owners' equity items. They include (a) obtaining resources from owners and providing them with a return on their investment, and (b) borrowing money from creditors and repaying the amounts borrowed.
Illustration 5-24 shows the basic format of the statement of cash flows.

Illustration 5-25 graphs the inflows and outflows of cash classified by activity.
The statement's value is that it helps users evaluate liquidity, solvency, and financial flexibility. As stated earlier, liquidity refers to the "nearness to cash" of assets and liabilities. Solvency is the firm's ability to pay its debts as they mature. Financial flexibility is a company's ability to respond and adapt to financial adversity and unexpected needs and opportunities.
We have devoted Chapter 23 entirely to the detailed preparation and content of the statement of cash flows. The intervening chapters will cover several elements and complex topics that affect the content of a typical statement of cash flows. The presentation in this chapter is introductory—a reminder of the existence of the statement of cash flows and its usefulness.
Companies obtain the information to prepare the statement of cash flows from several sources: (1) comparative balance sheets, (2) the current income statement, and (3) selected transaction data.
The following simple example demonstrates how companies use these sources in preparing a statement of cash flows.
On January 1, 2010, in its first year of operations, Telemarketing Inc. issued 50,000 shares of $1 par value common stock for $50,000 cash. The company rented its office space, furniture, and telecommunications equipment and performed marketing services throughout the first year. In June 2010 the company purchased land for $15,000. Illustration 5-26 shows the company's comparative balance sheets at the beginning and end of 2010.
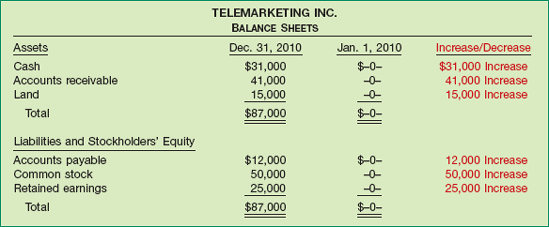
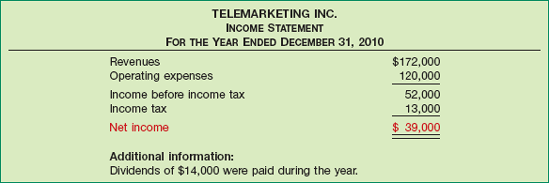
Illustration 5-27 presents the income statement and additional information.
Preparing the statement of cash flows from these sources involves four steps:
Determine the cash provided by (or used in) operating activities.
Determine the cash provided by or used in investing and financing activities.
Determine the change (increase or decrease) in cash during the period.
Reconcile the change in cash with the beginning and the ending cash balances.
Cash provided by operating activities is the excess of cash receipts over cash payments from operating activities. Companies determine this amount by converting net income on an accrual basis to a cash basis. To do so, they add to or deduct from net income those items in the income statement that do not affect cash. This procedure requires that a company analyze not only the current year's income statement but also the comparative balance sheets and selected transaction data.
Analysis of Telemarketing's comparative balance sheets reveals two items that will affect the computation of net cash provided by operating activities:
The increase in accounts receivable reflects a noncash increase of $41,000 in revenues.
The increase in accounts payable reflects a noncash increase of $12,000 in expenses.
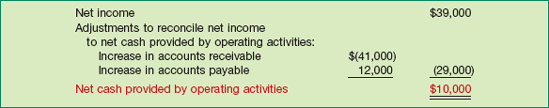
Therefore, to arrive at cash provided by operations, Telemarketing Inc. deducts from net income the increase in accounts receivable ($41,000), and it adds back to net income the increase in accounts payable ($12,000). As a result of these adjustments, the company determines cash provided by operations to be $10,000, computed as shown in Illustration 5-28.
Next, the company determines its investing and financing activities. Telemarketing Inc.'s only investing activity was the land purchase. It had two financing activities: (1) Common stock increased $50,000 from the issuance of 50,000 shares for cash. (2) The company paid $14,000 cash in dividends. Knowing the amounts provided/used by operating, investing, and financing activities, the company determines the net increase in cash. Illustration 5-29 presents Telemarketing Inc.'s statement of cash flows for 2010.
iGAAP requires a statement of cash flows. Both iGAAP and U.S. GAAP specify that the cash flows must be classified as operating, investing, or financing.
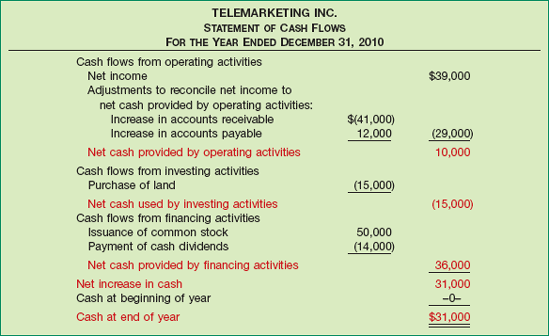
The increase in cash of $31,000 reported in the statement of cash flows agrees with the increase of $31,000 in cash calculated from the comparative balance sheets.
Not all of a company's significant activities involve cash. Examples of significant noncash activities are:
Issuance of common stock to purchase assets.
Conversion of bonds into common stock.
Issuance of debt to purchase assets.
Exchanges of long-lived assets.
Significant financing and investing activities that do not affect cash are not reported in the body of the statement of cash flows. Rather, these activities are reported in either a separate schedule at the bottom of the statement of cash flows or in separate notes to the financial statements. Such reporting of these noncash activities satisfies the full disclosure principle.
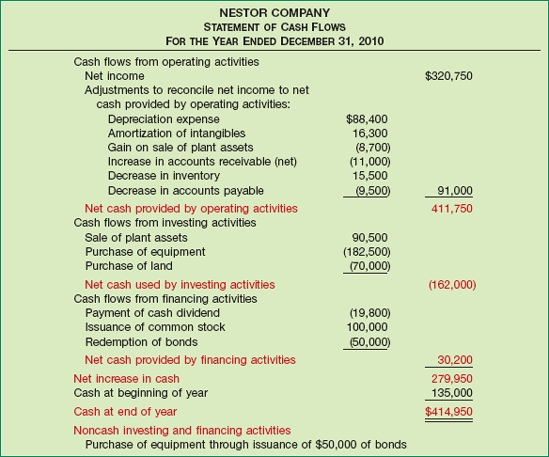
Illustration 5-30 shows an example of a comprehensive statement of cash flows. Note that the company purchased equipment through the issuance of $50,000 of bonds, which is a significant noncash transaction. In solving homework assignments, you should present significant noncash activities in a separate schedule at the bottom of the statement of cash flows.
"Happiness is a positive cash flow" is certainly true. Although net income provides a long-term measure of a company's success or failure, cash is its lifeblood. Without cash, a company will not survive. For small and newly developing companies, cash flow is the single most important element for survival. Even medium and large companies must control cash flow.
Creditors examine the cash flow statement carefully because they are concerned about being paid. They begin their examination by finding net cash provided by operating activities. A high amount indicates that a company is able to generate sufficient cash from operations to pay its bills without further borrowing. Conversely, a low or negative amount of net cash provided by operating activities indicates that a company may have to borrow or issue equity securities to acquire sufficient cash to pay its bills. Consequently, creditors look for answers to the following questions in the company's cash flow statements.
How successful is the company in generating net cash provided by operating activities?
What are the trends in net cash flow provided by operating activities over time?
What are the major reasons for the positive or negative net cash provided by operating activities?
You should recognize that companies can fail even though they report net income. The difference between net income and net cash provided by operating activities can be substantial. Companies such as W. T. Grant Company and Prime Motor Inn, for example, reported high net income numbers but negative net cash provided by operating activities. Eventually both companies filed for bankruptcy.
In addition, substantial increases in receivables and/or inventory can explain the difference between positive net income and negative net cash provided by operating activities. For example, in its first year of operations Hu Inc. reported a net income of $80,000. Its net cash provided by operating activities, however, was a negative $95,000, as shown in Illustration 5-31.
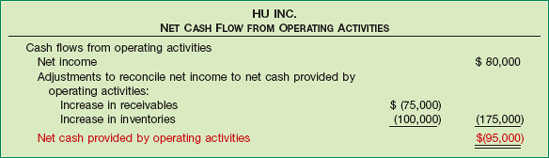
Hu could easily experience a "cash crunch" because it has its cash tied up in receivables and inventory. If Hu encounters problems in collecting receivables, or if inventory moves slowly or becomes obsolete, its creditors may have difficulty collecting on their loans.
Analysts increasingly use cash-flow-based measures of income, such as cash flow provided by operations, instead of or in addition to net income. The reason for the change is that they have been losing faith in accrual-accounting–based net income numbers.
Sadly, these days even cash flow from operations isn't always what it seems to be. For example, in 2002 WorldCom, Inc. disclosed that it had improperly capitalized expenses: It moved $3.8 billion of cash outflows from the "Cash from operating activities" section of the cash flow statement to the "Investing activities" section, thereby greatly enhancing cash provided by operating activities.
Similarly, in 2006 Pier 1 Imports restated its cash flow statements for 2005 and 2004. The problem? Pier 1 had improperly classified as an operating cash flow some payments received on the sale of receivables. Those payments should have been reported in the investing section. The restatement resulted in a $164 million, or 64%, decline in operating cash flow in 2005 (and a $51 million or 47% decline in 2004).
Source: Henny Sender, "Sadly, These Days Even Cash Flow Isn't Always What It Seems To Be," Wall Street Journal Online (May 8, 2002); and Jack Ciesielski, "Pier 1: Cash Flow Spring Cleaning," The AAO Weblog, www.accountingobserver.com/blog/ (April 6, 2006).
Readers of financial statements often assess liquidity by using the current cash debt coverage ratio. It indicates whether the company can pay off its current liabilities from its operations in a given year. Illustration 5-32 shows the formula for this ratio.
The higher the current cash debt coverage ratio, the less likely a company will have liquidity problems. For example, a ratio near 1:1 is good: It indicates that the company can meet all of its current obligations from internally generated cash flow.
The cash debt coverage ratio provides information on financial flexibility. It indicates a company's ability to repay its liabilities from net cash provided by operating activities, without having to liquidate the assets employed in its operations. Illustration 5-33 shows the formula for this ratio. Notice its similarity to the current cash debt coverage ratio. However, because it uses average total liabilities in place of average current liabilities, it takes a somewhat longer-range view.
The higher this ratio, the less likely the company will experience difficulty in meeting its obligations as they come due. It signals whether the company can pay its debts and survive if external sources of funds become limited or too expensive.
A more sophisticated way to examine a company's financial flexibility is to develop a free cash flow analysis. Free cash flow is the amount of discretionary cash flow a company has. It can use this cash flow to purchase additional investments, retire its debt, purchase treasury stock, or simply add to its liquidity. Financial statement users calculate free cash flow as shown in Illustration 5-34.

In a free cash flow analysis, we first deduct capital spending, to indicate it is the least discretionary expenditure a company generally makes. (Without continued efforts to maintain and expand facilities, it is unlikely that a company can continue to maintain its competitive position.) We then deduct dividends. Although a company can cut its dividend, it usually will do so only in a financial emergency. The amount resulting after these deductions is the company's free cash flow. Obviously, the greater the amount of free cash flow, the greater the company's amount of financial flexibility.
Questions that a free cash flow analysis answers are:
Is the company able to pay its dividends without resorting to external financing?
If business operations decline, will the company be able to maintain its needed capital investment?
What is the amount of discretionary cash flow that can be used for additional investment, retirement of debt, purchase of treasury stock, or addition to liquidity?
Illustration 5-35 is a free cash flow analysis using the cash flow statement for Nestor Company (shown in Illustration 5-30).

This computation shows that Nestor has a positive, and substantial, net cash provided by operating activities of $411,750. Nestor's statement of cash flows reports that the company purchased equipment of $182,500 and land of $70,000 for total capital spending of $252,500. Nestor has more than sufficient cash flow to meet its dividend payment and therefore has satisfactory financial flexibility.
As you can see from looking back at Illustration 5-30, Nestor used its free cash flow to redeem bonds and add to its liquidity. If it finds additional investments that are profitable, it can increase its spending without putting its dividend or basic capital spending in jeopardy. Companies that have strong financial flexibility can take advantage of profitable investments even in tough times. In addition, strong financial flexibility frees companies from worry about survival in poor economic times. In fact, those with strong financial flexibility often fare better in a poor economy because they can take advantage of opportunities that other companies cannot.

As in U.S. GAAP, the balance sheet and the statement of cash flows are required statements for iGAAP. In addition, the content and presentation of an iGAAP balance sheet and cash flow statement are similar to those used for U.S. GAAP. In general, the disclosure requirements related to the balance sheet and the statement of cash flows are much more extensive and detailed in the U.S. IAS 1, "Presentation of Financial Statements," provides the overall iGAAP requirements for balance sheet information. IAS 7, "Cash Flow Statements," provides the overall iGAAP requirements for cash flow information.
iGAAP requires that specific items be reported on the balance sheet. No such general standard exists in U.S. GAAP. However under U.S. GAAP, public companies must follow SEC regulations, which require specific line items. In addition, specific U.S. GAAP standards mandate certain forms of reporting balance sheet information.
There are many similarities between U.S. and iGAAP related to balance sheet presentation. For example:
—IAS 1 specifies minimum note disclosures, similar to U.S. GAAP on accounting policies and judgments. These must include information about (1) accounting policies followed, (2) judgments that management has made in the process of applying the entity's accounting policies, and (3) the key assumptions and estimation uncertainty that could result in a material adjustment to the carrying amounts of assets and liabilities within the next financial year.
—Comparative prior-period information must be presented and financial statements must be prepared annually.
—Current/noncurrent classification for assets and liabilities is normally required. In general, post–balance sheet events are not considered in classifying items as current or noncurrent.
Interestingly, iGAAP statements may report property, plant, and equipment first in the balance sheet. Some companies report the subtotal "net assets," which equals total assets minus total liabilities.
While the use of the term "reserve" is discouraged in U.S. GAAP, there is no such prohibition in iGAAP.
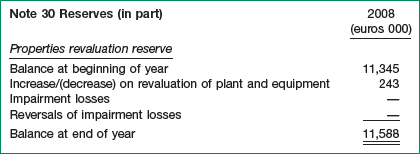
U.S. GAAP and iGAAP differ in the iGAAP provision for balance sheet revaluations of property, plant, and equipment. Under the revaluation model, revaluations are recorded and reported as part of stockholders' equity. To illustrate, Richardson Company uses iGAAP and has property and equipment on an historical cost basis of 2,000,000 euros. At the end of the year, Richardson appraises its property and equipment and determines it had a revaluation increase of 243,000 euros. Richardson records this revaluation under iGAAP with an increase to property and equipment as well as a valuation reserve in stockholders' equity. A note to the financial statements explains the change in the revaluation equity account from one period to the next, as shown below for Richardson Company, assuming a beginning balance of 11,345,000 euros.
The IASB and the FASB are working on a project to converge their standards related to financial statement presentation. A key feature of the proposed framework is that each of the statements will be organized, in the same format, to separate an entity's financing activities from its operating and investing activities and, further, to separate financing activities into transactions with owners and creditors. Thus, the same classifications used in the balance sheet would also be used in the income statement and the statement of cash flows. The project has three phases. You can follow the joint financial presentation project at the following link: http://www.fasb.org/project/financial_statement_presentation.shtml.

Three limitations of a balance sheet are: (1) The balance sheet does not reflect fair value because accountants use a historical cost basis in valuing and reporting most assets and liabilities. (2) Companies must use judgments and estimates to determine certain amounts, such as the collectibility of receivables and the useful life of long-term tangible and intangible assets. (3) The balance sheet omits many items that are of financial value to the business but cannot be recorded objectively, such as human resources, customer base, and reputation.


Analysts and other interested parties can gather qualitative information from financial statements by examining relationships between items on the statements and identifying trends in these relationships. A useful starting point in developing this information is ratio analysis.
A ratio expresses the mathematical relationship between one quantity and another. Ratio analysis expresses the relationship among pieces of selected financial statement data, in a percentage, a rate, or a simple proportion.
To illustrate, IBM Corporation recently had current assets of $46,970 million and current liabilities of $39,798 million. We find the ratio between these two amounts by dividing current assets by current liabilities. The alternative means of expression are:
- Percentage:
Current assets are 118% of current liabilities.
- Rate:
Current assets are 1.18 times as great as current liabilities.
- Proportion:
The relationship of current assets to current liabilities is 1.18:1.
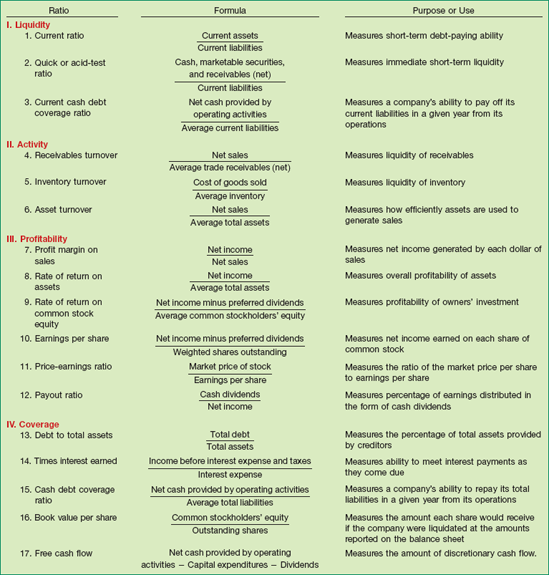
To analyze financial statements, we classify ratios into four types, as follows:
In Chapter 5 we discussed three measures related to the statement of cash flows (the current cash debt coverage and cash debt coverage ratios, and free cash flow). Throughout the remainder of the textbook, we provide ratios to help you understand and interpret the information presented in financial statements. Illustration 5A-1 presents the ratios that we will use throughout the text. You should find this chart helpful as you examine these ratios in more detail in the following chapters. An appendix to Chapter 24 further discusses financial statement analysis.
SUMMARY OF LEARNING OBJECTIVE FOR APPENDIX 5A
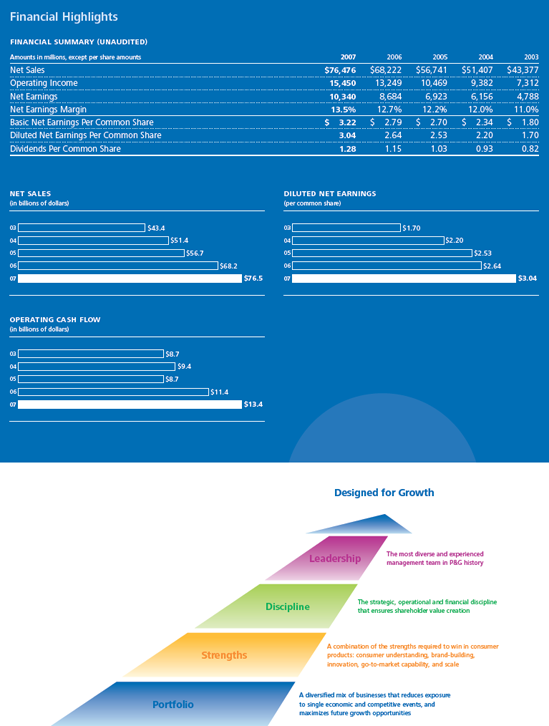
The following pages contain the financial statements, accompanying notes, and other information from the 2007 annual report of The Procter & Gamble Company (P&G). The Procter & Gamble Company manufactures and markets a range of consumer products in various countries throughout the world. The company markets over 300 branded products in more than 160 countries. It manages its business in five product segments: Fabric and Home Care, Baby and Family Care, Beauty Care, Health Care, and Snacks and Beverages.
We do not expect that you will comprehend P&G's financial statements and the accompanying notes in their entirety at your first reading. But we expect that by the time you complete the material in this textbook, your level of understanding and interpretive ability will have grown enormously.
At this point we recommend that you take 20 to 30 minutes to scan the following statements and notes. Your goal should be to familiarize yourself with the contents and accounting elements. Throughout the following 19 chapters, when you are asked to refer to specific parts of P&G's financial statements, do so! Then, when you have completed reading this book, we challenge you to reread P&G's financials to see how much greater and more sophisticated your understanding of them has become.
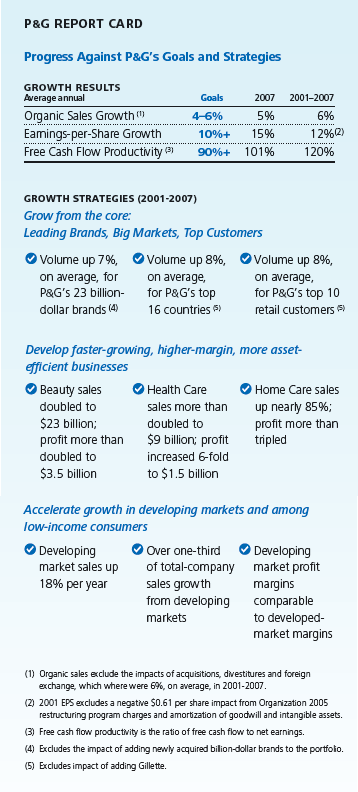
We've grown P&G sales from $39 billion to $76 billion in the past seven years. We've more than doubled the number of brands that generate $1 billion or more in sales each year, and now have 23 of these leading billion-dollar brands in our portfolio. We've more than quadrupled the number of brands that generate at least $500 million in sales, and now have 18 of these brands poised to be our next billion-dollar brands. We've nearly doubled the number of countries in which P&G generates a billion dollars or more in sales each year, and now have 12 billion-dollar countries. We do more than a billion dollars in sales each year with seven retail customers, up from two in 2001. We've generated more than $43 billion in net earnings and $50 billion in free cash flow. P&G's market capitalization has increased more than $100 billion since 2001, and today the Company is among the ten most valuable companies in the U.S.
The critical question now for P&G shareholders, prospective investors, and Company management is: "How do we keep a company of P&G's size growing?"
Opportunities for growth remain substantial in each of our strategic focus areas.
P&G's Core. We are widening P&G's share advantages versus competition. For example, in fabric care, we were the number two player globally in the early 1990s. Today, P&G has a 34% share of the global fabric care market, nearly double the next competitor, and we've grown share for six consecutive years. We have a lot of opportunity to keep growing all of P&G's billion-dollar brands. We're proving in category after category that a leading share, even a relatively high share, is not a barrier to growth. We will continue to leverage our brand lineup and category-leading innovation to keep core businesses healthy and growing.
Faster-Growing, Higher-Margin Businesses. We have even greater upside in businesses such as beauty and health care. The beauty and health categories in which P&G competes are a combined $360 billion market today, and are projected to grow 3% to 4% a year for the balance of the decade. P&G has nearly doubled its share of beauty and health over the past decade, and yet P&G's share of this combined market is only about 10% globally.
Developing Markets and Lower-Income Consumers. We can still grow substantially in developing markets by increasing household penetration and consumer usage frequency, and by entering categories where we're not yet competing. For example, the average U.S. household buys five to ten times as much P&G product per year as the average household in developing markets. In addition, there is a large number of households in developing regions that do not yet purchase any P&G product. Closing this gap, which we're confident we can do over time, will continue to drive strong growth for years to come.
There are significant bottom-line growth opportunities, as well. We'll continue to leverage P&G's scale. We'll reduce overhead costs by simplifying the way we work and eliminating duplication between global business units and market development organizations. We'll be more effective and efficient in how we manage our smaller country organizations and brands. And we'll continue to increase productivity in every one of our businesses.
We'll also continue to improve gross margins. The Company's current gross margin is about 52%. We can earn a higher total-company margin by achieving best-in-class margins in more categories and business units. Based on industry benchmarking, we believe that only about half of P&G businesses have gross margins better than their competitive peer set. As we get more of our businesses to best-in-class levels, we'll increase our total-company margin.
A COMPANY DESIGNED TO GROW
We're focused on these opportunities, realistic about challenges, and confident P&G's design for growth will enable us to keep P&G growing. Over the next few years, our portfolio will continue to shift toward faster-growing, higher-margin businesses. We'll extend the advantages we've created with our core strengths. We'll make the disciplined choices required to create even more shareholder value. We'll continue to develop the industry's strongest, broadest and deepest leadership bench.
And we'll continue to focus on inspiring and enabling P&G people to fulfill our Company's Purpose: improving consumers' lives in small but always meaningful ways every day. This is critical. Our design for growth reflects the management choices we've made to create the opportunities and capability for growth—but it's P&G people who deliver it. Their performance in fiscal 2007 was outstanding once again, and their capability, creativity and potential will ensure P&G out-performs the consumer products industry year after year.
At The Procter & Gamble Company, we take great pride in our long history of doing what's right. If you analyze what's made our company successful over the years, you may focus on our brands, our marketing strategies, our organization design and our ability to innovate. But if you really want to get at what drives our company's success, the place to look is our people. Our people are deeply committed to our Purpose, Values and Principles. It is this commitment to doing what's right that unites us.
This commitment to doing what's right is embodied in our financial reporting. High-quality financial reporting is our responsibility—one we execute with integrity, and within both the letter and spirit of the law.
High-quality financial reporting is characterized by accuracy, objectivity and transparency. Management is responsible for maintaining an effective system of internal controls over financial reporting to deliver those characteristics in all material respects. The Board of Directors, through its Audit Committee, provides oversight. We have engaged Deloitte & Touche LLP to audit our Consolidated Financial Statements, on which they have issued an unqualified opinion.
Our commitment to providing timely, accurate and understandable information to investors encompasses:
Communicating expectations to employees. Every employee—from senior management on down—is trained on the Company's Worldwide Business Conduct Manual, which sets forth the Company's commitment to conduct its business affairs with high ethical standards. Every employee is held personally accountable for compliance and is provided several means of reporting any concerns about violations of the Worldwide Business Conduct Manual, which is available on our website at www.pg.com.
Maintaining a strong internal control environment. Our system of internal controls includes written policies and procedures, segregation of duties and the careful selection and development of employees. The system is designed to provide reasonable assurance that transactions are executed as authorized and appropriately recorded, that assets are safeguarded and that accounting records are sufficiently reliable to permit the preparation of financial statements conforming in all material respects with accounting principles generally accepted in the United States of America. We monitor these internal controls through control self-assessments conducted by business unit management. In addition to performing financial and compliance audits around the world, including unannounced audits, our Global Internal Audit organization provides training and continuously improves internal control processes. Appropriate actions are taken by management to correct any identified control deficiencies.
Executing financial stewardship. We maintain specific programs and activities to ensure that employees understand their fiduciary responsibilities to shareholders. This ongoing effort encompasses financial discipline in strategic and daily business decisions and brings particular focus to maintaining accurate financial reporting and effective controls through process improvement, skill development and oversight.
Exerting rigorous oversight of the business. We continuously review business results and strategic choices. Our Global Leadership Council is actively involved—from understanding strategies to reviewing key initiatives, financial performance and control assessments. The intent is to ensure we remain objective, identify potential issues, continuously challenge each other and ensure recognition and rewards are appropriately aligned with results.
Engaging our Disclosure Committee. We maintain disclosure controls and procedures designed to ensure that information required to be disclosed is recorded, processed, summarized and reported timely and accurately. Our Disclosure Committee is a group of senior-level executives responsible for evaluating disclosure implications of significant business activities and events. The Committee reports its findings to the CEO and CFO, providing an effective process to evaluate our external disclosure obligations.
Encouraging strong and effective corporate governance from our Board of Directors. We have an active, capable and diligent Board that meets the required standards for independence, and we welcome the Board's oversight. Our Audit Committee comprises independent directors with significant financial knowledge and experience. We review significant accounting policies, financial reporting and internal control matters with them and encourage their independent discussions with external auditors. Our corporate governance guidelines, as well as the charter of the Audit Committee and certain other committees of our Board, are available on our website at www.pg.com.
P&G has a strong history of doing what's right. Our employees embrace our Purpose, Values and Principles. We take responsibility for the quality and accuracy of our financial reporting. We present this information proudly, with the expectation that those who use it will understand our company, recognize our commitment to performance with integrity and share our confidence in P&G's future.

Management is responsible for establishing and maintaining adequate internal control over financial reporting of The Procter & Gamble Company (as defined in Rule 13a-15(f) under the Securities Exchange Act of 1934, as amended). Our internal control over financial reporting is designed to provide reasonable assurance regarding the reliability of financial reporting and the preparation of financial statements for external purposes in accordance with generally accepted accounting principles in the United States of America.
Strong internal controls is an objective that is reinforced through our Worldwide Business Conduct Manual, which sets forth our commitment to conduct business with integrity, and within both the letter and the spirit of the law. The Company's internal control over financial reporting includes a Control Self-Assessment Program that is conducted annually by substantially all areas of the Company and is audited by the internal audit function. Management takes the appropriate action to correct any identified control deficiencies. Because of its inherent limitations, any system of internal control over financial reporting, no matter how well designed, may not prevent or detect misstatements due to the possibility that a control can be circumvented or overridden or that misstatements due to error or fraud may occur that are not detected. Also, because of changes in conditions, internal control effectiveness may vary over time.
Management assessed the effectiveness of the Company's internal control over financial reporting as of June 30, 2007, using criteria established in Internal Control—Integrated Framework issued by the Committee of Sponsoring Organizations of the Treadway Commission (COSO) and concluded that the Company maintained effective internal control over financial reporting as of June 30, 2007, based on these criteria.
Deloitte & Touche LLP, an independent registered public accounting firm, has audited the effectiveness of the Company's internal control over financial reporting and management's assessment of the effectiveness of the Company's internal control over financial reporting as of June 30, 2007, as stated in their report which is included herein.
August 14, 2007
To the Board of Directors and Shareholders of The Procter & Gamble Company
We have audited the accompanying Consolidated Balance Sheets of The Procter & Gamble Company and subsidiaries (the "Company") as of June 30, 2007 and 2006, and the related Consolidated Statements of Earnings, Shareholders' Equity, and Cash Flows for each of the three years in the period ended June 30, 2007. These financial statements are the responsibility of the Company's management. Our responsibility is to express an opinion on these financial statements based on our audits.
We conducted our audits in accordance with the standards of the Public Company Accounting Oversight Board (United States). Those standards require that we plan and perform the audit to obtain reasonable assurance about whether the financial statements are free of material misstatement. An audit includes examining, on a test basis, evidence supporting the amounts and disclosures in the financial statements. An audit also includes assessing the accounting principles used and significant estimates made by management, as well as evaluating the overall financial statement presentation. We believe that our audits provide a reasonable basis for our opinion.
In our opinion, such Consolidated Financial Statements present fairly, in all material respects, the financial position of the Company at June 30, 2007 and 2006, and the results of its operations and cash flows for each of the three years in the period ended June 30, 2007, in conformity with accounting principles generally accepted in the United States of America.
As discussed in Note 1 to the Consolidated Financial Statements, the Company adopted the provisions of SFAS No. 158, "Employers' Accounting for Defined Benefit Pension and Other Postretirement Plans, an amendment of FASB Statements No. 87, 88, 106, and 132(R)," effective June 30, 2007.
We have also audited, in accordance with the standards of the Public Company Accounting Oversight Board (United States), the effectiveness of the Company's internal control over financial reporting as of June 30, 2007, based on the criteria established in Internal Control—Integrated Framework issued by the Committee of Sponsoring Organizations of the Treadway Commission and our report dated August 14, 2007, expressed an unqualified opinion on management's assessment of the effectiveness of the Company's internal control over financial reporting and an unqualified opinion on the effectiveness of the Company's internal control over financial reporting.

To the Board of Directors and Shareholders of The Procter & Gamble Company
We have audited management's assessment, included in Management's Report on Internal Control Over Financial Reporting, that The Procter & Gamble Company and subsidiaries (the "Company") maintained effective internal control over financial reporting as of June 30, 2007, based on criteria established in Internal Control—Integrated Framework issued by the Committee of Sponsoring Organizations of the Treadway Commission. The Company's management is responsible for maintaining effective internal control over financial reporting and for its assessment of the effectiveness of internal control over financial reporting. Our responsibility is to express an opinion on management's assessment and an opinion on the effectiveness of the Company's internal control over financial reporting based on our audit.
We conducted our audit in accordance with the standards of the Public Company Accounting Oversight Board (United States). Those standards require that we plan and perform the audit to obtain reasonable assurance about whether effective internal control over financial reporting was maintained in all material respects. Our audit included obtaining an understanding of internal control over financial reporting, evaluating management's assessment, testing and evaluating the design and operating effectiveness of internal control, and performing such other procedures as we considered necessary in the circumstances. We believe that our audit provides a reasonable basis for our opinions.
A company's internal control over financial reporting is a process designed by, or under the supervision of, the company's principal executive and principal financial officers, or persons performing similar functions, and effected by the company's board of directors, management, and other personnel to provide reasonable assurance regarding the reliability of financial reporting and the preparation of financial statements for external purposes in accordance with generally accepted accounting principles. A company's internal control over financial reporting includes those policies and procedures that (1) pertain to the maintenance of records that, in reasonable detail, accurately and fairly reflect the transactions and dispositions of the assets of the company; (2) provide reasonable assurance that transactions are recorded as necessary to permit preparation of financial statements in accordance with generally accepted accounting principles, and that receipts and expenditures of the company are being made only in accordance with authorizations of management and directors of the company; and (3) provide reasonable assurance regarding prevention or timely detection of unauthorized acquisition, use, or disposition of the company's assets that could have a material effect on the financial statements.
Because of the inherent limitations of internal control over financial reporting, including the possibility of collusion or improper management override of controls, material misstatements due to error or fraud may not be prevented or detected on a timely basis. Also, projections of any evaluation of the effectiveness of the internal control over financial reporting to future periods are subject to the risk that the controls may become inadequate because of changes in conditions, or that the degree of compliance with the policies or procedures may deteriorate.
In our opinion, management's assessment that the Company maintained effective internal control over financial reporting as of June 30, 2007, is fairly stated, in all material respects, based on the criteria established in Internal Control—Integrated Framework issued by the Committee of Sponsoring Organizations of the Treadway Commission. Also in our opinion, the Company maintained, in all material respects, effective internal control over financial reporting as of June 30, 2007, based on the criteria established in Internal Control—Integrated Framework issued by the Committee of Sponsoring Organizations of the Treadway Commission.
We have also audited, in accordance with the standards of the Public Company Accounting Oversight Board (United States), the Consolidated Financial Statements as of and for the year ended June 30, 2007, of the Company and our report dated August 14, 2007, expressed an unqualified opinion on those financial statements and included an explanatory paragraph regarding the Company's adoption of SFAS No. 158, "Employers' Accounting for Defined Benefit Pension and Other Postretirement Plans, an amendment of FASB Statements No. 87, 88, 106, and 132(R)," effective June 30, 2007.

See the complete P&G annual report at www.wiley.com/college/kieso for Management's Discussion and Analysis.
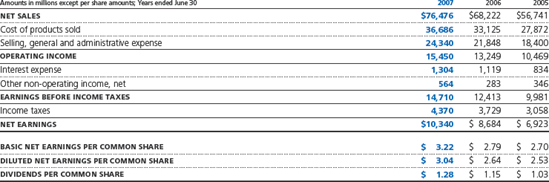
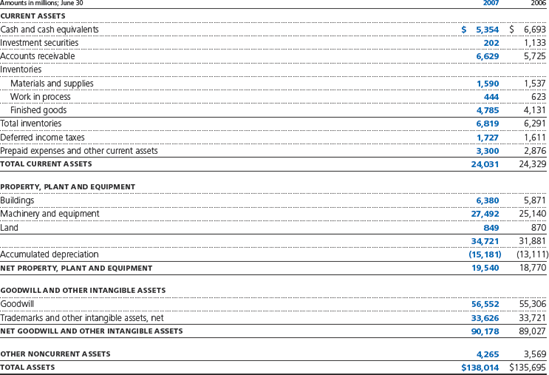
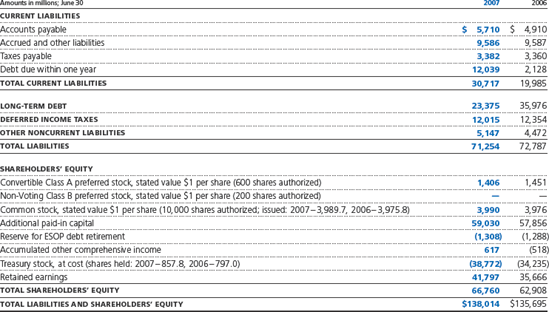
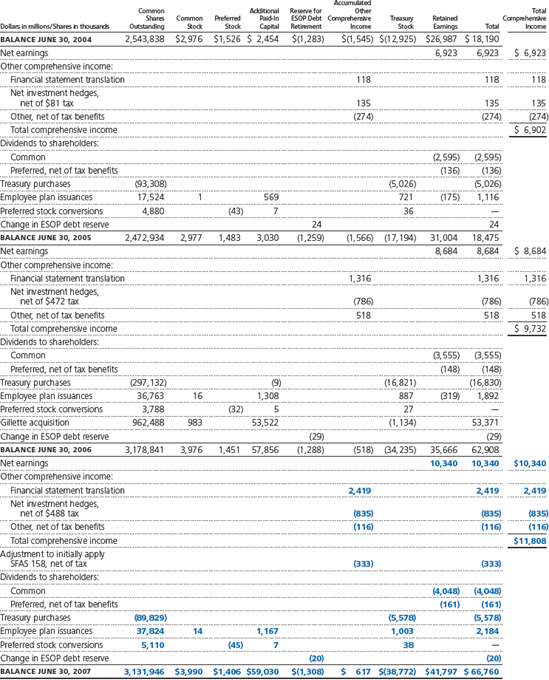
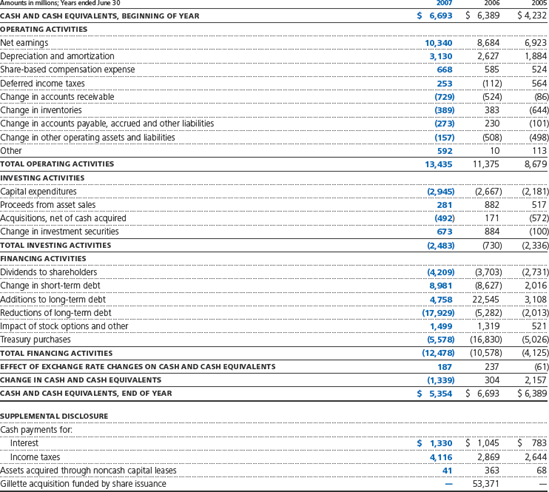
SUMMARY OF SIGNIFICANT ACCOUNTING POLICIES
Nature of Operations
The Procter & Gamble Company's (the "Company" "we" or "us") business is focused on providing branded consumer goods products of superior quality and value. Our products are sold in more than 180 countries primarily through retail operations including mass merchandisers, grocery stores, membership club stores, drug stores and high-frequency stores. We have on-the-ground operations in over 80 countries.
Basis of Presentation
The Consolidated Financial Statements include The Procter & Gamble Company and its controlled subsidiaries. Intercompany transactions are eliminated.
Use of Estimates
Preparation of financial statements in conformity with accounting principles generally accepted in the United States of America (U.S. GAAP) requires management to make estimates and assumptions that affect the amounts reported in the Consolidated Financial Statements and accompanying disclosures. These estimates are based on management's best knowledge of current events and actions the Company may undertake in the future. Estimates are used in accounting for, among other items, consumer and trade promotion accruals, pensions, post-employment benefits, stock options, valuation of acquired intangible assets, useful lives for depreciation and amortization, future cash flows associated with impairment testing for goodwill, indefinite-lived intangible assets and long-lived assets, deferred tax assets, potential income tax assessments and contingencies. Actual results may ultimately differ from estimates, although management does not believe such differences would materially affect the financial statements in any individual year.
Revenue Recognition
Sales are recognized when revenue is realized or realizable and has been earned. Most revenue transactions represent sales of inventory. The revenue recorded is presented net of sales and other taxes we collect on behalf of governmental authorities and includes shipping and handling costs, which generally are included in the list price to the customer. Our policy is to recognize revenue when title to the product, ownership and risk of loss transfer to the customer, which can be on the date of shipment or the date of receipt by the customer. A provision for payment discounts and product return allowances is recorded as a reduction of sales in the same period that the revenue is recognized.
Trade promotions, consisting primarily of customer pricing allowances, merchandising funds and consumer coupons, are offered through various programs to customers and consumers. Sales are recorded net of trade promotion spending, which is recognized as incurred, generally at the time of the sale. Most of these arrangements have terms of approximately one year. Accruals for expected payouts under these programs are included as accrued marketing and promotion in the accrued and other liabilities line item in the Consolidated Balance Sheets.
Cost of Products Sold
Cost of products sold is primarily comprised of direct materials and supplies consumed in the manufacture of product, as well as manufacturing labor, depreciation expense and direct overhead expense necessary to acquire and convert the purchased materials and supplies into finished product. Cost of products sold also includes the cost to distribute products to customers, inbound freight costs, internal transfer costs, warehousing costs and other shipping and handling activity.
Selling, General and Administrative Expense
Selling, general and administrative (SG&A) expense is primarily comprised of marketing expenses, selling expenses, research and development costs, administrative and other indirect overhead costs, depreciation and amortization expense on non-manufacturing assets and other miscellaneous operating items. Research and development costs are charged to expense as incurred and were $2,112 in 2007, $2,075 in 2006, and $1,940 in 2005. Advertising costs, charged to expense as incurred, include worldwide television, print, radio, Internet and in-store advertising expenses and were $7,937 in 2007, $7,122 in 2006, and $5,929 in 2005. The composition of amounts included in advertising costs have been changed for the current and historical periods to reflect evolving advertising strategies. Non-advertising related components of the Company's total marketing spending include costs associated with consumer promotions, product sampling and sales aids, all of which are included in SG&A expense, as well as coupons and customer trade funds, which are recorded as reductions to net sales.
Other Non-Operating Income, Net
Other non-operating income, net primarily includes divestiture gains and interest and investment income.
Currency Translation
Financial statements of operating subsidiaries outside the United States of America (U.S.) generally are measured using the local currency as the functional currency. Adjustments to translate those statements into U.S. dollars are recorded in other comprehensive income. Currency translation adjustments in accumulated other comprehensive income were gains of $2,941 and $522 at June 30, 2007 and 2006, respectively. For subsidiaries operating in highly inflationary economies, the U.S. dollar is the functional currency. Remeasurement adjustments for financial statements in highly inflationary economies and other transactional exchange gains and losses are reflected in earnings.
Cash Flow Presentation
The Statement of Cash Flows is prepared using the indirect method, which reconciles net earnings to cash flow from operating activities. These adjustments include the removal of timing differences between the occurrence of operating receipts and payments and their recognition in net earnings. The adjustments also remove cash flows from operating activities arising from investing and financing activities, which are presented separately from operating activities. Cash flows from foreign currency transactions and operations are translated at an average exchange rate for the period. Cash flows from hedging activities are included in the same category as the items being hedged. Cash flows from derivative instruments designated as net investment hedges are classified as financing activities. Cash flows from other derivative instruments used to manage interest, commodity or currency exposures are classified as operating activities.
Cash Equivalents
Highly liquid investments with remaining stated maturities of three months or less when purchased are considered cash equivalents and recorded at cost.
Investments
Investment securities consist of auction rate securities that approximate fair value, readily marketable debt and equity securities that are classified as trading with unrealized gains or losses charged to earnings, and available-for-sale securities with unrealized gains or losses charged to shareholders' equity.
Investments in certain companies over which we exert significant influence, but do not control the financial and operating decisions, are accounted for as equity method investments. Other investments that are not controlled, and over which we do not have the ability to exercise significant influence, are accounted for under the cost method and are included in other noncurrent assets.
Inventory Valuation
Inventories are valued at the lower of cost or market value. Product-related inventories are primarily maintained on the first-in, first-out method. Minor amounts of product inventories, including certain cosmetics and commodities, are maintained on the last-in, first-out method. The cost of spare part inventories is maintained using the average cost method.
Property, Plant and Equipment
Property, plant and equipment is recorded at cost reduced by accumulated depreciation. Depreciation expense is recognized over the assets' estimated useful lives using the straight-line method. Machinery and equipment includes office furniture and fixtures (15-year life), computer equipment and capitalized software (3- to 5-year lives) and manufacturing equipment (3- to 20-year lives). Buildings are depreciated over an estimated useful life of 40 years. Estimated useful lives are periodically reviewed and, when appropriate, changes are made prospectively. When certain events or changes in operating conditions occur, asset lives may be adjusted and an impairment assessment may be performed on the recoverability of the carrying amounts.
Goodwill and Other Intangible Assets
We have a number of acquired brands that have been determined to have indefinite lives due to the nature of our business. We evaluate a number of factors to determine whether an indefinite life is appropriate, including the competitive environment, market share, brand history, product life cycles, operating plans and the macroeconomic environment of the countries in which the brands are sold. When certain events or changes in operating conditions occur, an impairment assessment is performed and indefinite-lived brands may be adjusted to a determinable life.
Goodwill and indefinite-lived brands are not amortized, but are evaluated annually for impairment or when indicators of a potential impairment are present. Our impairment testing of goodwill is performed separately from our impairment testing of individual indefinite-lived intangibles. The annual evaluation for impairment of goodwill and indefinite-lived intangibles is based on valuation models that incorporate internal projections of expected future cash flows and operating plans.
The cost of intangible assets with determinable useful lives is amortized to reflect the pattern of economic benefits consumed, either on a straight-line or accelerated basis over the estimated periods benefited. Patents, technology and other intangibles with contractual terms are generally amortized over their respective legal or contractual lives. Customer relationships and other noncontractual intangible assets with determinable lives are amortized over periods generally ranging from 5 to 40 years. When certain events or changes in operatign conditions occur, an impairment assessment is performed and lives of intangible assets with determinable lives may be adjusted.
Fair Values of Financial Instruments
Certain financial instruments are required to be recorded at fair value. The estimated fair values of such financial instruments (including certain debt instruments, investment securities and derivatives) have been determined using market information and valuation methodologies, primarily discounted cash flow analysis. Changes in assumptions or estimation methods could affect the fair value estimates. However, we do not believe any such changes would have a material impact on our financial condition or results of operations. Other financial instruments, including cash equivalents, other investments and short-term debt, are recorded at cost, which approximates fair value. The fair values of long-term debt and derivative instruments are disclosed in Note 5 and Note 6, respectively.
New Accounting Pronouncements and Policies
Other than as described below, no new accounting pronouncement issued or effective during the fiscal year has had or is expected to have a material impact on the Consolidated Financial Statements.
Adoption Of Sfas 158, "Employers' Accounting For Defined Benefit Pension And Other Postretirement Plans, An Amendment Of Fasb Statements No. 87, 88, 106, And 132(R)" In September 2006, the FASB issued SFAS 158, "Employers' Accounting for Defined Benefit Pension and Other Postretirement Plans, an amendment of FASB Statements No. 87, 88, 106, and 132(R)." SFAS 158 requires companies to recognize the over-funded and under-funded status of defined benefit pension and other postretirement plans as assets or liabilities on their balance sheets. In addition, changes in the funded status must be recognized through other comprehensive income in shareholders' equity in the year in which the changes occur. We adopted SFAS 158 on June 30, 2007. In accordance with the transition rules in SFAS 158, this standard is being adopted on a prospective basis. The adoption of SFAS 158 resulted in an adjustment to our balance sheet, but had no impact on our net earnings or cash flow, nor did it impact any debt covenants.
SFAS 158 had no impact on our measurement date, which continues to be as of our fiscal year end. Refer to Note 9 for additional information regarding our pension and postretirement plans.
The following table reflects the effect of the adoption of SFAS 158 on our Consolidated Balance Sheets:
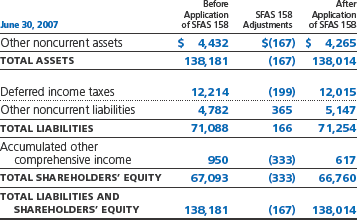
FASB INTERPRETATION 48, "ACCOUNTING FOR UNCERTAINTY IN INCOME TAXES"
In July 2006, the FASB issued FASB Interpretation (FIN) 48, "Accounting for Uncertainty in Income Taxes." FIN 48 addresses the accounting and disclosure of uncertain tax positions. FIN 48 prescribes a recognition threshold and measurement attribute for the financial statement recognition and measurement of a tax position taken or expected to be taken in a tax return. We will adopt FIN 48 on July 1, 2007. We estimate that the adoption of FIN 48 will result in a net decrease to beginning retained earnings of approximately $200-$250, primarily related to the accrual of additional interest and penalties on unrecognized tax benefits.
ACQUISITIONS
On October 1, 2005, we completed our acquisition of The Gillette Company. Pursuant to the acquisition agreement, which provided for the exchange of 0.975 shares of The Procter & Gamble Company common stock, on a tax-free basis, for each share of The Gillette Company, we issued 962 million shares of The Procter & Gamble Company common stock. The value of these shares was determined using the average Company stock prices beginning two days before and ending two days after January 28, 2005, the date the acquisition was announced. We also issued 79 million stock options in exchange for Gillette's outstanding stock options. Under the purchase method of accounting, the total consideration was approximately $53.4 billion including common stock, the fair value of vested stock options and acquisition costs. This acquisition resulted in two new reportable segments: Blades and Razors, and Duracell and Braun. The Gillette oral care and personal care businesses were subsumed within the Health Care and Beauty reportable segments, respectively. The operating results of the Gillette businesses are reported in our financial statements beginning October 1, 2005.
The Gillette Company is a market leader in several global product categories including blades and razors, oral care and batteries. Total sales for Gillette during its most recent pre-acquisition year ended December 31, 2004, were $10.5 billion.
In order to obtain regulatory approval of the transaction, we were required to divest certain overlapping businesses. We completed the divestiture of the Spinbrush toothbrush business, Rembrandt (a Gillette oral care product line), Right Guard and other Gillette deodorant brands during the fiscal year ended June 30, 2006.
In connection with this acquisition, we also announced a share buyback plan under which we planned to acquire up to $22.0 billion of Company common shares through the open market or from private transactions. We completed this share buyback plan in July 2006 with cumulative purchases of $20.1 billion. The repurchases were financed by borrowings under a $24.0 billion three-year credit facility with a syndicate of banks (see Note 5).
The following table provides pro forma results of operations for the years ended June 30, 2006 and 2005, as if Gillette had been acquired as of the beginning of each fiscal year presented. The pro forma results include certain purchase accounting adjustments such as the changes in depreciation and amortization expense on acquired tangible and intangible assets. However, pro forma results do not include any anticipated cost savings or other effects of the integration activities of Gillette. Accordingly, such amounts are not necessarily indicative of the results if the acquisition had occurred on the date indicated or that may result in the future.
Pro forma results: Years ended June 30 | 2006 | 2005 |
|---|---|---|
Net sales | $71,005 | $67,920 |
Net earnings | 8,871 | 8,522 |
Diluted net earnings per common share | $ 2.51 | $ 2.29 |
During the three months ended September 30, 2006, we completed the allocation of the purchase price to the individual assets acquired and liabilities assumed. To assist management in the allocation, we engaged valuation specialists to prepare independent appraisals. The following table presents the completed allocation of purchase price for the Gillette business as of the date of the acquisition.
Current assets | $ 5,681 |
Property, plant and equipment | 3,655 |
Goodwill | 35,298 |
Intangible assets | 29,707 |
Other noncurrent assets | 382 |
TOTAL ASSETS ACQUIRED | 74.723 |
Current liabilities | 5,346 |
Noncurrent liabilities | 15,951 |
TOTAL LIABILITIES ASSUMED | 21,297 |
NET ASSETS ACQUIRED | 53,426 |
The Gillette acquisition resulted in $35.3 billion in goodwill, allocated primarily to the segments comprising the Gillette businesses (Blades and Razors, Duracell and Braun, Health Care and Beauty). A portion of the goodwill has also been allocated to the other segments on the basis that certain cost synergies will benefit these businesses.
The purchase price allocation to the identifiable intangible assets included in these financial statements is as follows:
Weighted average life | ||
|---|---|---|
INTANGIBLE ASSETS WITH DETERMINABLE LIVES | ||
Brands | $ 1,627 | 20 |
Patents and technology | 2,716 | 17 |
Customer relationships | 1,436 | 27 |
BRANDS WITH INDEFINITE LIVES | 23,928 | Indefinite |
TOTAL INTANGIBLE ASSETS | 29,707 | |
The majority of the intangible asset valuation relates to brands. Our assessment as to brands that have an indefinite life and those that have a determinable life was based on a number of factors, including the competitive environment, market share, brand history, product life cycles, operating plan and macroeconomic environment of the countries in which the brands are sold. The indefinite-lived brands include Gillette, Venus, Duracell, Oral-B and Braun. The determinable-lived brands include certain brand sub-names, such as Mach3 and Sensor in the blades and razors business, and other regional or local brands. The determinable-lived brands have asset lives ranging from 10to40 years. The patents and technology intangibles are concentrated in the blades and razors and oral care businesses and have asset lives ranging from 5 to 20 years. The customer relationship intangible asset useful lives ranging from 20 to 30 years reflect the very low historical and projected customer attrition rates among Gillette's major retailer and distributor customers.
We also completed our analysis of integration plans, pursuant to which the Company is incurring costs primarily related to the elimination of selling, general and administrative overlap between the two companies in areas like Global Business Services, corporate staff and go-to-market support, as well as redundant manufacturing capacity. We recognized an assumed liability for Gillette exit costs of $1.2 billion, including $854 in separations related to approximately 5,500 people, $55 in employee relocation costs and $320 in other exit costs. As of June 30, 2007, the remaining liability was $608. Total integration plan charges against the assumed liability were $438 and $204 for the years ended June 30, 2007 and 2006, respectively. We expect such activities to be substantially complete by June 30, 2008.
Other minor business purchases and intangible asset acquisitions totaled $540, $395 and $572 in 2007, 2006 and 2005, respectively.
GOODWILL AND INTANGIBLE ASSETS
The change in the net carrying amount of goodwill by business was as follows:
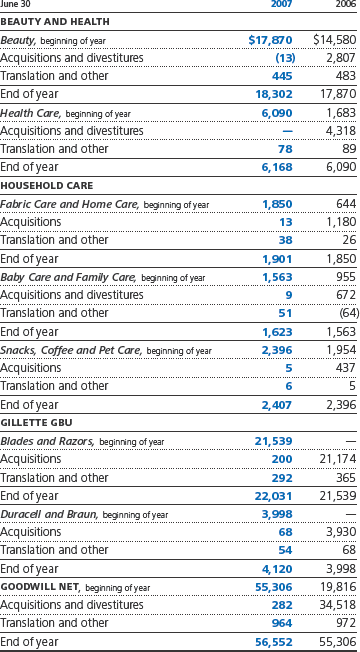
Acquisitions and divestitures in 2006 primarily reflect the Gillette acquisition, and in 2007 primarily reflect the finalization of the Gillette purchase price allocation. Gillette goodwill has been allocated primarily to the segments comprising the Gillette businesses (Blades and Razors, Duracell and Braun, Health Care and Beauty). A portion of the Gillette goodwill has also been allocated to the other segments on the basis that certain cost synergies will benefit these businesses.
Identifiable intangible assets were comprised of:
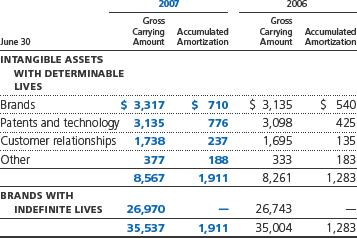
The amortization of intangible assets for the years ended June 30, 2007, 2006 and 2005, was $640, $587 and $198, respectively. Estimated amortization expense over the next five years is as follows: 2008–$618; 2009–$594; 2010–$556; 2011–$513 and 2012–$480. Such estimates do not reflect the impact of future foreign exchange rate changes.
SUPPLEMENTAL FINANCIAL INFORMATION
Selected components of current and noncurrent liabilities were as follows:
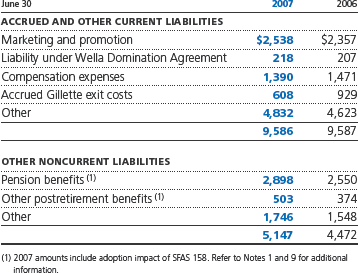
SHORT-TERM AND LONG-TERM DEBT
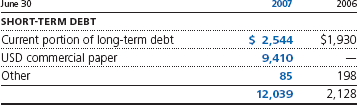
The weighted average short-term interest rates were 5.0% and 5.3% as of June 30, 2007 and 2006, respectively, including the effects of interest rate swaps discussed in Note 6.
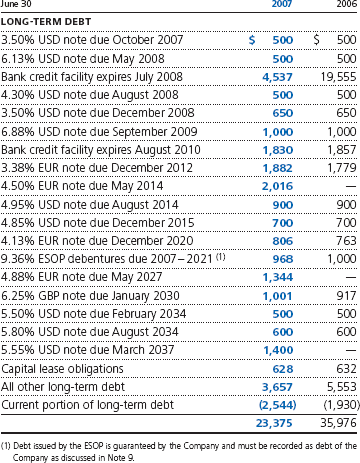
Long-term weighted average interest rates were 3.3% and 3.6% as of June 30, 2007 and 2006, respectively, including the effects of interest rate swaps and net investment hedges discussed in Note 6.
The fair value of the long-term debt was $23,122 and $36,027 at June 30, 2007 and 2006, respectively. Long-term debt maturities during the next five years are as follows: 2008–$2,544; 2009–$5,751; 2010–$1,982; 2011–$1,877 and 2012–$67.
The Procter & Gamble Company fully and unconditionally guarantees the debt securities issued by its 100% owned finance subsidiaries.
RISK MANAGEMENT ACTIVITIES
As a multinational company with diverse product offerings, we are exposed to market risks, such as changes in interest rates, currency exchange rates and commodity prices. To manage the volatility related to these exposures, we evaluate exposures on a consolidated basis to take advantage of logical exposure netting and correlation. For the remaining exposures, we enter into various financial transactions, which we account for under SFAS 133, "Accounting for Derivative Instruments and Hedging Activities," as amended and interpreted. The utilization of these financial transactions is governed by our policies covering acceptable counterparty exposure, instrument types and other hedging practices. We do not hold or issue derivative financial instruments for speculative trading purposes.
At inception, we formally designate and document qualifying instruments as hedges of underlying exposures. We formally assess, both at inception and at least quarterly on an ongoing basis, whether the financial instruments used in hedging transactions are effective at offsetting changes in either the fair value or cash flows of the related underlying exposure. Fluctuations in the value of these instruments generally are offset by changes in the fair value or cash flows of the underlying exposures being hedged. This offset is driven by the high degree of effectiveness between the exposure being hedged and the hedging instrument. Any ineffective portion of a change in the fair value of a qualifying instrument is immediately recognized in earnings.
Credit Risk
We have established strict counterparty credit guidelines and normally enter into transactions with investment grade financial institutions. Counterparty exposures are monitored daily and downgrades in credit rating are reviewed on a timely basis. Credit risk arising from the inability of a counterparty to meet the terms of our financial instrument contracts generally is limited to the amounts, if any, by which the counterparty's obligations exceed our obligations to the counterparty. We have not incurred and do not expect to incur material credit losses on our risk management or other financial instruments.
Interest Rate Management
Our policy is to manage interest cost using a mixture of fixed-rate and variable-rate debt. To manage this risk in a cost-efficient manner, we enter into interest rate swaps in which we agree to exchange with the counterparty, at specified intervals, the difference between fixed and variable interest amounts calculated by reference to an agreed-upon notional principal amount.
Interest rate swaps that meet specific criteria under SFAS 133 are accounted for as fair value and cash flow hedges. For fair value hedges, the changes in the fair value of both the hedging instruments and the underlying debt obligations are immediately recognized in interest expense as equal and offsetting gains and losses. There were no fair value hedging instruments at June 30, 2007. The fair value of fair value hedging instruments was a liability of $32 at June 30, 2006. All fair value hedges were 100% effective and as a result, there was no impact on earnings from hedge ineffectiveness. For cash flow hedges, the effective portion of the changes in fair value of the hedging instrument is reported in other comprehensive income (OCI) and reclassified into interest expense over the life of the underlying debt. The ineffective portion, which is not material for any year presented, is immediately recognized in earnings. The fair value of these cash flow hedging instruments was an asset of $53 and $225 at June 30, 2007 and 2006, respectively. During the next 12 months, $33 of the June 30, 2007 OCI balance will be reclassified to earnings consistent with the timing of the underlying hedged transactions.
Foreign Currency Management
We manufacture and sell our products in a number of countries throughout the world and, as a result, are exposed to movements in foreign currency exchange rates. The purpose of our foreign currency hedging program is to reduce the risk caused by short-term changes in exchange rates.
To manage this exchange rate risk, we primarily utilize forward contracts and options with maturities of less than 18 months and currency swaps with maturities up to five years. These instruments are intended to offset the effect of exchange rate fluctuations on forecasted sales, inventory purchases, intercompany royalties and intercompany loans denominated in foreign currencies and are therefore accounted for as cash flow hedges. The fair value of these instruments at June 30, 2007 and 2006, was $34 and $25 in assets and $2 and $58 in liabilities, respectively. The effective portion of the changes in fair value of these instruments is reported in OCI and reclassified into earnings in the same financial statement line item and in the same period or periods during which the related hedged transactions affect earnings. The ineffective portion, which is not material for any year presented, is immediately recognized in earnings.
Certain instruments used to manage foreign exchange exposure of intercompany financing transactions, income from international operations and other balance sheet items subject to revaluation do not meet the requirements for hedge accounting treatment. In these cases, the change in value of the instruments is designed to offset the foreign currency impact of the related exposure. The fair value of these instruments at June 30, 2007 and 2006, was $110 and $17in assets and $78 and $19in liabilities, respectively. The change in value of these instruments is immediately recognized in earnings. The net impact of such instruments, included in selling, general and administrative expense, was $56, $87 and $18 of gains in 2007, 2006 and 2005, respectively, which substantially offset foreign currency transaction and translation losses of the exposures being hedged.
Net Investment Hedging
We hedge certain net investment positions in major foreign subsidiaries. To accomplish this, we either borrow directly in foreign currency and designate all or a portion of foreign currency debt as a hedge of the applicable net investment position or enter into foreign currency swaps that are designated as hedges of our related foreign net investments. Under SFAS 133, changes in the fair value of these instruments are immediately recognized in OCI to offset the change in the value of the net investment being hedged. Currency effects of these hedges reflected in OCI were after-tax losses of $835 and $786 in 2007 and 2006, respectively, and a$135 after-tax gain in 2005. Accumulated net balances were $2,072 and $1,237 after-tax losses as of June 30, 2007 and 2006, respectively.
Commodity Price Management
Certain raw materials utilized in our products or production processes are subject to price volatility caused by weather, supply conditions, political and economic variables and other unpredictable factors. To manage the volatility related to anticipated purchases of certain of these materials, we use futures and options with maturities generally less than one year and swap contracts with maturities up to five years. These market instruments generally are designated as cash flow hedges under SFAS 133. The effective portion of the changes in fair value for these instruments is reported in OCI and reclassified into earnings in the same financial statement line item and in the same period or periods during which the hedged transactions affect earnings. The ineffective portion, which is not material for anyyear presented, is immediately recognized in earnings. The fair value of these cash flow hedging instruments was an asset of $70 and $32 at June 30, 2007 and 2006, respectively. During the next 12 months, $14 of the June 30, 2007 OCI balance will be reclassified to earnings consistent with the timing of the underlying hedged transactions.
Insurance
The Company purchases limited discretionary insurance to cover catastrophic property damage, business interruption, and liability risk of loss exposures. Deductibles and loss sharing will likely increase over time, recognizing the Company's ability to cost-effectively fund losses from internal cash flow generation and access to capital markets.
EARNINGS PER SHARE
Net earnings less preferred dividends (net of related tax benefits) are divided by the weighted average number of common shares outstanding during the year to calculate basic net earnings per common share. Diluted net earnings per common share are calculated to give effect to stock options and other stock-based awards (see Note 8) and assume conversion of preferred stock (see Note 9).
Net earnings and common shares used to calculate basic and diluted net earnings per share were as follows:
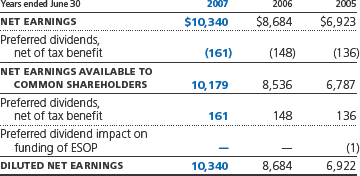
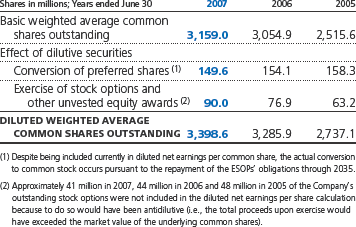
STOCK-BASED COMPENSATION
We have a primary stock-based compensation plan under which stock options are granted annually to key managers and directors with exercise prices equal to the market price of the underlying shares on the date of grant. A total of 229 million shares of common stock were authorized for issuance under plans approved by shareholders in 2001 and 2003, of which 73 million remain available for grant. An additional 20 million shares of common stock were authorized for issuance under a plan approved by Gillette shareowners in 2004 and assumed by the Company in conjunction with the acquisition of The Gillette Company in October 2005. A total of 14 million of the shares remain available for grant under this plan. There are also five million shares available for grant under the Future Shares Plan approved by the Board of Directors in 1997. This plan will terminate in October 2007. Grants issued under P&G shareholder approved plans since September 2002 are vested after three years and have a 10-year life. Grants issued under these plans from July 1998 through August 2002 are vested after three years and have a 15-year life, while grants issued prior to July 1998 are vested after one year and have a 10-year life. In addition to our key manager and director grants, we make other minor stock option grants to employees for which vesting terms and option lives are not substantially different.
Total stock-based compensation expense for stock option grants was $612, $526 and $459 for 2007, 2006 and 2005, respectively. The total income tax benefit recognized in the income statement for these stock-based compensation arrangements was $163, $140and $125 for 2007, 2006 and 2005, respectively. We also make minor grants of restricted stock, restricted stock units and other stock-based grants to certain employees. Total compensation cost for these restricted stock, restricted stock units and other stock-based grants, which are generally expensed at grant date, was $56, $59 and $65 in 2007, 2006 and 2005, respectively.
In calculating the compensation expense for options granted, we estimated the fair value of each grant issued through December 31, 2004, using the Black-Scholes option-pricing model. Effective January 1, 2005, we utilize a binomial lattice-based model for the valuation of stock option grants. The utilization of the binomial lattice-based model did not have a significant impact on the valuation of stock options as compared to the Black-Scholes model. Assumptions utilized in the model, which are evaluated and revised, as necessary, to reflect market conditions and experience, were as follows:
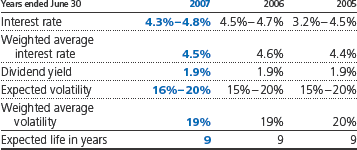
Because lattice-based option valuation models incorporate ranges of assumptions for inputs, those ranges are disclosed in the preceding table. Expected volatilities are based on a combination of historical volatility of our stock and implied volatilities of call options on our stock. We use historical data to estimate option exercise and employee termination patterns within the valuation model. The expected term of options granted is derived from the output of the option valuation model and represents the average period of time that options granted are expected to be outstanding. The interest rate for periods within the contractual life of the options is based on the U.S. Treasury yield curve in effect at the time of grant.
A summary of options under the plans as of June 30, 2007, and activity during the year then ended is presented below:
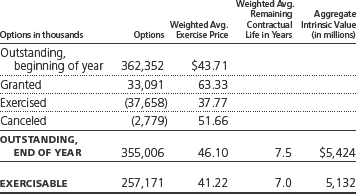
The weighted average grant-date fair value of options granted was $17.29, $16.30 and $14.34 per share in 2007, 2006 and 2005, respectively. The total intrinsic value of options exercised was $894, $815 and $526 in 2007, 2006 and 2005, respectively. The total grant-date fair value of options that vested during 2007, 2006 and 2005 was $552, $388 and $532, respectively. We have no specific policy to repurchase common shares to mitigate the dilutive impact of options; however, we have historically made adequate discretionary purchases, based on cash availability, market trends and other factors, to satisfy stock option exercise activity.
At June 30, 2007, there was $622 of compensation cost that has not yet been recognized related to nonvested stock-based awards. That cost is expected to be recognized over a remaining weighted average period of 1.9 years.
Cash received from options exercisedwas$1,422, $1,229 and $455 in 2007, 2006 and 2005, respectively. The actual tax benefit realized for the tax deductions from option exercises totaled $265, $242 and $149 in 2007, 2006 and 2005, respectively.
POSTRETIREMENT BENEFITS AND EMPLOYEE STOCK OWNERSHIP PLAN
We offer various postretirement benefits to our employees.
Defined Contribution Retirement Plans
We have defined contribution plans which cover the majority of our U.S. employees, as well as employees in certain other countries. These plans are fully funded. We generally make contributions to participants' accounts based on individual base salaries and years of service. The primary U.S. defined contribution plan (the U.S. DC plan) comprises the majority of the balances and expense for the Company's defined contribution plans. For the U.S. DC plan, the contribution rate is set annually. Total contributions for this plan approximated 15% of total participants' annual wages and salaries in 2007, 2006 and 2005.
We maintain The Procter & Gamble Profit Sharing Trust (Trust) and Employee Stock Ownership Plan (ESOP) to provide a portion of the funding for the U.S. DC plan, as well as other retiree benefits. Operating details of the ESOP are provided at the end of this Note. The fair value of the ESOP Series A shares allocated to participants reduces our cash contribution required to fund the U.S. DC plan. Total defined contribution expense was $273, $249 and $215 in 2007, 2006 and 2005, respectively.
Defined Benefit Retirement Plans and Other Retiree Benefits
We offer defined benefit retirement pension plans to certain employees. These benefits relate primarily to local plans outside the U.S., and to a lesser extent, plans assumed in the Gillette acquisition covering U.S. employees. These acquired Gillette plans will be frozen effective January 1, 2008.
We also provide certain other retiree benefits, primarily health care and life insurance, for the majority of our U.S. employees who become eligible for these benefits when they meet minimum age and service requirements. Generally, the health care plans require cost sharing with retirees and pay a stated percentage of expenses, reduced by deductibles and other coverages. These benefits are primarily funded by ESOP Series B shares, as well as certain other assets contributed by the Company.
As discussed in Note 1, we adopted SFAS 158 on June 30, 2007, on the required prospective basis. Our June 30, 2007 disclosure is in accordance with the new requirements.
Obligation and Funded Status. We use a June 30 measurement date for our defined benefit retirement plans and other retiree benefit plans. The following provides a reconciliation of benefit obligations, plan assets and funded status of these plans:
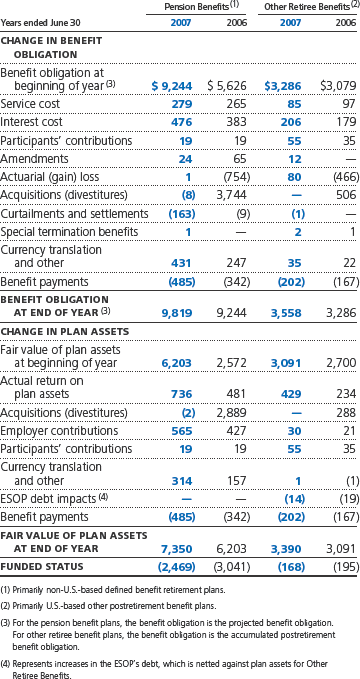
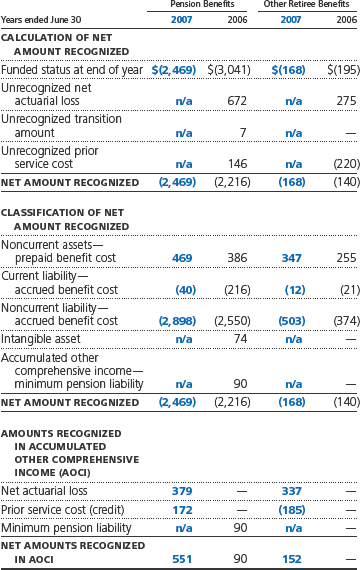
The underfunding of pension benefits is primarily a function of the different funding incentives that exist outside of the U.S. In certain countries where we have major operations, there are no legal requirements or financial incentives provided to companies to pre-fund pension obligations. In these instances, benefit payments are typically paid directly from the Company's cash as they become due.
The accumulated benefit obligation for all defined benefit retirement pension plans was $8,611 and $8,013 at June 30, 2007, and June 30, 2006, respectively. Pension plans with accumulated benefit obligations in excess of plan assets and plans with projected benefit obligations in excess of plan assets consist of the following:
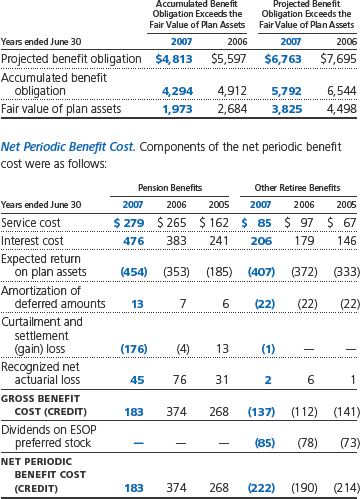
Pursuant to plan revisions adopted during 2007, Gillette's U.S. defined benefit retirement pension plans will be frozen effective January 1, 2008, at which time Gillette employees in the U.S. will move into the P&G defined contribution Profit Sharing Trust and Employee Stock Ownership Plan. This revision resulted in a $154 curtailment gain for the year ended June 30, 2007.
Amounts expected to be amortized from accumulated other comprehensive income into net period benefit cost during the year ending June 30, 2008, are as follows:
Pension Benefits | Other Retiree Benefits | |
|---|---|---|
Net actuarial loss | $25 | $ 6 |
Prior service cost (credit) | 14 | (21) |
Assumptions. We determine our actuarial assumptions on an annual basis. These assumptions are weighted to reflect each country that may have an impact on the cost of providing retirement benefits. The weighted average assumptions for the defined benefit and other retiree benefit calculations, as well as assumed health care trend rates, were as follows:
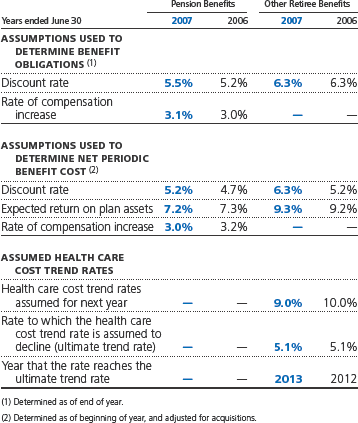
Several factors are considered in developing the estimate for the long-term expected rate of return on plan assets. For the defined benefit retirement plans, these include historical rates of return of broad equity and bond indices and projected long-term rates of return obtained from pension investment consultants. The expected long-term rates of return for plan assets are 8%–9% for equities and 5%–6% for bonds. For other retiree benefit plans, the expected long-term rate of return reflects the fact that the assets are comprised primarily of Company stock. The expected rate of return on Company stock is based on the long-term projected return of 9.5% and reflects the historical pattern of favorable returns on the Company's stock.
Assumed health care cost trend rates could have a significant effect on the amounts reported for the other retiree benefit plans. A one-percentage point change in assumed health care cost trend rates would have the following effects:
One-Percentage Point Increase | One-Percentage Point Decrease | |
|---|---|---|
Effect on total of service and interest cost components | $ 51 | $ (41) |
Effect on postretirement benefit obligation | 526 | (426) |
Plan Assets. Our target asset allocation for the year ending June 30, 2008, and actual asset allocation by asset category as of June 30, 2007 and 2006, are as follows:
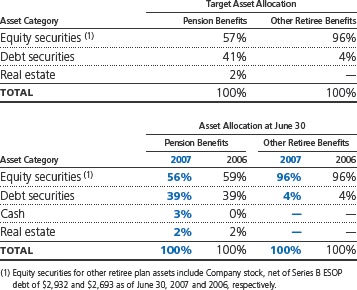
Our investment objective for defined benefit retirement plan assets is to meet the plans' benefit obligations, while minimizing the potential for future required Company plan contributions. The investment strategies focus on asset class diversification, liquidity to meet benefit payments and an appropriate balance of long-term investment return and risk. Target ranges for asset allocations are determined by matching the actuarial projections of the plans' future liabilities and benefit payments with expected long-term rates of return on the assets, taking into account investment return volatility and correlations across asset classes. Flan assets are diversified across several investment managers and are generally invested in liquid funds that are selected to track broad market equity and bond indices. Investment risk is carefully controlled with plan assets rebalanced to target allocations on a periodic basis and continual monitoring of investment managers' performance relative to the investment guidelines established with each investment manager.
Cash Flows. Management's best estimate of our cash requirements for the defined benefit retirement plans and other retiree benefit plans for the year ending June 30, 2008, is $468 and $42, respectively. For the defined benefit retirement plans, this is comprised of $147 in expected benefit payments from the Company directly to participants of unfunded plans and $321 of expected contributions to funded plans. For other retiree benefit plans, this is comprised of expected contributions that will be used directly for benefit payments. Expected contributions are dependent on many variables, including the variability of the market value of the plan assets as compared to the benefit obligation and other market or regulatory conditions. In addition, we take into consideration our business investment opportunities and resulting cash requirements. Accordingly, actual funding may differ significantly from current estimates.
Total benefit payments expected to be paid to participants, which include payments funded from the Company's assets, as discussed above, as well as payments paid from the plans, are as follows:
Years ended June 30 | Pension Benefits | Other Retiree Benefits |
|---|---|---|
EXPECTED BENEFIT PAYMENTS | ||
2008 | $ 473 | $ 199 |
2009 | 439 | 216 |
2010 | 454 | 233 |
2011 | 468 | 249 |
2012 | 474 | 263 |
2013-2017 | 2,654 | 1,523 |
Employee Stock Ownership Plan
We maintain the ESOP to provide funding for certain employee benefits discussed in the preceding paragraphs.
The ESOP borrowed $1.0 billion in 1989 and the proceeds were used to purchase Series A ESOP Convertible Class A Preferred Stock to fund a portion of the U.S. DC plan. Principal and interest requirements of the borrowing were paid by the Trust from dividends on the preferred shares and from advances from the Company. The original borrowing of$1.0 billion has been repaid in full, and advances from the Company of $216 remain outstanding at June 30, 2007. Each share is convertible at the option of the holder into one share of the Company's common stock. The dividend for the current year was equal to the common stock dividend of $1.28 per share. The liquidation value is $6.82 per share.
In 1991, the ESOP borrowed an additional $1.0 billion. The proceeds were used to purchase Series B ESOP Convertible Class A Preferred Stock to fund a portion of retiree health care benefits. These shares, net of the ESOP's debt, are considered plan assets of the Other Retiree Benefits plan discussed above. Debt service requirements are funded by preferred stock dividends, cash contributions and advances from the Company, of which $123 is outstanding at June 30, 2007. Each share is convertible at the option of the holder into one share of the Company's common stock. The dividend for the current year was equal to the common stock dividend of $1.28 per share. The liquidation value is $12.96 per share.
As permitted by SOP 93-6, "Employers Accounting for Employee Stock Ownership Plans," we have elected, where applicable, to continue our practices, which are based on SOP 76-3, "Accounting Practices for Certain Employee Stock Ownership Plans." ESOP debt, which is guaranteed by the Company, is recorded as debt (see Note 5). Preferred shares issued to the ESOP are offset by the Reserve for ESOP Debt Retirement in the Consolidated Balance Sheets and the Consolidated Statements of Shareholders' Equity. Advances to the ESOP are recorded as an increase in the Reserve for ESOP Debt Retirement. Interest incurred on the ESOP debt is recorded as interest expense. Dividends on all preferred shares, net of related tax benefits, are charged to retained earnings.
The series A and B preferred shares of the ESOP are allocated to employees based on debt service requirements, net of advances made by the Company to the Trust. The number of preferred shares outstanding at June 30 was as follows:
Shares in thousands | 2007 | 2006 | 2005 |
|---|---|---|---|
Allocated | 60,402 | 61,614 | 61,904 |
Unallocated | 20,807 | 23,125 | 25,623 |
TOTAL SERIES A | 81,209 | 84,739 | 87,527 |
Allocated | 21,105 | 21,733 | 21,989 |
Unallocated | 44,642 | 45,594 | 46,338 |
TOTAL SERIES B | 65,747 | 67,327 | 68,327 |
For purposes of calculating diluted net earnings per common share, the preferred shares held by the ESOP are considered converted from inception.
In connection with the Gillette acquisition, we assumed the Gillette ESOP, which was established to assist Gillette employees in financing retiree medical costs. These ESOP accounts are held by participants and must be used to reduce the Company's other retiree benefit obligations. Such accounts reduced our obligation by $245 at June 30, 2007.
INCOME TAXES
Under SFAS 109, "Accounting for Income Taxes," income taxes are recognized for the amount of taxes payable for the current year and for the impact of deferred tax liabilities and assets, which represent future tax consequences of events that have been recognized differently in the financial statements than for tax purposes. Deferred tax assets and liabilities are established using the enacted statutory tax rates and are adjusted for any changes in such rates in the period of change.
Management judgment is required in evaluating tax positions and other items that factor into determining tax provisions. Management believes its tax positions and related provisions reflected in the Consolidated Financial Statements are fully supportable. We establish reserves for additional income taxes related to positions that may be challenged by local authorities and may not be fully sustained, despite our belief that the underlying tax positions are fully supportable. In such cases, the reserves for additional taxes are based on management's best estimate of the ultimate outcome. These reserves are reviewed on an ongoing basis and are adjusted in light of changing facts and circumstances, including progress on tax audits, changes in interpretations of tax laws, developments in case law and closing of statutes of limitation. Our tax provision includes the impact of recording reserves and any changes thereto. We have a number of tax audits in process and have open tax years with various significant taxing jurisdictions that range primarily from 1997 to 2007. Based on currently available information, we do not believe the ultimate outcome of these tax audits and other tax positions related to open tax years, when finalized, will have a material adverse effect on our financial position, results of operations or cash flows.
Earnings before income taxes consisted of the following:
Years ended June 30 | 2007 | 2006 | 2005 |
|---|---|---|---|
United States | $ 9,138 | $ 7,410 | $6,266 |
International | 5,572 | 5,003 | 3,715 |
14,710 | 12,413 | 9,981 |
The income tax provision consisted of the following
Years ended June 30 | 2007 | 2006 | 2005 |
|---|---|---|---|
CURRENTTAX EXPENSE | |||
U.S. federal | $2,667 | $1,961 | $1,466 |
International | 1,325 | 1,702 | 886 |
U.S. state and local | 125 | 178 | 142 |
4,117 | 3,841 | 2,494 | |
DEFERRED TAX EXPENSE | |||
U.S. federal | 231 | 226 | 215 |
International and other | 22 | (338) | 349 |
253 | (112) | 564 | |
TOTAL TAX EXPENSE | 4,370 | 3,729 | 3,058 |
A reconciliation of the U.S. federal statutory income tax rate to our actual income tax rate is provided below:
Years ended June 30 | 2007 | 2006 | 2005 |
|---|---|---|---|
U.S. federal statutory income tax rate | 35.0% | 35.0% | 35.0% |
Country mix impacts of foreign operations | −4.3% | −3.6% | −4.8% |
AJCA repatriation tax charge | — | — | 2.8% |
Income tax reserve adjustments | −0.3 | −1.5% | −2.3% |
Other | −0.7% | 0.1% | −0.1% |
EFFECTIVE INCOME TAX RATE | 29.7% | 30.0% | 30.6% |
Income tax reserve adjustments represent changes in estimated exposures related to prior year tax positions. Tax benefits credited to shareholders' equity totaled $1,066 and $174 for the years ended June 30, 2007 and 2006, respectively. These primarily relate to the tax effects of net investment hedges, excess tax benefits from the exercise of stock options and the impacts of certain adjustments to pension and other retiree benefit obligations recorded in shareholders' equity, including the impact of adopting SFAS 158 in 2007.
The American Jobs Creation Act of 2004 (the AJCA) permitted U.S. corporations to repatriate earnings of foreign subsidiaries at a one-time favorable effective federal statutory tax rate of 5.25% as compared to the highest corporate tax rate of 35%. For the year ended June 30, 2006, we repatriated $7.2 billion in earnings previously considered indefinitely invested. We provided for $295 of deferred income tax expense associated with this repatriation in the year ended June 30, 2005.
We have undistributed earnings of foreign subsidiaries of approximately $17 billion at June 30, 2007, for which deferred taxes have not been provided. Such earnings are considered indefinitely invested in the foreign subsidiaries. If such earnings were repatriated, additional tax expense may result, although the calculation of such additional taxes is not practicable.
Deferred income tax assets and liabilities were comprised of the following:
June 30 | 2007 | 2006 |
|---|---|---|
DEFERRED TAX ASSETS | ||
Stock-based compensation | $ 1,132 | $ 1,063 |
Unrealized loss on financial and foreign exchange transactions | 723 | 507 |
Pension and postretirement benefits | 560 | 547 |
Loss and other carryforwards | 439 | 615 |
Goodwill and other intangible assets | 249 | 19 |
Advance payments | 183 | 219 |
Accrued marketing and promotion expense | 161 | 183 |
Accrued Gillette exit costs | 138 | 173 |
Fixed assets | 85 | 87 |
Other | 1,076 | 1,025 |
Valuation allowances | (190) | (398) |
4,556 | 4,040 | |
DEFERRED TAX LIABILITIES | ||
Goodwill and other intangible assets | 12,102 | 12,036 |
Fixed assets | 1,884 | 1,861 |
Other | 132 | 436 |
14,118 | 14,333 | |
Net operating loss carryforwards were $1,442 and $2,134 at June 30, 2007 and 2006, respectively. If unused, $663 will expire between 2008 and 2027. The remainder, totaling $779 at June 30, 2007, may be carried forward indefinitely.
COMMITMENTS AND CONTINGENCIES
Guarantees
In conjunction with certain transactions, primarily divestitures, we may provide routine indemnifications (e.g., indemnification for representations and warranties, and retention of previously existing environmental, tax and employee liabilities) whose terms range in duration and in some circumstances are not explicitly defined. The maximum obligation under some such indemnifications is not explicitly stated and, as a result, the overall amount of these obligations cannot be reasonably estimated. Other than obligations recorded as liabilities at the time of divestiture, we have not made significant payments for these indemnifications. We believe that if we were to incur a loss on any of these matters, the loss would not have a material effect on our financial position, results of operations or cash flows.
In certain situations, we guarantee loans for suppliers and customers The total amount of guarantees issued under such arrangements is not material
Off-Balance Sheet Arrangements
We do not have off-balance sheet financing arrangements, including variable interest entities, under FIN 46, "Consolidation of Variable nterest Entities," that have a material impact on our financia statements.
Purchase Commitments
We have purchase commitments for materials, supplies, services and property, plant and equipment as part of the normal course of business. Commitments made under take-or-pay obligations are as follows: 2008–$1,360; 2009–$914; 2010–$634; 2011–$459; 2012–$394 and $660 thereafter. Such amounts represent future purchases in line with expected usage to obtain favorable pricing Approximately 44% of our purchase commitments relate to service contracts for information technology, human resources management and facilities management activities that were outsourced in recent years. Due to the proprietary nature of many of our materials and processes, certain supply contracts contain penalty provisions for early termination. We do not expect to incur penalty payments under these provisions that would materially affect our financial condition, cash flows or results of operations
Operating Leases
We lease certain property and equipment for varying periods. Future minimum rental commitments under noncancelable operating leases are as follows: 2008–$316; 2009–$238; 2010–$208; 2011–$174; 2012–$102 and $408 thereafter. Operating lease obligations are shown net of guaranteed sublease income
Litigation
We are subject to various lawsuits and claims with respect to matters such as governmental regulations, income taxes and other actions arising out of the normal course of business. While considerable uncertainty exists, in the opinion of management and our counsel, the ultimate resolution of the various lawsuits and claims will not materially affect our financial condition, cash flows or results of operations
We are also subject to contingencies pursuant to environmental laws and regulations that in the future may require us to take action to correct the effects on the environment of prior manufacturing and waste disposal practices. Based on currently available information, we do not believe the ultimate resolution of environmental remediation will have a material adverse effect on our financial position, cash flows or results of operations
SEGMENT INFORMATION
Through fiscal year 2007, we were organized under three Global Business Units as follows:
Beauty and Health includes the Beauty and the Health Care businesses. Beauty includes retail and professional hair care, skin care, feminine care, cosmetics, prestige fragrances, deodorants, and personal cleansing. Health Care includes oral care, persona health care and pharmaceuticals
Household Care includes the Fabric Care and Home Care, the Baby Care and Family Care and the Snacks, Coffee and Pet Care businesses. Fabric Care and Home Care includes laundry detergents, fabric enhancers, dish care, surface care, air care and commercia products. Baby Care and Family Care includes diapers, baby wipes, bath tissue and kitchen towels. Snacks, Coffee and Pet Care includes snacks, coffee and pet food
Gillette GBU includes the Blades and Razors and the Duracell and Braun businesses. Blades and Razors includes men's and women's blades and razors. Duracell and Braun includes batteries, electric razors and small appliances
Under U.S. GAAP, we have seven reportable segments: Beauty; Health Care; Fabric Care and Home Care; Baby Care and Family Care; Snacks, Coffee and Pet Care; Blades and Razors; and Duracell and Braun The accounting policies of the businesses are generally the same as those described in Note 1. Differences between these policies and U.S. GAAP primarily reflect: income taxes, which are reflected in the businesses using applicable blended statutory rates; the recording of fixed assets at historical exchange rates in certain high-inflation economies and the treatment of certain unconsolidated investees Certain unconsolidated investees are managed as integral parts of our business units for management reporting purposes. Accordingly, these partially owned operations are reflected as consolidated subsidiaries in segment results, with 100% recognition of the individual income statement line items through before-tax earnings. Eliminations to adjust these line items to U.S. GAAP are included in Corporate. In determining after-tax earnings for the businesses, we eliminate the share of earnings applicable to other ownership interests, in a manner similar to minority interest, and apply statutory tax rates. Adjustments to arrive at our effective tax rate are also included in Corporate
Corporate includes certain operating and non-operating activities that are not reflected in the operating results used internally to measure and evaluate the businesses, as well as eliminations to adjust management reporting principles to U.S. GAAP. Operating activities in Corporate include the results of incidental businesses managed at the corporate level along with the elimination of individual revenues and expenses generated by certain unconsolidated investees discussed in the preceding paragraph over which we exert significant influence, but do not control. Operating elements also comprise certain employee benefit costs, the costs of certain restructuring-type activities to maintain a competitive cost structure, including manufacturing and workforce rationalization, and other general corporate items. The non-operating elements primarily include interest expense, divestiture gains and interest and investing income. In addition, Corporate includes the historical results of certain divested businesses, including certain Gillette brands that were divested in 2006 as required by the regulatory authorities in relation to the Gillette acquisition and the Juice business, which was divested in August of 2004. Corporate assets primarily include cash, investment securities and all goodwill.
We had net sales in the U.S. of $31.9, $29.5 and $25.3 billion for the years ended June 30, 2007, 2006 and 2005, respectively. Assets in the U.S. totaled $73.5 and $75.4 billion as of June 30, 2007 and 2006, respectively.
Our largest customer, Wal-Mart Stores, Inc. and its affiliates, accounted for 15% of consolidated net sales in both 2007 and 2006, and 16% of consolidated net sales in 2005.
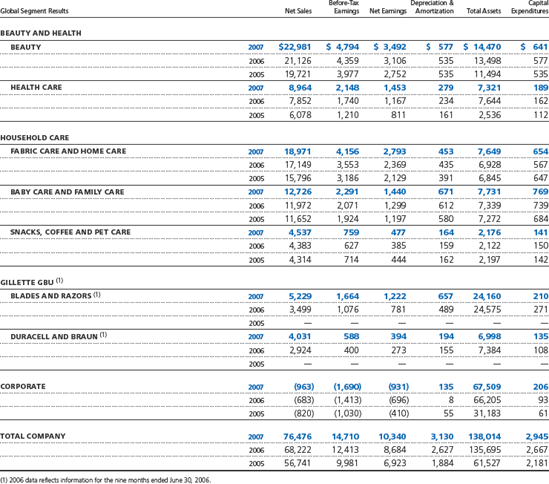
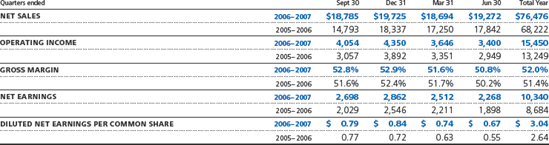
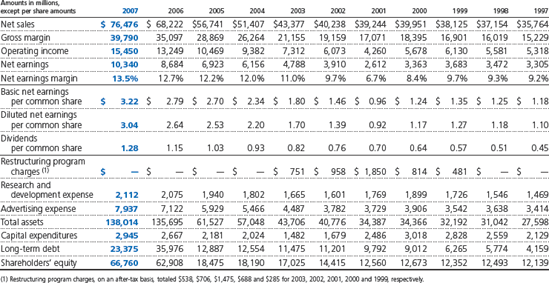
The following graphs compare the five-year and ten-year cumulative total return of P&G's common stock as compared with the S&P 500 Stock Index, the Dow Jones Industrial Average Index, and a composite group comprised of the S&P Household Products Index, the S&P Paper Products Index, the S&P Personal Products Index, the S&P Health Care Index and the S&P Food Index. The composite group is weighted based on P&G's current fiscal year revenues. The graphs assume that $100 was invested on June 30, 2002, and June 30, 1997, in each of the investment options and that all dividends were reinvested.
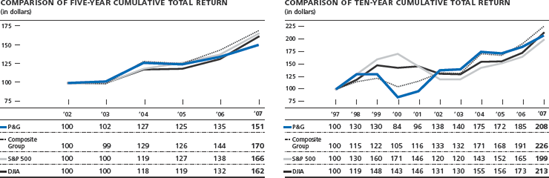
FASB Codification References
FASB ASC 320-10-35-1. [Predecessor literature: "Accounting for Certain Investments in Debt and Equity Securities," Statement of Financial Accounting Standards No. 115 (Norwalk, Conn.: FASB, 1993).]
FASB ASC 825-10-25-1. [Predecessor literature: "The Fair Value Option for Financial Assets and Liabilities, Including an Amendment of FASB Statement No. 115," Statement of Financial Accounting Standards No. 159 (Norwalk, Conn.: FASB, February 2007).]
FASB ASC 470-10-05-6. [Predecessor literature: "Classification of Short-term Obligations Expected to Be Refinanced," Statement of Financial Accounting Standards No. 6 (Stamford, Conn.: FASB, 1975).]
FASB ASC 505-10-50. [Predecessor literature: "Disclosure of Information about Capital Structure," Statement of Financial Accounting Standards No. 129 (Norwalk: FASB, 1997), par. 4).]
FASB ASC 235-10-05. [Predecessor literature: "Disclosure of Accounting Policies," Opinions of the Accounting Principles Board No. 22 (New York: AICPA, 1972).]
FASB ASC 275-10-05. [Predecessor literature: "Disclosure of Certain Significant Risks and Uncertainties," Statement of Position 94-6 (New York: AICPA, 1994).]
FASB ASC 820-10-15. [Predecessor literature: "Fair Value Measurement," Statement of Financial Accounting Standards No. 157 (Norwalk, Conn.: FASB, September 2006).]
FASB ASC 230-10-05. [Predecessor literature: "Statement of Cash Flows," Statement of Financial Accounting Standards No. 95 (Stamford, Conn.: FASB, 1987).]
How does information from the balance sheet help users of the financial statements?
What is meant by solvency? What information in the balance sheet can be used to assess a company's solvency?
A recent financial magazine indicated that the airline industry has poor financial flexibility. What is meant by financial flexibility, and why is it important?
Discuss at least two situations in which estimates could affect the usefulness of information in the balance sheet.
Perez Company reported an increase in inventories in the past year. Discuss the effect of this change on the current ratio (current assets ÷ current liabilities). What does this tell a statement user about Perez Company's liquidity?
What is meant by liquidity? Rank the following assets from one to five in order of liquidity.
What are the major limitations of the balance sheet as a source of information?
Discuss at least two items that are important to the value of companies like Intel or IBM but that are not recorded in their balance sheets. What are some reasons why these items are not recorded in the balance sheet?
How does separating current assets from property, plant, and equipment in the balance sheet help analysts?
In its December 31, 2010, balance sheet Oakley Corporation reported as an asset, "Net notes and accounts receivable, $7,100,000." What other disclosures are necessary?
Should available-for-sale securities always be reported as a current asset? Explain.
What is the relationship between current assets and current liabilities?
The New York Knicks, Inc. sold 10,000 season tickets at $2,000 each. By December 31, 2010, 16 of the 40 home games had been played. What amount should be reported as a current liability at December 31, 2010?
What is working capital? How does working capital relate to the operating cycle?
In what section of the balance sheet should the following items appear, and what balance sheet terminology would you use?
Treasury stock (recorded at cost).
Checking account at bank.
Land (held as an investment).
Sinking fund.
Unamortized premium on bonds payable.
Copyrights.
Pension fund assets.
Premium on capital stock.
Long-term investments (pledged against bank loans payable).
Where should the following items be shown on the balance sheet, if shown at all?
Allowance for doubtful accounts receivable.
Merchandise held on consignment.
Advances received on sales contract.
Cash surrender value of life insurance.
Land.
Merchandise out on consignment.
Franchises.
Accumulated depreciation of plant and equipment.
Materials in transit—purchased f.o.b. destination.
State the generally accepted accounting principle applicable to the balance sheet valuation of each of the following assets.
Trade accounts receivable.
Land.
Inventories.
Trading securities (common stock of other companies).
Prepaid expenses.
Refer to the definition of assets on page 180. Discuss how a leased building might qualify as an asset of the lessee (tenant) under this definition.
Kathleen Battle says, "Retained earnings should be reported as an asset, since it is earnings which are reinvested in the business." How would you respond to Battle?
The creditors of Chester Company agree to accept promissory notes for the amount of its indebtedness with a proviso that two-thirds of the annual profits must be applied to their liquidation. How should these notes be reported on the balance sheet of the issuing company? Give a reason for your answer.
What are some of the techniques of disclosure for the balance sheet?
What is a "Summary of Significant Accounting Policies"?
What types of contractual obligations must be disclosed in great detail in the notes to the balance sheet? Why do you think these detailed provisions should be disclosed?
What is the profession's recommendation in regard to the use of the term "surplus"? Explain.
What is the purpose of a statement of cash flows? How does it differ from a balance sheet and an income statement?
The net income for the year for Genesis, Inc. is $750,000, but the statement of cash flows reports that the cash provided by operating activities is $640,000. What might account for the difference?
Net income for the year for Carrie, Inc. was $750,000, but the statement of cash flows reports that cash provided by operating activities was $860,000. What might account for the difference?
Differentiate between operating activities, investing activities, and financing activities.
Each of the following items must be considered in preparing a statement of cash flows. Indicate where each item is to be reported in the statement, if at all. Assume that net income is reported as $90,000.
Accounts receivable increased from $34,000 to $39,000 from the beginning to the end of the year.
During the year, 10,000 shares of preferred stock with a par value of $100 a share were issued at $115 per share.
Depreciation expense amounted to $14,000, and bond premium amortization amounted to $5,000.
Land increased from $10,000 to $30,000.
Sergey Co. has net cash provided by operating activities of $1,200,000. Its average current liabilities for the period are $1,000,000, and its average total liabilities are $1,500,000. Comment on the company's liquidity and financial flexibility, given this information.
Net income for the year for Tanizaki, Inc. was $750,000, but the statement of cash flows reports that cash provided by operating activities was $860,000. Tanizaki also reported capital expenditures of $75,000 and paid dividends in the amount of $30,000. Compute Tanizaki's free cash flow.
What is the purpose of a free cash flow analysis?

Net income
$40,000
Dividends paid
5,000
Increase in accounts receivable
10,000
Increase in accounts payable
7,000
Purchase of equipment (capital expenditure)
8,000
Depreciation expense
4,000
Issue of notes payable
20,000
Compute net cash provided by operating activities, the net change in cash during the year, and free cash flow.
Sale of land and building
$191,000
Purchase of treasury stock
40,000
Purchase of land
37,000
Payment of cash dividend
95,000
Purchase of equipment
53,000
Issuance of common stock
147,000
Retirement of bonds
100,000
Compute the net cash provided (used) by investing activities.
Investment in Preferred Stock.
Treasury Stock.
Common Stock.
Cash Dividends Payable.
Accumulated Depreciation.
Warehouse in Process of Construction.
Petty Cash.
Accrued Interest on Notes Payable.
Deficit.
Trading Securities.
Income Taxes Payable.
Unearned Subscription Revenue.
Work in Process.
Accrued Vacation Pay.
Instructions
For each of the accounts above, indicate the proper balance sheet classification. In the case of borderline items, indicate the additional information that would be required to determine the proper classification.
Current assets.
Investments.
Property, plant, and equipment.
Intangible assets.
Other assets.
Current liabilities.
Non-current liabilities.
Capital stock.
Additional paid-in capital.
Retained earnings.
Instructions
Indicate by letter where each of the following items would be classified.
Preferred stock.
Goodwill.
Wages payable.
Trade accounts payable.
Buildings.
Trading securities.
Current portion of long-term debt.
Premium on bonds payable.
Allowance for doubtful accounts.
Accounts receivable.
Cash surrender value of life insurance.
Notes payable (due next year).
Office supplies.
Common stock.
Land.
Bond sinking fund.
Merchandise inventory.
Prepaid insurance.
Bonds payable.
Taxes payable.
Current assets.
Investments.
Property, plant, and equipment.
Intangible assets.
Other assets.
Current liabilities.
Long-term liabilities.
Capital stock.
Paid-in capital in excess of par.
Retained earnings.
Instructions
Indicate by letter how each of the following usually should be classified. If an item should appear in a note to the financial statements, use the letter "N" to indicate this fact. If an item need not be reported at all on the balance sheet, use the letter "X."
Unexpired insurance.
Stock owned in affiliated companies.
Unearned subscriptions revenue.
Advances to suppliers.
Unearned rent revenue.
Preferred stock.
Additional paid-in capital on preferred stock.
Copyrights.
Petty cash fund.
Sales tax payable.
Accrued interest on notes receivable.
Twenty-year issue of bonds payable that will mature within the next year. (No sinking fund exists, and refunding is not planned.)
Machinery retired from use and held for sale.
Fully depreciated machine still in use.
Accrued interest on bonds payable.
Salaries that company budget shows will be paid to employees within the next year.
Discount on bonds payable. (Assume related to bonds payable in No. 12.)
Accumulated depreciation.
Common Stock.
Discount on Bonds Payable.
Treasury Stock (at cost).
Note Payable, short-term.
Raw Materials.
Preferred Stock Investments—Long-term.
Unearned Rent Revenue.
Work in Process.
Copyrights.
Buildings.
Notes Receivable (short-term).
Cash.
Accrued Salaries Payable.
Accumulated Depreciation—Buildings.
Cash Restricted for Plant Expansion.
Land Held for Future Plant Site.
Allowance for Doubtful Accounts—Accounts Receivable.
Retained Earnings.
Paid-in Capital in Excess of Par—Common Stock.
Unearned Subscriptions Revenue.
Receivables—Officers (due in one year).
Finished Goods.
Accounts Receivable.
Bonds Payable (due in 4 years).
Instructions
Prepare a classified balance sheet in good form. (No monetary amounts are necessary.)
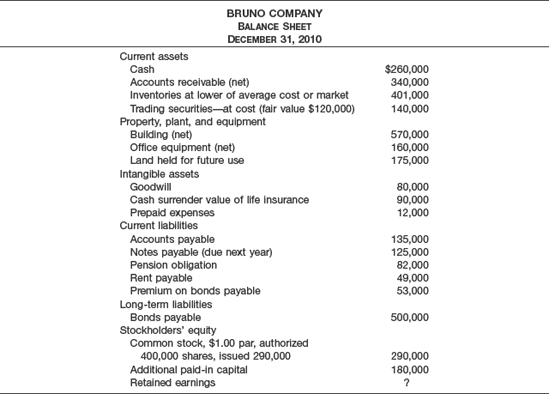
Instructions
Prepare a revised balance sheet given the available information. Assume that the accumulated depreciation balance for the buildings is $160,000 and for the office equipment, $105,000. The allowance for doubtful accounts has a balance of $17,000. The pension obligation is considered a long-term liability.
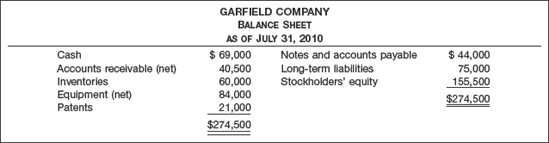
The following additional information is provided.
Cash includes $1,200 in a petty cash fund and $12,000 in a bond sinking fund.
The net accounts receivable balance is comprised of the following three items: (a) accounts receivable—debit balances $52,000; (b) accounts receivable—credit balances $8,000; (c) allowance for doubtful accounts $3,500.
Merchandise inventory costing $5,300 was shipped out on consignment on July 31, 2010. The ending inventory balance does not include the consigned goods. Receivables in the amount of $5,300 were recognized on these consigned goods.
Equipment had a cost of $112,000 and an accumulated depreciation balance of $28,000.
Taxes payable of $9,000 were accrued on July 31. Garfield Company, however, had set up a cash fund to meet this obligation. This cash fund was not included in the cash balance, but was offset against the taxes payable amount.
Instructions
Prepare a corrected classified balance sheet as of July 31, 2010, from the available information, adjusting the account balances using the additional information.
Finished Goods
$ 52,000
Cost of Goods Sold
$2,100,000
Revenue Received in Advance
90,000
Notes Receivable
40,000
Equipment
253,000
Accounts Receivable
161,000
Work-in-Process
34,000
Raw Materials
187,000
Cash
42,000
Supplies Expense
60,000
Short-term Investments in Stock
31,000
Allowance for Doubtful Accounts
12,000
Customer Advances
36,000
Licenses
18,000
Cash Restricted for Plant Expansion
50,000
Additional Paid-in Capital
88,000
Treasury Stock
22,000
The following additional information is available.
Inventories are valued at lower of cost or market using LIFO.
Equipment is recorded at cost. Accumulated depreciation, computed on a straight-line basis, is $50,600.
The short-term investments have a fair value of $29,000. (Assume they are trading securities.)
The notes receivable are due April 30, 2012, with interest receivable every April 30. The notes bear interest at 6%. (Hint: Accrue interest due on December 31, 2010.)
The allowance for doubtful accounts applies to the accounts receivable. Accounts receivable of $50,000 are pledged as collateral on a bank loan.
Licenses are recorded net of accumulated amortization of $14,000.
Treasury stock is recorded at cost.
Instructions
Prepare the current assets section of Aramis Company's December 31, 2010, balance sheet, with appropriate disclosures.
On December 15, 2010, Pascal declared a cash dividend of $2.00 per share to stockholders of record on December 31. The dividend is payable on January 15, 2011. Pascal has issued 1,000,000 shares of common stock, of which 50,000 shares are held in treasury.
At December 31, bonds payable of $100,000,000 are outstanding. The bonds pay 10% interest every September 30 and mature in installments of $25,000,000 every September 30, beginning September 30, 2011.
At December 31, 2009, customer advances were $12,000,000. During 2010, Pascal collected $30,000,000 of customer advances, and advances of $25,000,000 were earned.
Instructions
For each item above indicate the dollar amounts to be reported as a current liability and as a long-term liability, if any.
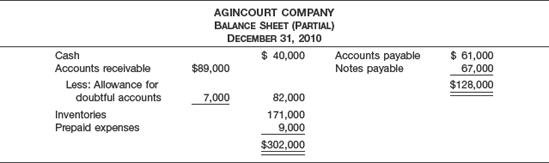
The following errors in the corporation's accounting have been discovered:
January 2011 cash disbursements entered as of December 2010 included payments of accounts payable in the amount of $35,000, on which a cash discount of 2% was taken.
The inventory included $27,000 of merchandise that had been received at December 31 but for which no purchase invoices had been received or entered. Of this amount, $10,000 had been received on consignment; the remainder was purchased f.o.b. destination, terms 2/10, n/30.
Sales for the first four days in January 2011 in the amount of $30,000 were entered in the sales book as of December 31, 2010. Of these, $21,500 were sales on account and the remainder were cash sales.
Cash, not including cash sales, collected in January 2011 and entered as of December 31, 2010, totaled $35,324. Of this amount, $23,324 was received on account after cash discounts of 2% had been deducted; the remainder represented the proceeds of a bank loan.
Instructions
Restate the current assets and current liabilities sections of the balance sheet in accordance with good accounting practice. (Assume that both accounts receivable and accounts payable are recorded gross.)
State the net effect of your adjustments on Agincourt Company's retained earnings balance.
On December 20, 2010, an employee filed a legal action against Arnold for $100,000 for wrongful dismissal. Management believes the action to be frivolous and without merit. The likelihood of payment to the employee is remote.
Bonuses to key employees based on net income for 2010 are estimated to be $150,000.
On December 1, 2010, the company borrowed $900,000 at 8% per year. Interest is paid quarterly.
Credit sales for the year amounted to $10,000,000. Arnold's expense provision for doubtful accounts is estimated to be 2% of credit sales.
On December 15, 2010, the company declared a $2.00 per share dividend on the 40,000 shares of common stock outstanding, to be paid on January 5, 2011.
During the year, customer advances of $160,000 were received; $50,000 of this amount was earned by December 31, 2010.
Instructions
For each item above, indicate the dollar amount to be reported as a current liability. If a liability is not reported, explain why.
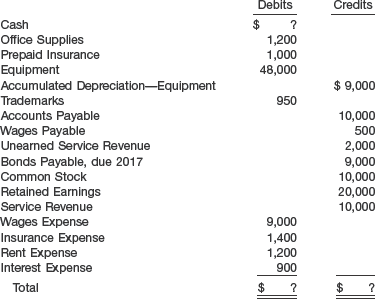
Additional information:
Net loss for the year was $2,500.
No dividends were declared during 2010.
Instructions
Prepare a classified balance sheet as of December 31, 2010.
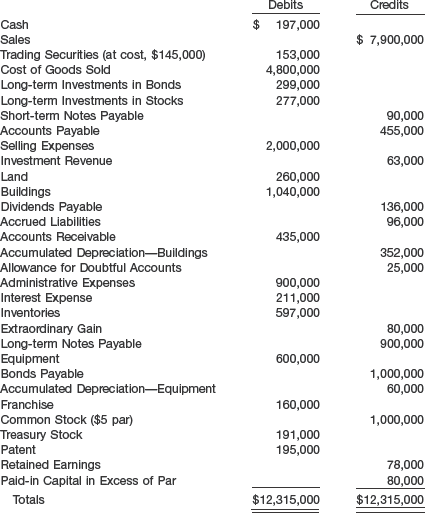
Instructions
Prepare a balance sheet at December 31, 2010, for Vivaldi Corporation. Ignore income taxes.
Operating activity—add to net income.
Operating activity—deduct from net income.
Investing activity.
Financing activity.
Reported as significant noncash activity.
The transactions are as follows.
Issuance of capital stock.
Purchase of land and building.
Redemption of bonds.
Sale of equipment.
Depreciation of machinery.
Amortization of patent.
Issuance of bonds for plant assets.
Payment of cash dividends.
Exchange of furniture for office equipment.
Purchase of treasury stock.
Loss on sale of equipment.
Increase in accounts receivable during the year.
Decrease in accounts payable during the year.
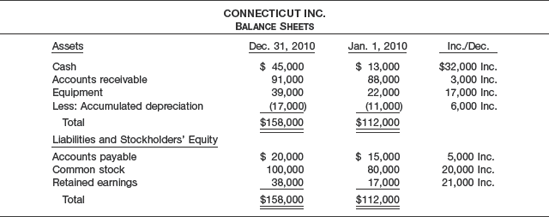
Net income of $34,000 was reported, and dividends of $13,000 were paid in 2010. New equipment was purchased and none was sold.
Instructions
Prepare a statement of cash flows for the year 2010.
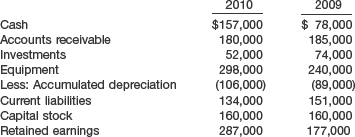
Additional information:
Investments were sold at a loss (not extraordinary) of $7,000; no equipment was sold; cash dividends paid were $50,000; and net income was $160,000.
Instructions
Prepare a statement of cash flows for 2010 for Sondergaard Corporation.
Determine Sondergaard Corporation's free cash flow.
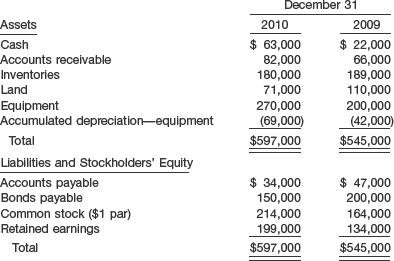
Additional information:
Net income for 2010 was $105,000.
Cash dividends of $40,000 were declared and paid.
Bonds payable amounting to $50,000 were retired through issuance of common stock.
Instructions
Prepare a statement of cash flows for 2010 for Orozco Corporation.
Determine Orozco Corporation's current cash debt coverage ratio, cash debt coverage ratio, and free cash flow. Comment on its liquidity and financial flexibility.
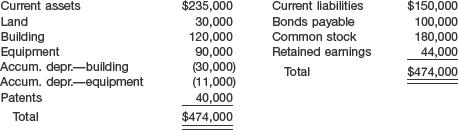
The following information is available for 2010.
Net income was $55,000.
Equipment (cost $20,000 and accumulated depreciation $8,000) was sold for $9,000.
Depreciation expense was $4,000 on the building and $9,000 on equipment.
Patent amortization was $2,500.
Current assets other than cash increased by $25,000. Current liabilities increased by $13,000.
An addition to the building was completed at a cost of $27,000.
A long-term investment in stock was purchased for $16,000.
Bonds payable of $50,000 were issued.
Cash dividends of $25,000 were declared and paid.
Treasury stock was purchased at a cost of $11,000.
Instructions
(Show only totals for current assets and current liabilities.)
Prepare a statement of cash flows for 2010.
Prepare a balance sheet at December 31, 2010.
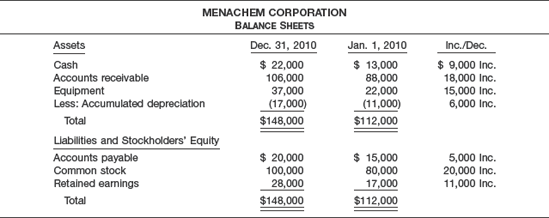
Net income of $34,000 was reported, and dividends of $23,000 were paid in 2010. New equipment was purchased and none was sold.
Instructions
Prepare a statement of cash flows for the year 2010.
Compute the current ratio (current assets ÷ current liabilities) as of January 1, 2010, and December 31, 2010, and compute free cash flow for the year 2010.
In light of the analysis in (b), comment on Menachem's liquidity and financial flexibility.
Accounts Receivable
Accrued Wages
Accumulated Depreciation—Buildings
Accumulated Depreciation—Equipment
Advances to Employees
Advertising Expense
Allowance for Doubtful Accounts
Bond Sinking Fund
Bonds Payable
Building
Cash in Bank
Cash on Hand
Cash Surrender Value of Life Insurance
Commission Expense
Common Stock
Copyright
Dividends Payable
Equipment
Gain on Sale of Equipment
Interest Receivable
Inventory—Beginning
Inventory—Ending
Land
Land for Future Plant Site
Loss from Flood
Notes Payable (due next year)
Patent
Payroll Taxes Payable
Pension Obligations
Petty Cash
Preferred Stock
Premium on Bonds Payable
Paid-in Capital in Excess of Par—Preferred Stock
Prepaid Rent
Purchases
Purchase Returns and Allowances
Retained Earnings
Sales
Sales Discounts
Sales Salaries
Trading Securities
Transportation-in
Treasury Stock (at cost)
Unearned Subscriptions Revenue
Instructions
Prepare a classified balance sheet in good form. (No monetary amounts are to be shown.)
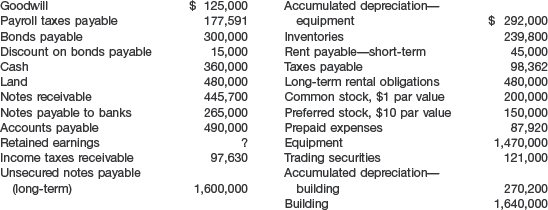
Instructions
Prepare a classified balance sheet in good form. Common stock authorized was 400,000 shares, and preferred stock authorized was 20,000 shares. Assume that notes receivable and notes payable are short-term, unless stated otherwise. Cost and fair value of trading securities are the same.
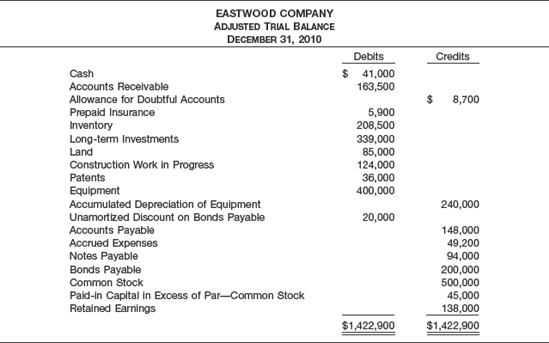
Additional information:
The LIFO method of inventory value is used.
The cost and fair value of the long-term investments that consist of stocks and bonds is the same.
The amount of the Construction Work in Progress account represents the costs expended to date on a building in the process of construction. (The company rents factory space at the present time.) The land on which the building is being constructed cost $85,000, as shown in the trial balance.
The patents were purchased by the company at a cost of $40,000 and are being amortized on a straight-line basis.
Of the unamortized discount on bonds payable, $2,000 will be amortized in 2011.
The notes payable represent bank loans that are secured by long-term investments carried at $120,000. These bank loans are due in 2011.
The bonds payable bear interest at 8% payable every December 31, and are due January 1, 2021.
600,000 shares of common stock of a par value of $1 were authorized, of which 500,000 shares were issued and outstanding.
Instructions
Prepare a balance sheet as of December 31, 2010, so that all important information is fully disclosed.
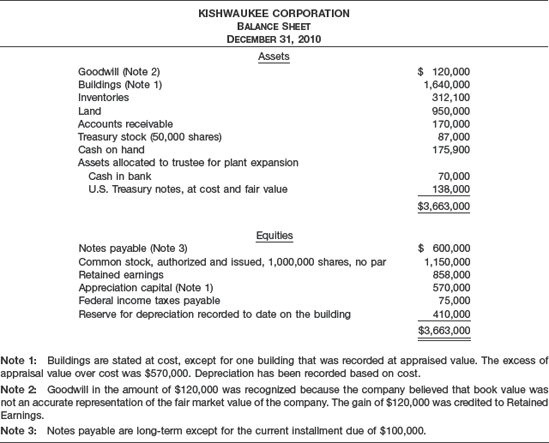
Instructions
Prepare a corrected classified balance sheet in good form. The notes above are for information only.
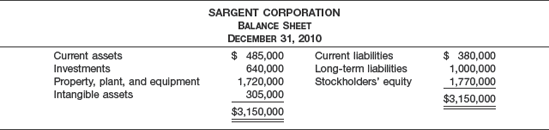
The following information is presented.
The current assets section includes: cash $150,000, accounts receivable $170,000 less $10,000 for allowance for doubtful accounts, inventories $180,000, and unearned revenue $5,000. Inventories are stated on the lower of FIFO cost or market.
The investments section includes: the cash surrender value of a life insurance contract $40,000; investments in common stock, short-term (trading) $80,000 and long-term (available-for-sale) $270,000, and bond sinking fund $250,000. The cost and fair value of investments in common stock are the same.
Property, plant, and equipment includes: buildings $1,040,000 less accumulated depreciation $360,000; equipment $450,000 less accumulated depreciation $180,000; land $500,000; and land held for future use $270,000.
Intangible assets include: a franchise $165,000; goodwill $100,000; and discount on bonds payable $40,000.
Current liabilities include: accounts payable $140,000; notes payable—short-term $80,000 and long-term $120,000; and taxes payable $40,000.
Long-term liabilities are composed solely of 7% bonds payable due 2018.
Stockholders' equity has: preferred stock, no par value, authorized 200,000 shares, issued 70,000 shares for $450,000; and common stock, $1.00 par value, authorized 400,000 shares, issued 100,000 shares at an average price of $10. In addition, the corporation has retained earnings of $320,000.
Instructions
Prepare a balance sheet in good form, adjusting the amounts in each balance sheet classification as affected by the information given above.

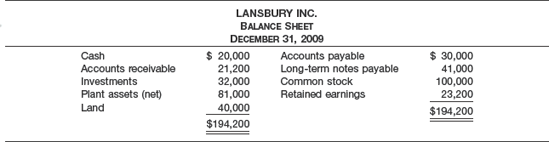
During 2010 the following occurred.
Lansbury Inc. sold part of its investment portfolio for $15,000. This transaction resulted in a gain of $3,400 for the firm. The company classifies its investments as available-for-sale.
A tract of land was purchased for $18,000 cash.
Long-term notes payable in the amount of $16,000 were retired before maturity by paying $16,000 cash.
An additional $20,000 in common stock was issued at par.
Dividends totalling $8,200 were declared and paid to stockholders.
Net income for 2010 was $32,000 after allowing for depreciation of $11,000.
Land was purchased through the issuance of $30,000 in bonds.
At December 31, 2010, Cash was $32,000, Accounts Receivable was $41,600, and Accounts Payable remained at $30,000.
Instructions
Prepare a statement of cash flows for 2010.
Prepare an unclassified balance sheet as it would appear at December 31, 2010.
How might the statement of cash flows help the user of the financial statements? Compute two cash flow ratios.

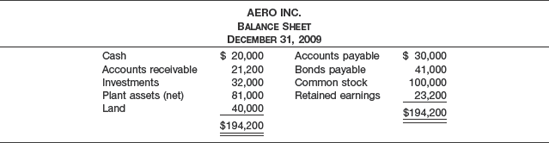
During 2010 the following occurred.
Aero liquidated its available-for-sale investment portfolio at a loss of $5,000.
A tract of land was purchased for $38,000.
An additional $30,000 in common stock was issued at par.
Dividends totaling $10,000 were declared and paid to stockholders.
Net income for 2010 was $35,000, including $12,000 in depreciation expense.
Land was purchased through the issuance of $30,000 in additional bonds.
At December 31, 2010, Cash was $70,200, Accounts Receivable was $42,000, and Accounts Payable was $40,000.
Instructions
Prepare a statement of cash flows for the year 2010 for Aero.
Prepare the balance sheet as it would appear at December 31, 2010.
Compute Aero's free cash flow and the current cash debt coverage ratio for 2010.
Use the analysis of Aero to illustrate how information in the balance sheet and statement of cash flows helps the user of the financial statements.
CA5-1 (Reporting the Financial Effects of Varied Transactions) In an examination of Arenes Corporation as of December 31, 2010, you have learned that the following situations exist. No entries have been made in the accounting records for these items.
The corporation erected its present factory building in 1995. Depreciation was calculated by the straight-line method, using an estimated life of 35 years. Early in 2010, the board of directors conducted a careful survey and estimated that the factory building had a remaining useful life of 25 years as of January 1, 2010.
An additional assessment of 2009 income taxes was levied and paid in 2010.
When calculating the accrual for officers' salaries at December 31, 2010, it was discovered that the accrual for officers' salaries for December 31, 2009, had been overstated.
On December 15, 2010, Arenes Corporation declared a cash dividend on its common stock outstanding, payable February 1, 2011, to the common stockholders of record December 31, 2010.
Instructions
Describe fully how each of the items above should be reported in the financial statements of Arenes Corporation for the year 2010.
CA5-2 (Current Asset and Liability Classification) Below are the titles of a number of debit and credit accounts as they might appear on the balance sheet of Hayduke Corporation as of October 31, 2010.
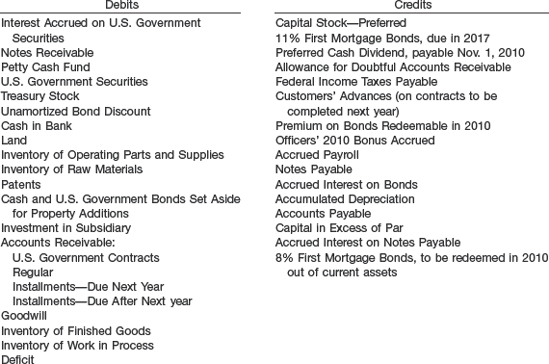
Instructions
Select the current asset and current liability items from among these debits and credits. If there appear to be certain borderline cases that you are unable to classify without further information, mention them and explain your difficulty, or give your reasons for making questionable classifications, if any.
(AICPA adapted)
CA5-3 (Identifying Balance Sheet Deficiencies) The assets of Fonzarelli Corporation are presented on the next page (000s omitted).
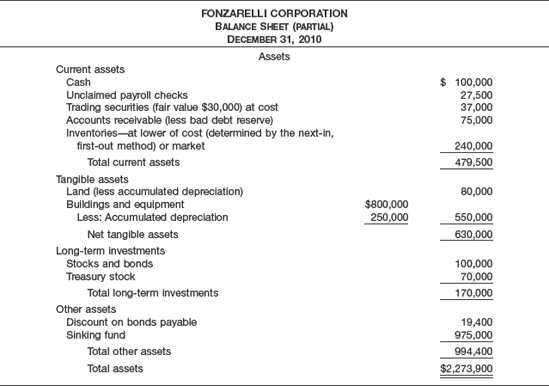
Instructions
Indicate the deficiencies, if any, in the foregoing presentation of Fonzarelli Corporation's assets.

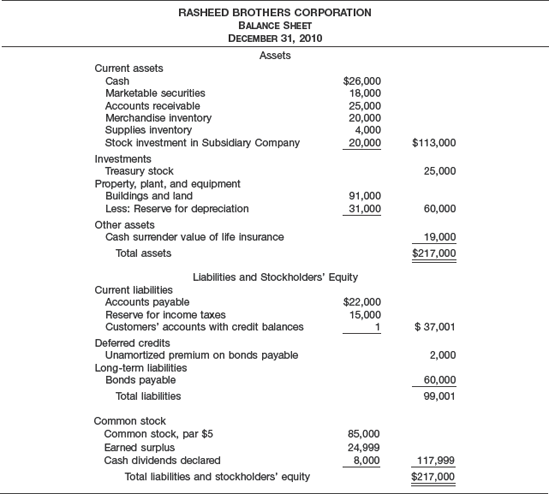
Instructions
Evaluate the balance sheet presented. State briefly the proper treatment of any item criticized.

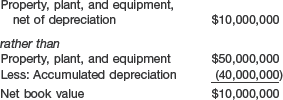
Instructions
Answer the following questions.
What are the ethical issues involved?
What should Keene do?
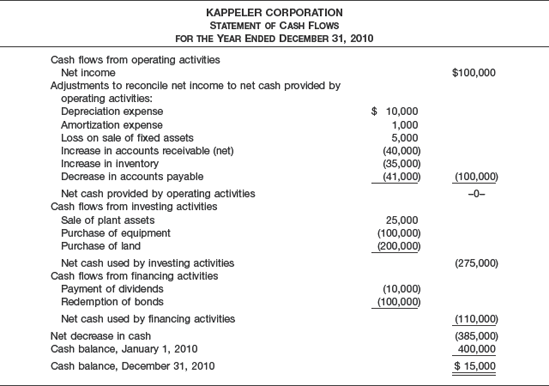
President Kappeler, CEO
Kappeler Corporation
125 Wall Street
Middleton, Kansas 67458
Dear Mr. Kappeler:
I have good news and bad news about the financial statements for the year ended December 31, 2010. The good news is that net income of $100,000 is close to what we predicted in the strategic plan last year, indicating strong performance this year. The bad news is that the cash balance is seriously low. Enclosed is the Statement of Cash Flows, which best illustrates how both of these situations occurred simultaneously ...
Instructions
Complete the letter to the CEO, including the four components requested by your boss.
The financial statements of P&G are presented in Appendix 5B or can be accessed at the book's companion website, www.wiley.com/college/kieso.
Instructions
What alternative formats could P&G have adopted for its balance sheet? Which format did it adopt?
Identify the various techniques of disclosure P&G might have used to disclose additional pertinent financial information. Which technique does it use in its financials?
In what classifications are P&G's investments reported? What valuation basis does P&G use to report its investments? How much working capital did P&G have on June 30, 2007? On June 30, 2006?
What were P&G's cash flows from its operating, investing, and financing activities for 2007? What were its trends in net cash provided by operating activities over the period 2005 to 2007? Explain why the change in accounts payable and in accrued and other liabilities is added to net income to arrive at net cash provided by operating activities.
Compute P&G's (1) current cash debt coverage ratio, (2) cash debt coverage ratio, and (3) free cash flow for 2007. What do these ratios indicate about P&G's financial condition?
Instructions
Go to the book's companion website and use information found there to answer the following questions related to The Coca-Cola Company and PepsiCo, Inc.
How much working capital did each of these companies have at the end of 2007? Speculate as to their rationale for the amount of working capital they maintain.
What is the most significant difference in the asset structure of the two companies? What causes this difference?
What are the companies' annual and 5-year (2003–2007) growth rates in total assets and long-term debt?
What were these two companies' trends in net cash provided by operating activities over the period 2005 to 2007?
Compute both companies' (1) current cash debt coverage ratio, (2) cash debt coverage ratio, and (3) free cash flow. What do these ratios indicate about the financial condition of the two companies?
Uniroyal Technology Corporation (UTC), with corporate offices in Sarasota, Florida, is organized into three operating segments. The high-performance plastics segment is responsible for research, development, and manufacture of a wide variety of products, including orthopedic braces, graffiti-resistant seats for buses and airplanes, and a static-resistant plastic used in the central processing units of microcomputers. The coated fabrics segment manufactures products such as automobile seating, door and instrument panels, and specialty items such as waterproof seats for personal watercraft and stain-resistant, easy-cleaning upholstery fabrics. The foams and adhesives segment develops and manufactures products used in commercial roofing applications.
The following items relate to operations in a recent year.
Serious pressure was placed on profitability by sharply increasing raw material prices. Some raw materials increased in price 50% during the past year. Cost containment programs were instituted and product prices were increased whenever possible, which resulted in profit margins actually improving over the course of the year.
The company entered into a revolving credit agreement, under which UTC may borrow the lesser of $15,000,000 or 80% of eligible accounts receivable. At the end of the year, approximately $4,000,000 was outstanding under this agreement. The company plans to use this line of credit in the upcoming year to finance operations and expansion.
Instructions
Should investors be informed of raw materials price increases, such as described in item 1? Does the fact that the company successfully met the challenge of higher prices affect the answer? Explain.
How should the information in item 2 be presented in the financial statements of UTC?
Sherwin-Williams, based in Cleveland, Ohio, manufactures a wide variety of paint and other coatings, which are marketed through its specialty stores and in other retail outlets. The company also manufactures paint for automobiles. The Automotive Division has had financial difficulty. During a recent year, five branch locations of the Automotive Division were closed, and new management was put in place for the branches remaining.
The following titles were shown on Sherwin-Williams's balance sheet for that year.
Accounts payable
Accounts receivable, less allowance
Accrued taxes
Buildings
Cash and cash equivalents
Common stock
Employee compensation payable
Finished goods inventories
Intangibles and other assets
Land
Long-term debt
Machinery and equipment
Other accruals
Other capital
Other current assets
Other long-term liabilities
Postretirement obligations other than pensions
Retained earnings
Short-term investments
Taxes payable
Work in process and raw materials inventories
Instructions
Organize the accounts in the general order in which they would have been presented in a classified balance sheet.
When several of the branch locations of the Automotive Division were closed, what balance sheet accounts were most likely affected? Did the balance in those accounts decrease or increase?
Presented below is the SEC-mandated disclosure of contractual obligations provided by Deere & Company in its 2007 annual report. Deere & Company reported current assets of $27,208 and total current liabilities of $15,922 at October 31, 2007. All dollars are in millions.
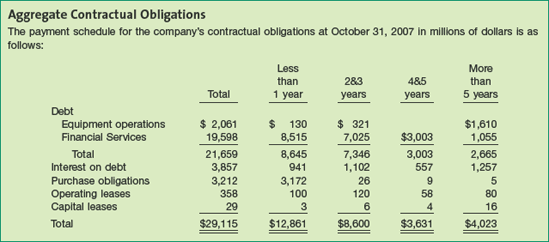
Instructions
Compute Deere & Company's working capital and current ratio (current assets ÷ current liabilities) with and without the contractual obligations reported in the schedule.
Briefly discuss how the information provided in the contractual obligation disclosure would be useful in evaluating Deere & Company for loans: (1) due in one year, (2) due in five years.
The incredible growth of Amazon.com has put fear into the hearts of traditional retailers. Amazon's stock price has soared to amazing levels. However, it is often pointed out in the financial press that the company did not report its first profit until 2003. The following financial information is taken from Amazon's 2006 financial statements.
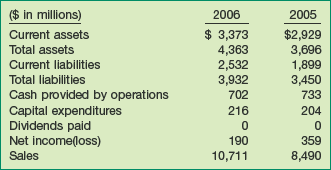
Instructions
Calculate free cash flow for Amazon for 2006 and 2005 and discuss its ability to finance expansion from internally generated cash. Thus far Amazon has avoided purchasing large warehouses. Instead, it has used those of others. It is possible, however, that in order to increase customer satisfaction the company may have to build its own warehouses. If this happens, how might your impression of its ability to finance expansion change?
Discuss any potential implications of the change in Amazon's cash provided by operations from 2005 to 2006.
Presented below is the balance sheet for Tomkins PLC, a British company.
Instructions
Identify at least three differences in balance sheet reporting between British and U.S. firms, as shown in Tomkins's balance sheet.
Review Tomkins's balance sheet and identify how the format of this financial statement provides useful information, as illustrated in the chapter.
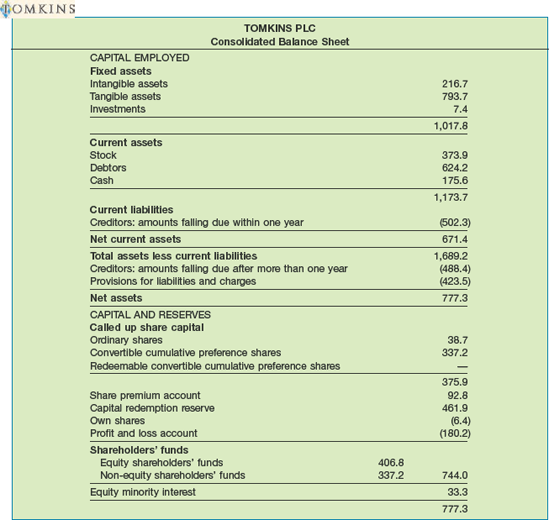
In light of the full disclosure principle, investors and creditors need to know the balances for assets, liabilities, and equity as well as the accounting policies adopted by management to measure the items reported in the balance sheet.
Instructions
Access the FASB Codification at http://asc.fasb.org/home to conduct research using the Codification Research System to prepare responses to the following items. Provide Codification references for your responses.
Identify the literature that addresses the disclosure of accounting policies.
How are accounting policies defined in the literature?
What are the three scenarios that would result in detailed disclosure of the accounting methods used?
What are some examples of common disclosures that are required under this statement?

[60] Accounting Trends and Techniques—2007 (New York: AICPA) indicates that approximately 97 percent of the companies surveyed used the term "balance sheet." The term "statement of financial position" is used infrequently, although it is conceptually appealing.
[61] Risk conveys the unpredictability of future events, transactions, circumstances, and results of the company.
[62] "Reporting Income, Cash Flows, and Financial Position of Business Enterprises,"Proposed Statement of Financial Accounting Concepts (Stamford, Conn.: FASB, 1981), par. 29.
[63] "Reporting Income, Cash Flows, and Financial Position of Business Enterprises,"Proposed Statement of Financial Accounting Concepts (Stamford, Conn.: FASB, 1981), par. 25.
[64] We discuss several of these omitted items (such as leases and other off-balance-sheet arrangements) in later chapters. See Wayne Upton, Jr., Special Report: Business and Financial Reporting, Challenges from the New Economy (Norwalk, Conn.: FASB, 2001).
[65] "Reporting Income, Cash Flows, and Financial Positions of Business Enterprises,"Proposed Statement of Financial Accounting Concepts (Stamford, Conn.: FASB, 1981), par. 51.
[66] "Elements of Financial Statements of Business Enterprises,"Statement of Financial Accounting Concepts No. 6 (Stamford, Conn.: FASB, 1985), paras. 25, 35, and 49.
[67] Under the fair value option, companies may elect to use fair value as the measurement basis for selected financial assets and liabilities. For these companies, some of their financial assets (and liabilities) may be recorded at historical cost, while others are recorded at fair value. [2]
[68] Accounting Trends and Techniques—2007 (New York: AICPA) in its survey of 600 annual reports identified 388 companies that reported prepaid expenses.
[69] Companies usually explain the pertinent rights and privileges of the various securities (both debt and equity) outstanding in the notes to the financial statements. Examples of information that companies should disclose are dividend and liquidation preferences, participation rights, call prices and dates, conversion or exercise prices or rates and pertinent dates, sinking fund requirements, unusual voting rights, and significant terms of contracts to issue additional shares. [4]
[70] Accounting Trends and Techniques—2007 (New York: AICPA) indicates that all of the 600 companies surveyed use either the "report form" (524) or the "account form" (76), sometimes collectively referred to as the "customary form."
[71] Level 3 fair value measurements may be developed using expected cash flow and present value techniques, as described in Statement of Financial Accounting Concepts No. 7, "Using Cash Flow Information and Present Value in Accounting," as discussed in Chapter 6.
[72] The FASB recommends the basis as "cash and cash equivalents." Cash equivalents are liquid investments that mature within three months or less.