
Now that your Galileo is connected to your Wyliodrin account, let's understand how to use it to extract data from our sensors. We'll be using the Visual programming language to print the raw read values to our console and use them to create a real-time chart with all the sensors' inputs.
Let's start by wiring the circuit.
Using the Grove sensors, you'll need to attach the Grove Base Shield V2 to the Galileo expansion header. This type of sensor has its own 26AWG Grove cables. With Galileo's power off, and using the Grove cables, connect the Grove Temperature sensor to the shield A0 connector, the Grove Light sensor to the A1 connector, and the Grove LED to the D8 connector.
Note
If you prefer using other sensors that aren't part of the Grove kit, you'll be able to use them as long as they can work with 5 V. Connect them to the Galileo Arduino expansion header pins using the same pins that the Grove sensors are using. For the LED, you can use digital pin 8 as well, but remember to add a protective resistor (1 KΩ should be fine) to its circuit, just like we used earlier in in the Fading an LED subsection under the Running your first sketches section in Chapter 2, Rediscovering the Arduino IDE.
Now, only the Moisture sensor is missing. Having a look at the sensor, it should bring an adapter. On one of its sides, you'll find two connectors, one with a + sign and the other with – sign. In your sensor, locate the two connectors with the + and – signs, and connect them accordingly.
In the opposite side of the adapter, you'll find four pins. Connect the adapter VCC pin to Galileo's 5 V pin and the adapter GND pin to the Galileo's ground pin. The two remaining pins allow you to obtain both digital and analog value readings. Connect the adapter analog connector A0 to Galileo's analog pin A2. The remaining adapter pin A0 won't be used, but it lets you read a value 1 when the read values are above a threshold or 0 when they are below. The threshold can be adjusted using the adapter potentiometer. The following figure shows how the circuit should look:
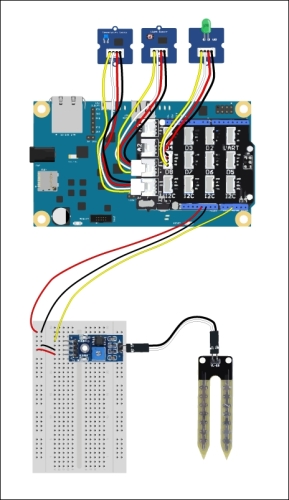
Wiring the sensors
Back to your browser, in your Wyliodrin dashboard, click on Create new application to create a new app. Fill in your application title and as language, select New project – Visual programming. In the next step, you can press the Submit button, since we won't use any extra components.
Now in the editor, let's start by reading from the Moisture sensor, which is connected to the analog pin A2.
Similar to the previous examples, we need to have a loop to help us keep reading periodically. On the left-hand side of the project, click on Program, then on Loops, and finally, on the first option, Repeat every 1 seconds do. Drag the block and position it anywhere in your sketch. This will be the main loop cycle we'll be using to extract the sensor's data every second.
To read from the analog pin, we can use an analogRead block located inside the Pin Access selector. Set the pin number to 2 so that we can read from A2. To be able to output the read values, you should add a Print on screen block ,which can be found inside Program | Screen and keyboard, and put the analogRead block inside.
Note
You can find the Visual language documentation at https://www.wyliodrin.com/wiki/languages/visual.
Put both the print blocks inside the loop block to keep reading and printing every second.
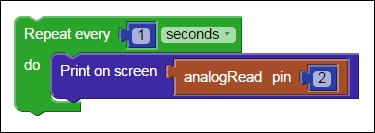
Visual programming blocks to print read data in the console
On the left-hand side of your window, you'll find your Galileo in a list, with the title Run application on. Click on your board name in order to upload the code, and you should now be noticing the read values being printed in the app console.
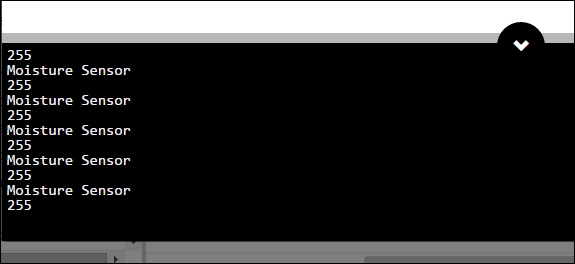
Printing read values from the Moisture sensor
Taking a look at the Visual programming analogRead block documentation (https://www.wyliodrin.com/wiki/languages/visual#analog_read), you'll find that this block maps the read values between 0 and 255. To stop running the code in Galileo, press the Stop button and close the modal window by clicking on the close symbol.
Now, instead of outputting the read values to the console, let's try outputting them as a signal to Wyliodrin. This service allow us to create real-time charts that can be fed straight from our sensors. Click on the Dashboard link located in the top-right corner of the window, and let's give it a try.
On the right-hand side of the window, you'll find many chart types listed. Scroll down a bit and add a Spline Line chart. Click on the chart settings button (sprocket icon), name the signal moisture_signal and the chart as Moisture.

Setting up a Wyliodrin chart
Click on the X button to save and exit.
Getting back to the editor by clicking the Dashboard link again, let's now emit signals with the read values to fill the chart we have just created inside the section Signals; you'll find the Send signal with value block, which can be used to send data to the chart. Replace the print block with this one and replace the value with the analogRead block, as shown in the following figure:
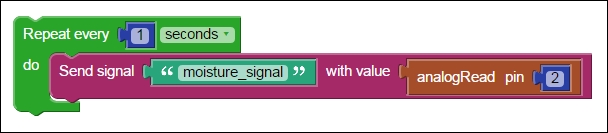
Visual programming blocks to feed a chart with the sensor data
This way, we'll be sending the read data straight to the chart, feeding it every second. Running your application again, you'll see the chart being filled with the read data over time.

Soil Moisture sensor response to water
Use a glass of water and wet your Moisture sensor a bit. You'll see the chart values decreasing. The more amount of water you apply to this type of sensor, the more conductive it will be. Its resistivity values are higher when it is dry. The values displayed in the chart refer to the read voltage values at Galileo's analog pin, mapped from 0 to 255. Reading a value of 255 means we are receiving 5 V at the Galileo pin.
So far, we were able to read from the Soil Moisture sensor. Now, let's add the remaining sensors to our real-time chart:
- Create two more Send signal blocks and place them inside the loop.
- Add one analogRead to each of the new Send signal blocks in the value field.
- Name the temperature signal as
temperature_signaland set the analogRead block pin as0. - Name the light signal as
light_signaland set the analogRead block pin as1.
Now you should be able to send all the sensors' values to the Wyliodrin charts, and your blocks should look similar to this:
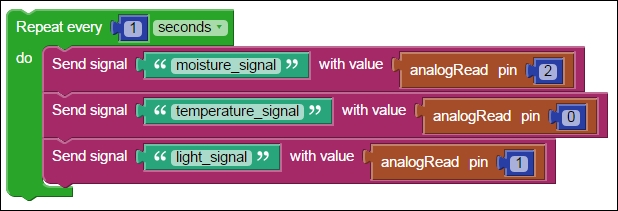
Sending all sensors data to charts
Click on the Dashboard button and let's add the new signals to the chart. Edit the Spline Line chart and click on the + button to add the remaining sensors. Give each of the line a color to help you in identifying them and name your chart as well.

Adding more signals to the chart
Now you'll be able to plot the line chart with the three sensors' data and in real time. Run the applications, and let's take a look at the chart:
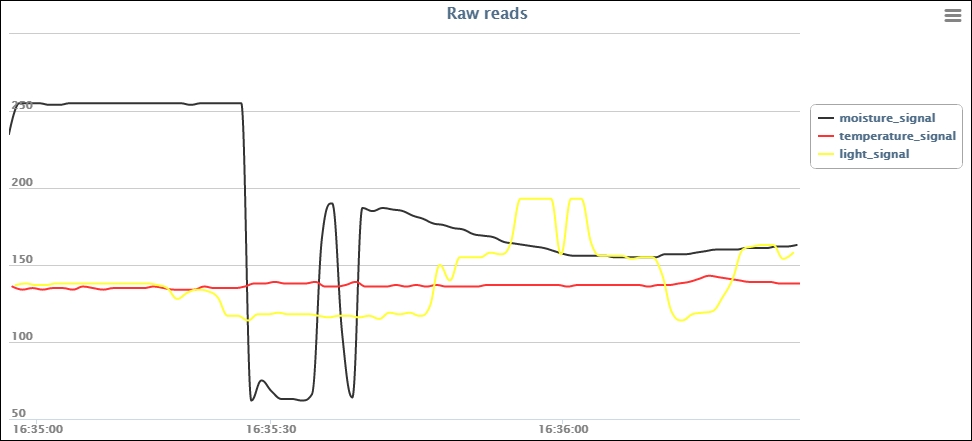
Sensors behaviour
If you are using the same signal colors, you should have the raw soil moisture values in black, the raw light values in yellow, and the raw temperature values in red. Expose your Light sensor to more or less light, and observe the changes in the real-time chart. If you heat or try placing the temperature sensor in another place, you'll most likely find different values being plotted as well.
You'll notice that the temperature and light sensors' values will increase when the temperature and incident light increase, while the Moisture sensor will have a different behavior with the printed values decreasing when water is applied to it.