Chapter 8. Continuous Integration with Hudson
An Introduction to Hudson
Hudson is a relative newcomer to the Continuous Integration (CI) field. However, despite its relative youth, it is probably worth considering for any new CI projects you might be starting. Hosted by Java.net, Hudson is actively developed and maintained by Kohsuke Kawaguchi, who is working for Sun Microsystems at the time of this writing. This innovative product is widely used within Sun, and is starting to build up a sizeable user base because of its ease of use and slick user interface. It has also recently been adopted by JBoss (see http://hudson.jboss.org/hudson/).
In many regards, Hudson has considerably fewer features then the some of the other CI tools such as Continuum (see Chapter 5) and CruiseControl (see Chapter 6). It concentrates more on Subversion and CVS-based projects, and provides only a limited number of notification techniques. The product is still somewhat young, and a little immature, but the features it does have are extremely well thought-out, with some being quite innovative. Hudson is also extensible, and a growing collection of plug-ins are available on the Hudson web site.
Installing Hudson
Hudson is very easy to install and set up. It requires Java 5 or later. You can download the latest release from the Hudson web site (https://hudson.dev.java.net). Hudson comes bundled as a web archive (WAR) file that you can run directly using an embedded servlet container (Hudson uses the lightweight Winstone servlet engine). To run Hudson from the command line, just type the following:
$ java -jar hudson.war
This will run Hudson on the default 8080 port. If this doesn’t suit you, you can also specify the port using the --httpPort option:
$ java -jar hudson.war --httpPort=8081
Running Hudson as a standalone product is a good option for evaluation
purposes, but for production-quality deployment, you will probably want to
deploy the Hudson WAR onto a more robust Java application server such as Tomcat.
This is particularly true when you are installing Hudson on a build server, and
you need Hudson to run as a service. You can deploy the Hudson WAR file as you
would any other web application. For example, on a Tomcat server, you would
deploy the hudson.war file to the
webapps directory. You can then configure Tomcat to run as a
service in the usual, OS-specific manner.
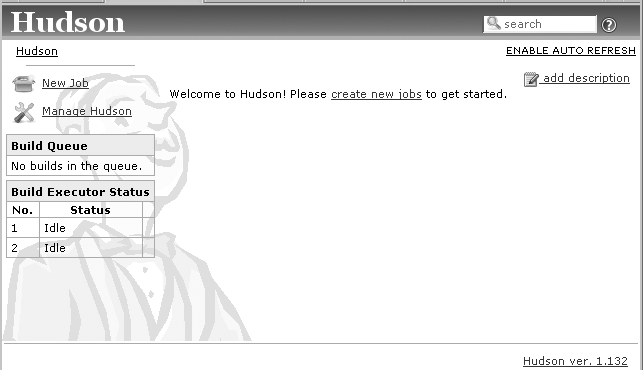
You can check out your new Hudson installation by connecting (e.g., http://localhost:8080/hudson if you are running it locally). The first time you run Hudson, you should get a screen like the one in Figure 8-1.
Managing the Hudson Home Directory
Hudson stores its data in a special directory, known as the Hudson home directory. By default, the Hudson home directory is called “.hudson.” placed in the user’s home directory. This is not to be confused with the directory in which you place the downloaded hudson.war file, or the expanded Hudson web application on your local application server. Set the HUDSON_HOME environment variable before you start up Hudson to change the home directory.
Let’s look at a practical example of this setup. Your boss wants you to install a Continuous Integration server for your new project. And he wants it to be done by lunchtime (it is now 11 a.m.). No sweat! Suppose we want to install Hudson onto a Linux box, and run it on a local Tomcat server. Let’s see how you might configure your server.
First, a word about user accounts. It is often a good idea to run Hudson (as with other build infrastructure tools) in its own dedicated user account. This makes it easier to keep track of resource use on the server, and can be very handy when you have several Java tools running on the same server. For example, in the following listing, we connect to our build server as a special user called “cis” (for “Continuous Integration Server”). First we connect to the server using this user’s account (I cheat a little by su-ing from root, but you get the idea):
# su - cis
$ pwd
/home/cis
$ ls .hudson/
config.xml                      hudson.triggers.SCMTrigger.xml
fingerprints                    jobs
hudson.scm.CVSSCM.xml           plugins
hudson.tasks.Ant.xml            secret.key
hudson.tasks.Mailer.xml         users
hudson.tasks.Maven.xml          workspace-cleanup.log
hudson.tasks.Shell.xml
Here, we are in this user’s home directory (/home/cis), using the default Hudson home directory of .hudson (/home/cis/.hudson). All of Hudson’s application data and server
configuration details are stored in the .hudson directory.
The Hudson web application is deployed onto a local
instance of Tomcat, installed into a directory called /usr/local/tomcat. To deploy the application, we just copy the
Hudson WAR file into the Tomcat webapps
directory:
$cp hudson.war /usr/local/tomcat/webapps
Hudson will now be deployed and running on your Tomcat server.
Installing Upgrades
The Hudson project team is highly reactive, and new releases come out every few weeks, or even every few days! To upgrade Hudson to a new version, simply download and deploy the latest version to your web application server. As long as you don’t delete your Hudson home directory, your application data won’t be affected.
Before you upgrade the web application, you should stop any builds that are currently in progress. You can do this by selecting “Prepare for Shutdown” in the “Manage Hudson” screen.
Configuring Hudson
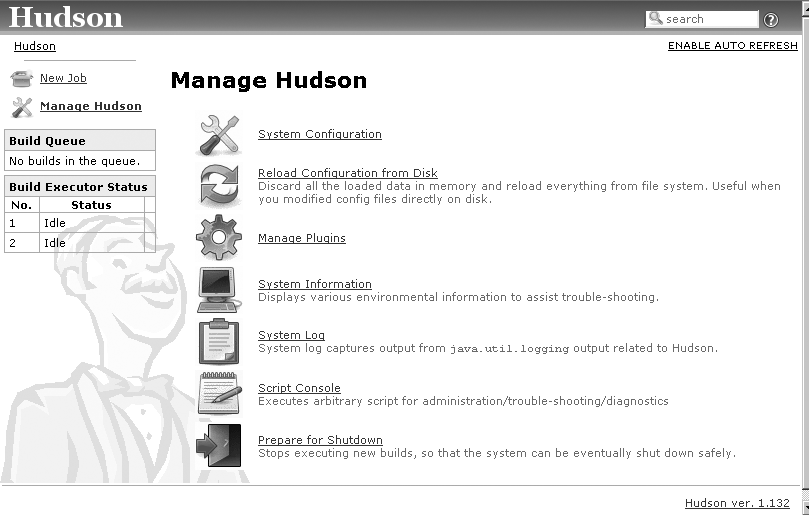
In Hudson, you manage both system-wide parameters and individual projects directly via the Web interface. The “Manage Hudson” screen is the first port of call for all Hudson administrative tasks and serve configuration. From here, you can manage plug-ins, view the system logfile, and display system properties (see Figure 8-2).
The most important Hudson parameters are in the “System Configuration” screen (see Figure 8-3). This screen lets you configure the main server-wide parameters such as available Java Development Kits (JDKs) and build tools, security configuration and quiet period.
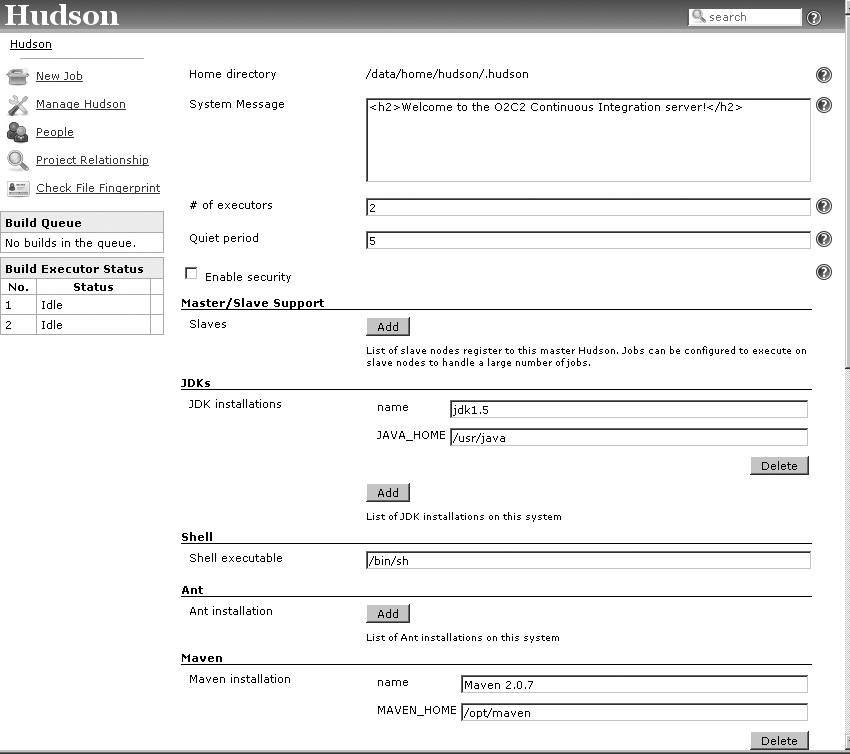
Let’s look at some of these options. One nice feature in Hudson is that you can configure it to run builds in parallel. The “# of executors” field indicates the maximum number of parallel builds that Hudson will allow. Subsequent builds are queued. This can speed up the build process, to a point. However, builds can be CPU-intensive operations, so too many simultaneous builds can bring your build server to a grinding halt. The precise sweet point will depend on your particular environment, so start off the the default value (up to two builds in parallel) and experiment.
As with most other Continuous Integration servers, Hudson lets you define a “quiet period.” This indicates the number of seconds that Hudson will wait after spotting a change in the source code repository, before starting a new build. This is mainly useful with CVS, which doesn’t support atomic commits. This way, Hudson doesn’t rush off straight away to do a new build, but waits until it is sure that there are no more changes to be committed.
One of the areas in which Hudson is not particularly strong is in matters of security. By default, Hudson does not impose any security constraints on users. Any user can modify configuration details without needing to be authenticated. This is convenient for small teams, but may not be appropriate for larger organizations. You can however enable security by ticking the “Enable Security” checkbox. In this case, unauthenticated users can only view build results; They cannot launch builds or modify configuration parameters. Only authenticated users with the “admin” role can configure the server or schedule builds. We look at how to configure security in Authentication and Security.
Sometimes you need to build different projects with different versions of Java. For example, one build might need to be run using Java 5, and another using Java 1.4. You can add as many JDK installations as required in the JDK section. These can be used later on to configure individual projects.
You also need to specify the path to the build tools you intend to use, whether you are using Ant, Maven or both. You can install multiple versions of each tool: for example, you might want to install both Ant 1.6.5 and Ant 1.7.0, and use different versions for different projects.
Both CVS and Subversion will work pretty much out of the box, as long as CVS is installed on the server. Hudson will look for a “.cvspass” file in the user home directory. This file is created when you log in to a CVS server, so you should do this manually from within the user account before asking Hudson to do it automatically. You also need to setup the SMTP server, if you are not using the local mail server running on the server.
Adding a New Build Job
In Hudson, you organize your Continuous Build environment by defining “build Jobs.” A build job is simply a particular way of building your project. However, to make things simpler, the Hudson user interface also refers to “projects.” In fact, for Hudson, the terms “project” and “job” are synonymous.
A software development project typically requires several build jobs, which are used in different circumstances. For example, you may have one build job to compile and run your unit tests, another to run the longer-running integration tests, and a third to perform more heavyweight analysis tasks such as static code analysis and test coverage.
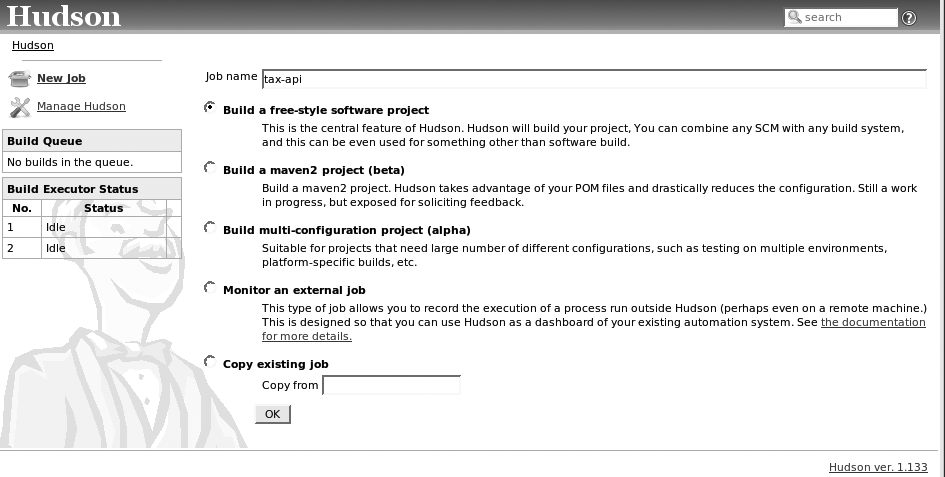
To add a new build job, click on the “New Job” link. You can choose from several different types of projects. The most interesting are:
A freestyle project, in which you can customize the whole build process by indicating exactly what you want the build to do. You need to configure pretty much everything. As you might imagine this is the most flexible way to set up a project, and the only way to set up an Ant project.
A Maven 2 project, which uses the Maven POM file to glean as much information as possible about things such as version control systems and so forth.
You can also create a new project based on an existing one by copying it (quite handy at times), or create a few other types of projects.
This is illustrated in Figure 8-4.
Let’s go through the process of creating a build project.
Building a Freestyle Project
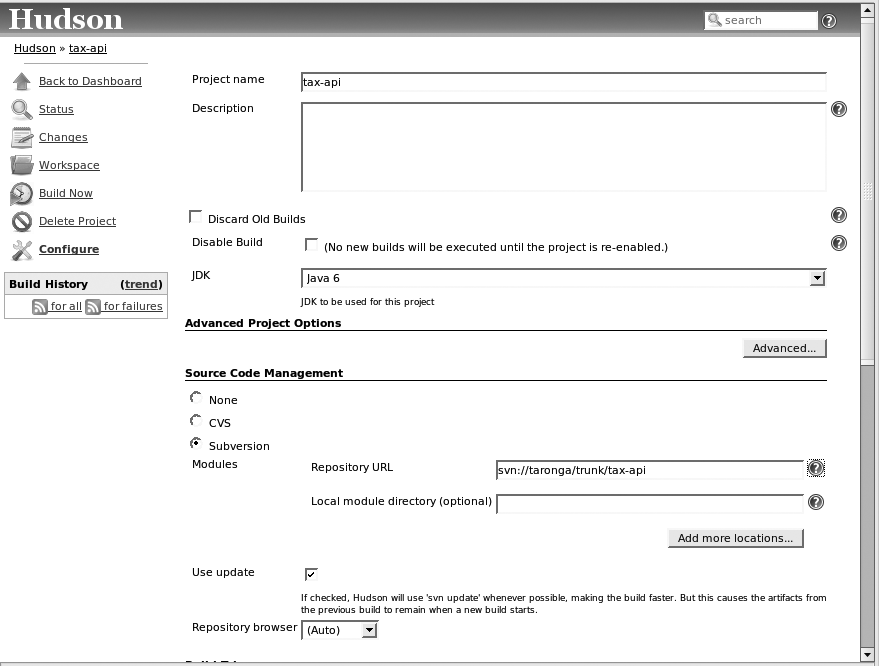
The first project we will build is a freestyle one. In this case, we will set up an Ant-based project stored in a Subversion repository. To get started, we click on “New Job” and choose “Build a freestyle software project” (see Figure 8-4). Here you give the project an appropriate name and click on OK. This will bring you to the screen shown in Figure 8-5.
The first thing that you need to complete is the project name and description. You can also specify if you want Hudson to delete your old builds after a certain delay, or only keep a certain number of builds. This is useful to avoid cluttering your build environment too much. Come on, how long do you really need to keep last Thursday’s snapshot build?
Of course, some builds have great sentimental value, and you wouldn’t want to part with them for the world. This is not incompatible with deleting old builds. Indeed, you can tag a particular build to never be deleted.
This is also where you specify the source code repository. In this case, we are using Subversion. The Subversion configuration is simple: you only need to provide the repository URL. For a CVS configuration, you need to provide a bit more information, including CVSROOT and module details.
In both cases, you can tick the “Use Update” option. This will speed up builds by only performing an update rather than a full checkout. However, if CVS is being used, it can result in stale objects remaining in the repository and compromising the build.
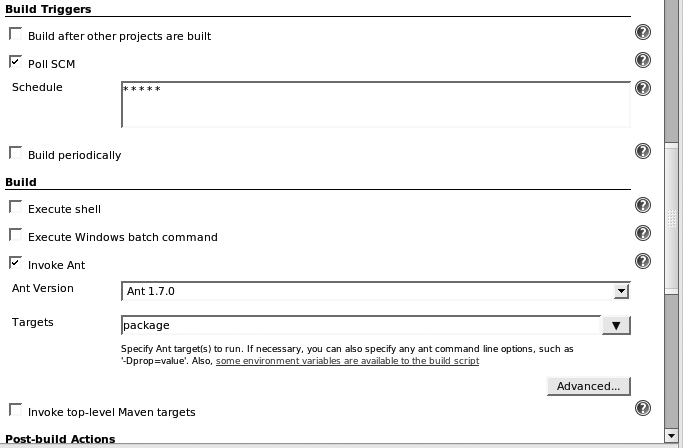
Next, we define when the build should be executed, in the “Build Triggers” section (see Figure 8-6). Hudson proposes a number of options, each useful in certain circumstances. Probably the most common choice is “Poll SCM.” This tells Hudson to poll the version control server at regular intervals in the hope of detecting any changes. This is the most reactive way to configure a Continuous Integration server: a build will start within minutes of anyone commiting a change to the version control server. This is also normally how a Continuous Integration server is supposed to work in normal circumstances. SCM Polling works well for Subversion, where commits are atomic, and a modification can be detected simply by monitoring the latest revision number. In CVS, things are a bit more tricky because, to detect any updates, Hudson needs to scan the whole workspace for changes. This is obviously inefficient for any but the smallest of projects. For CVS, it is better to set up a trigger in CVS. The exact process for doing this is explained in the Hudson documentation.[*] When you choose to poll the SCM, you define a schedule indicating when the polling should happen. The schedule takes a cron-style expression, such as “* * * * *” for every minute, or “*/10 * * * *” for every 10 minutes. Normally, you make this as frequent as possible.
You can also opt to build periodically, again using a cron-style expression. If you choose this option, a build will be executed at regular intervals, independent of whether any changes have been made. This is not Continuous Integration with a capital C and a capital I. However, it can be useful for programming certain builds that take a long time to run. For example, in a large Maven project, building a full Maven site could take 10 to 15 minutes. A full set of integration and functional tests might also be time-consuming. A Continuous Integration server should be reactive, which means that the first-line builds should be fast. These heavyweight builds (sometimes called “staged builds” in the literature) can be scheduled at regular intervals.
A third option is to build your project only when certain other projects are built. This allows you to define dependencies between your project builds. For example, another way to keep your builds reactive without sacrificing your longer-running tests is to define a fast first-line build that runs only your unit tests, followed by a build that runs your longer integration and functional tests. If there are any failures in the unit tests, the first build will give rapid feedback. The second, longer build will be automatically scheduled to follow the first build.
You also need to tell Hudson what exactly you want it to do for this build. A build can be any number of things, including a Unix shell script, a Windows bat file, or, more commonly, an Ant or Maven target. In this case, we are invoking an Ant target.
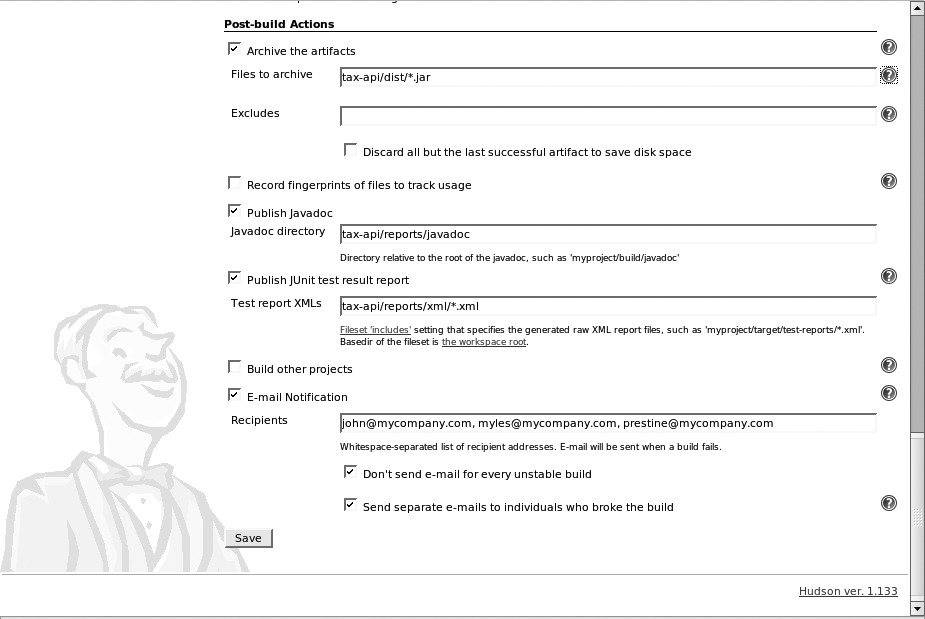
Finally, you need to tell Hudson what to do if the build succeeds (see Figure 8-7). Hudson can store your build artifacts along with the build history if you ask it to. This is a convenient way of archiving your build results for future reference or deployment. You need to specify an Ant-style file expression indicating the files you want to archive. Hudson will store these files and list them in the build results page for each successful build.
You can also publish JUnit test reports and Javadoc documentation. We will look at these aspects in more detail later on.
Finally, you can set up email notifications. You need to list recipients that you want to receive systematic email notification. If you tick the “Send separate e-mails to individuals who broke the build.” Hudson will try to identify the guilty party using the information entered in the People page, and notify them explicitly, no matter who is in the main recipients list. Of course, you need to provide email addresses for the users that Hudson lists in the People section.
That’s it! Now save your new build job and run a build to get the workspace checked out of the version control system. Hudson needs you to do this before it can poll the version control server itself.
Building a Maven Project
Adding a Maven project to Hudson is theoretically much simpler than adding an Ant project, since a lot of the information Hudson needs can be gathered from the POM file. You need to provide information such as the JDK to use and the source code repository. Then you simply provide the POM file and the goals you want to execute. Hudson will work out what to do with the generated artifacts, javadoc, and test results automatically.
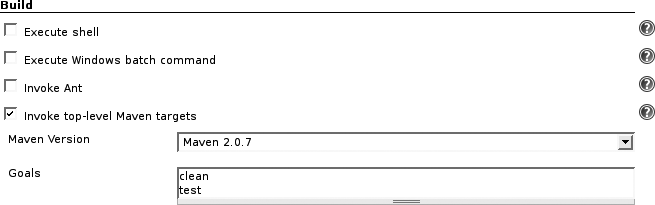
At the time of this writing, however, the Maven project was still in the beta stage, and the freestyle project provides a lot more power and flexibility, albeit at the cost of a bit more upfront configuration. To do this, you follow the same steps as discussed in the previous section. When you get to the build section, simply provide the Maven goals you wish to execute (see Figure 8-8).
Organizing Your Jobs
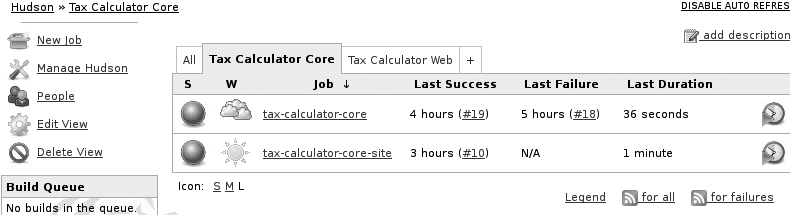
If your Hudson server is hosting several development projects, or even if your project has several modules, you can rapidly end up with an impressive number of projects appearing on the Hudson dashboard. Although Hudson does not have any formal notion of project groups, you can define views to make your dashboard a little clearer. These views appear as tabs on the main dashboard, as shown in Figure 8-9.
To create a new view, click on the “+” symbol to the right of the tabs on the Hudson home page. You will be able to give the view a meaningful name, and select the build projects that you want to include in this view. Don’t worry if you forget some projects—you can always add more, or remove unwanted projects from the view, via the “Edit View” screen.
Monitoring Your Builds
Once you have set up and organized your build projects, you can sit back and relax. The dashboard on the Hudson home page gives you an overview of the state of your projects, using some helpful graphical queues (see Figure 8-10).
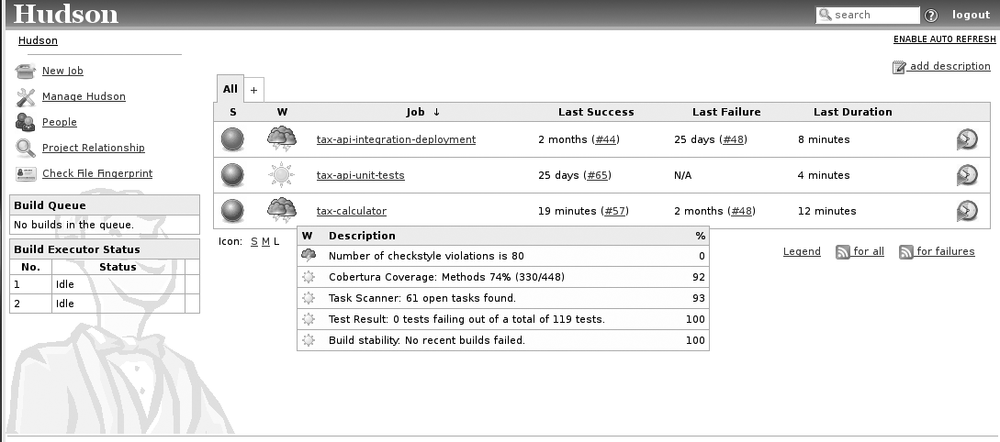
The colored balls to the left give you an idea of the current state of your build. This is fairly intuitive: blue is good, red is bad, and yellow (not shown in the screen shot) is so-so. More precisely, blue means that your last build was sucessful, and red means that it failed in some spectacular manner. Yellow usually means that there were test failures.
The cute weather report icons aren’t just for decoration—they give you a general picture of the overall health of your project, using data both from the current and from previous builds. This icon is also pretty intuitive—sunny weather is good, cloudy weather means that there are a few issues, and stormy weather means that your project health really needs some attention.
The project health indicator takes into account test results, but also code quality metrics such as test coverage, Checkstyle violations, and even the number of TODO tags in the code. The metrics used are primarily up to you, and many of them are provided by plug-ins (see Hudson Plug-Ins). If you pass the mouse over the weather icon, you can visualize a more detailed explanation.
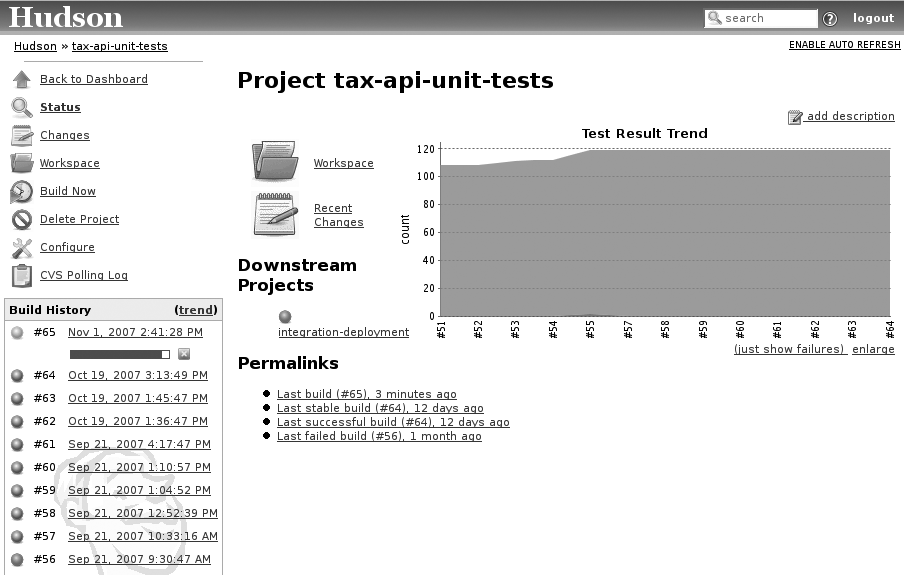
If you want to know more about the build history of a particular project, just click on the corresponding job name on the dashboard. This will display a summary of the build history for this project, including the latest build artifacts, Javadoc documentation, and test results (see Figure 8-11). You can learn a lot about a build and its history here.
The Changes link gives you a rundown of the messages logged in the version control system for each build, which can give you an idea of what changes lead to a particular build.
The Test Result Trend graph indicates the number of unit tests run per build. Normally, this should increase over time at a steady rate. If it remains flat too long, you should review the testing habits of your team!
Viewing and Promoting a Particular Build
Organizing releases is a crucial part of any development project. There are whole books on this subject, so we won’t try to cover this in any detail here. Basically, you need to be able to identify and distribute versions of your software in a predictable, controlled way. You need to know what changes went into a given version, and why. Ideally, you should be able to deploy the same artifact to different platforms (test, user acceptance, production, and so on) without modification. This helps to ensure that the product you are delivering is the same one that has passed all your unit, integration, (please look out for missing serial commas) and functional tests. You also need to be able to know what changes were made to the source code, and what issues were addressed.
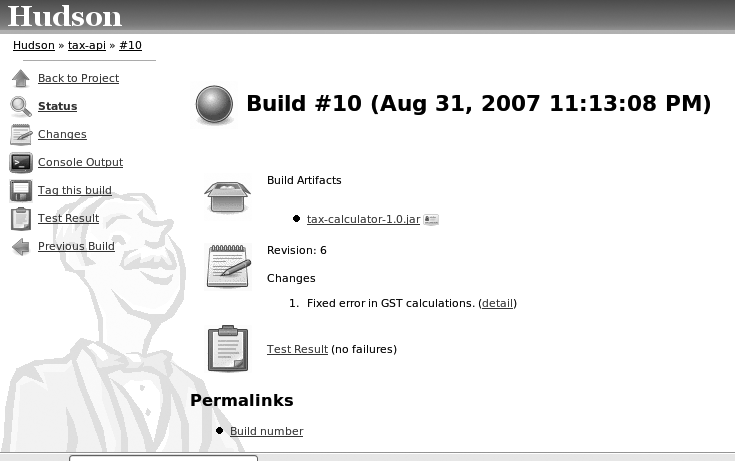
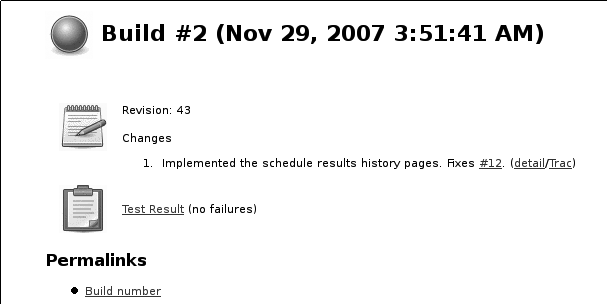
Although Hudson does not claim to be a SCM tool, it does provide some nice features to help keep track of builds and releases. If you click on any build number, Hudson will display a detailed description of that build (see Figure 8-12). From here, you can download the artifact produced by this build. You can also consult the changes made for this build, including log messages and modified files.
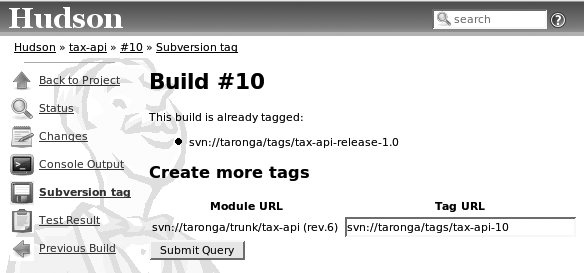
It is a good habit to tag significant builds in your version control system. However, if you are using CVS, this can be a long and CPU-intensive task, which can take literally hours on a large project. Hudson provides an interface to make this simpler. You can view tags that have already been placed on a build, and add new ones (see Figure 8-13). Using this approach, you have a good idea of what version you are tagging (which is not always so easy from the command line), and the grunt-work is done by Hudson—you just have to provide the tag.
Managing Users
One nice thing about Hudson is that it simplifies some of the boring administrative tasks you normally have to do when you maintain a CI server. For example, you don’t need to explicitly identify team members for Hudson—Hudson will figure them out by seeing who’s committing code to the source code repository. You can view these users in the “People” screen (see Figure 8-14).
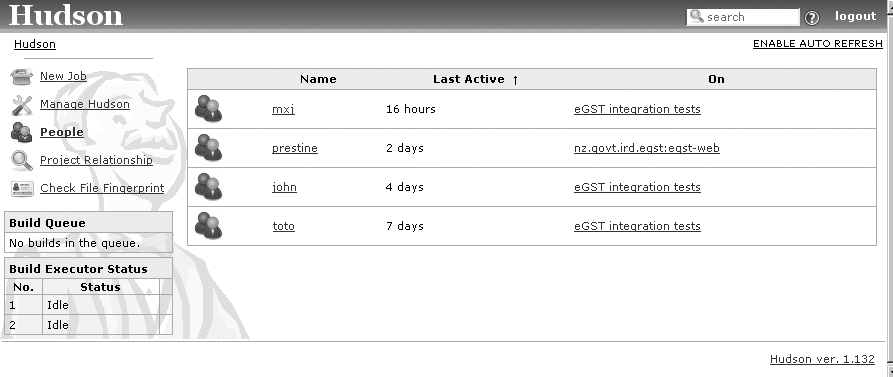
This screen lets you do more than just see who is participating in the development effort, however. If you click on a user, Hudson will bring up a details screen where you can configure the user’s full name (for more readable screens and reports) and email address. This way, Hudson can directly notify individuals who break the build.
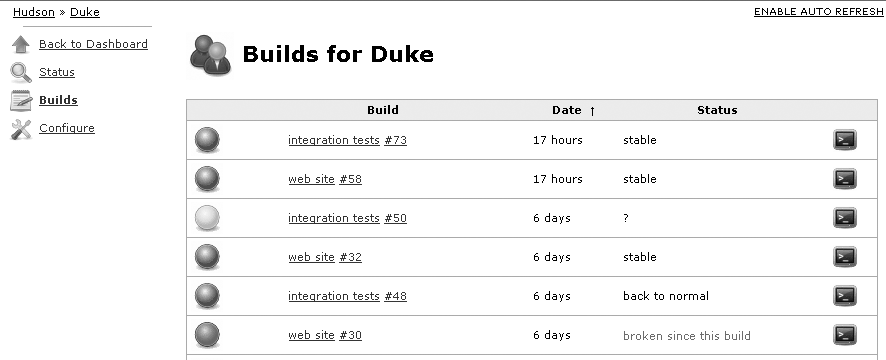
Hudson also lets you view the history of each developer’s builds: when and how often they have committed changes, any broken builds, and even details of the build outputs (Figure 8-15).
Authentication and Security
Security is not one of Hudson’s strong points. By default, any user who can access the Hudson web site can modify any project configuration, and even the server configuration itself. This is obviously geared toward small, agile, responsible teams rather than large organizations. However, if this is not appropriate, you can enable security by ticking the “Enable Security” checkbox in the Manage Hudson screen.
The underlying security mechanism will vary depending on the server where
Hudson is running. If you are running Hudson on Tomcat, for example, you can use
any of the Tomcat security realms, such as the Tomcat JNDIRealm, to connect to an LDAP server.
User-rights management in Hudson is not very sophisticated. There is no notion of project-specific roles or rights. When secure access is enabled, a user with the “admin” role can schedule builds for any project, and configure the global server configuration. All other users can only view build results.
If you really need to isolate projects, one (slightly clumsy) approach is to run a separate Hudson instance for each project or group of projects.
As an example, here is part of a simple tomcat-users.xml file. Only the “hudson-admin” user can modify the system configuration or schedule builds:
<verbatim>
<?xml version='1.0' encoding='utf-8'?>
<tomcat-users>
  ...
  <role rolename="admin"/>
  ...
  <user username="hudson-admin" password="secret" roles="admin"/>
</tomcat-users>
</verbatim>
Viewing Changes
Hudson does a good job of keeping track of the changes. When you view the details of a particular build, you can see details of the log messages associated with this build (see Figure 8-16). You can also click on the “detail” link, which will display a list of all the files modified in this build.
Hudson also integrates with issue tracking management systems such as Trac and JIRA. In Figure 8-16, for example, the server has been configured with the Trac plug-in, which allows it to recognize Trac wiki syntax and add a hyperlink to the issue number referenced in the log message. In addition, the “Trac” link will open up the Trac changeset view corresponding to this build. This sort of integration is very useful for keeping tabs on exactly what has been changed in a particular build.
Hudson Plug-Ins
Hudson is particularly extensible, and integrates well with other products. It supports a flexible plug-in architecture, and a rapidly growing number of plug-ins are available on the Hudson web site to add extra functionality and integration with third-party tools. One of the most immediately useful extensions is to integrate Hudson with an issue tracking system such as Trac and JIRA. The Trac plug-in, for example, recognizes Trac wiki links in your log messages, creating links to the corresponding pages in Trac.
Other plug-ins provide more sophisticated reporting features. The “violations” plug-in, for example, reports on Checkstyle, PMD, CPD, and FindBugs violations, and the Cobertura plug-in integrates Cobertura coverage reports into Hudson.
Plug-ins are easy to install—you simply download the plug-in file from the Hudson web site, and install it onto your Hudson server in the “Manage plug-ins” screen. Alternatively, you can place the plug-in in the $HUDSON_HOME/plug-ins directory on your server. Restart the server and the plug-in will be active.
These plug-ins integrate seamlessly into the Hudson interface. They also provide high-quality reporting capabilities similar to those provided by the Maven site generation plugin. These reporting features are an excellent way to provide high-level visibility on your project. At the Maven site generation, these reports can be configured to work with both Ant and Maven projects (although there is still generally more configuration involved for an Ant project than for a Maven one). As such, they are an excellent way to provide consistent reporting on many different projects within an organization.
We will look at some of the things you can do with Hudson plug-ins in the following sections.
Keeping Track of Test Results
It makes sense to keep track of your unit test results, both in terms of how many tests are being executed, and of the test success rate. This is a useful way of keeping tabs on the number of tests in the project (it should increase over time), and on the number of test failures (which should remain fairly low on the build server).
Hudson comes with a useful built-in feature that allows you to record and publish test results in a graphical form. First of all, your project needs to generate JUnit XML test reports. If you are using Ant, you need to configure an XML formatter in your JUnit task (see Using JUnit 4 with Ant). In Maven, XML test reports are generated automatically.
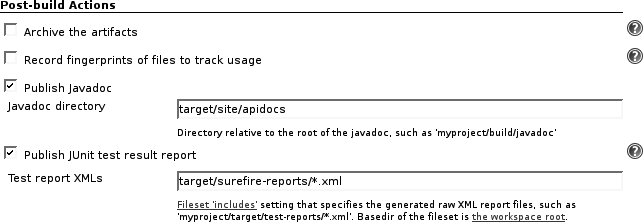
Next, you need to tell Hudson where it can find these reports. You do this in
the project configuration screen, in the “Post-build Actions” section (see Figure 8-17). Here, you specify a regular
expression, relative to your work directory, that will find the XML report
files. In a normal Maven project, this will be target/surefire-reports/*.xml. For an Ant project, it will depend
on how you have configured your Ant project.
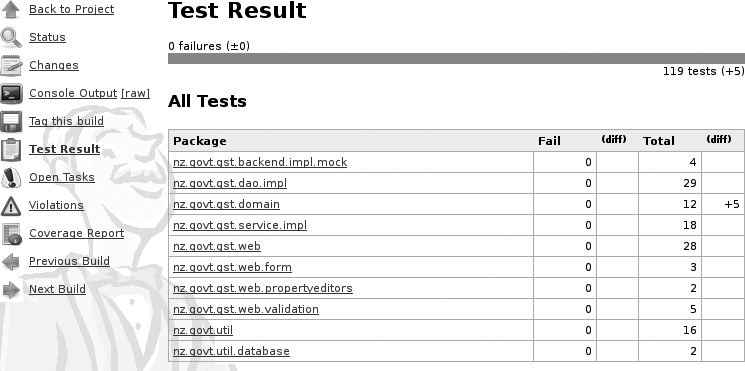
Once you configure this, Hudson will automatically generate and keep track of JUnit test result statistics. The overall test result trends are displayed on the project home screen in Hudson (see Figure 8-11, earlier in this chapter). You can also click on the graph to display test results by package or by class (see Figure 8-18).
Keeping Track of Code Metrics
Hudson also provides several useful plug-ins that allow you to keep track of code quality metrics. The most useful of these is probably the Violations plug-in. This plug-in lets you track and display statistics from a number of code analysis tools, including Checkstyle (Chapter 21), PMD and CPD (Chapter 22), and FindBugs (Chapter 23).
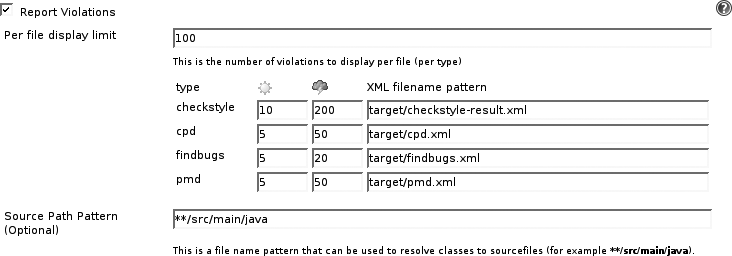
To activate the Violations plug-in, you need to tick the “Report Violations” checkbox in the “Post-build Actions” section of your project configuration screen (see Figure 8-19).
Then you need to tell Hudson where it can find the relevent report XML data. All of these tools can be configured to generate XML reports, and Hudson expects you to provide an Ant-style path pointing to these files.
You can also provide two threshold values for each tool, which are used to control the weather report icons visible on the Hudson dashboard. The first, indicated by the sun icon, is the maximum number of violations allowed before the sunny weather report will be replaced by a cloudy one. The second, indicated by the storm icon, specifies the minimum number of violations that will cause the stormy weather report to appear. For example, in Figure 8-19, if there are 10 or fewer Checksyle violations, the Checkstyle weather report icon will be sunny. If there are more than 10 but less than 200, the weather will be cloudy. If there are 200 or more, a stormy icon will be displayed.
These weather icons aren’t just used for the violation reports, they are also taken into account in the general weather report on the Hudson dashboard. This lets you integrate code quality metrics into the overall build result status—with too many code quality violations, the dashboard will display a bad-weather icon in the same way as too many successive build failures would do.
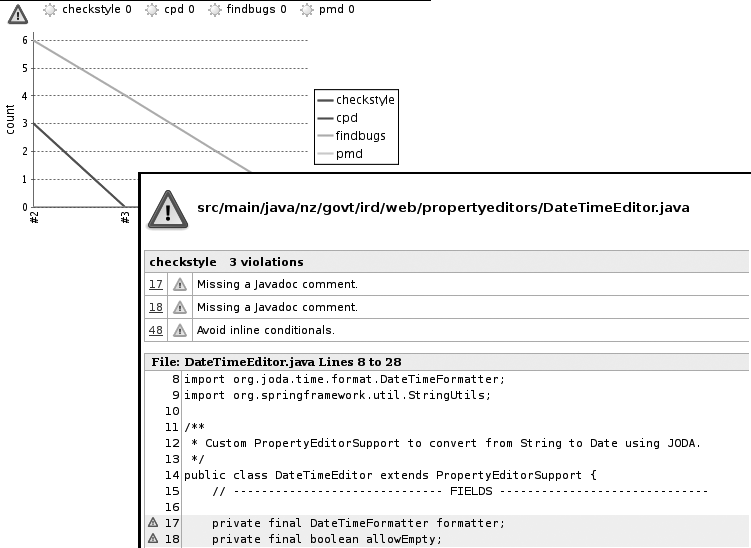
Once configured, Hudson will display a graphical view of the number of each violation type over time (see Figure 8-20). You can click on the graph to drill down to a more detailed view of the violations, with a report for each type of issue. From here, you can see the current number of violations that each tool has raised, a graph showing the trend over time, and the list of offending files. If you click on one of the files, you can then drill down to a detailed view of the issues raised for a particular file.
Reporting on Code Coverage
Code coverage (see Chapter 12) is a useful metric that tells you how much of your application code is being executed during your unit tests. This, in turn, gives you some idea of how well your application is being tested.
Hudson provides good reporting capabilities in this area. Plug-ins exist for several code coverage tools, including Clover, a popular commercial code coverage tool, Emma (see Code Coverage in Eclipse) and Cobertura (both in Chapter 12). In this section, we will look at how to use the Cobertura plug-in.
The Hudson Cobertura plug-in provides excellent reporting on test coverage, showing coverage statistics from the latest build as well as trends in test coverage throughout the life of the project. Like the other metrics tools, this plug-in relies on data generated during the build process, so you need to set up Cobertura in your project before you can go any further. In Ant, you need to generate XML reports explicitly (see Running Cobertura from Ant). If you are using Cobertura in a Maven project, the XML reports will be generated automatically (see Generating Cobertura Reports in Maven).
Once your project is correctly configured, you can tell Hudson where to find
the Cobertura report data. You configure the Cobertura plug-in in the
“Post-build Actions” section of your project configuratiom screen (see Figure 8-21). The most important field is the
“Cobertura xml report pattern,” where you need to provide an Ant-style file path
that Hudson can use to find the Cobertura XML report. For Maven, this will
usually be **/target/site/cobertura/coverage.xml. For Ant, it will depend on
how you have configured the Cobertura task in your build file.
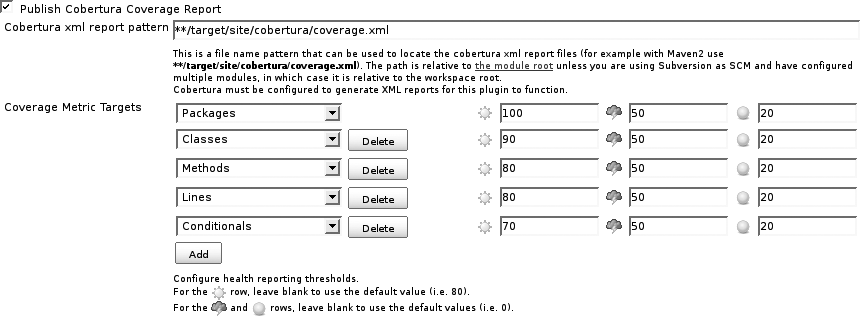
The other configuration parameters let you define various coverage metrics that you want to record. You can keep track of many different test coverage metrics, such as package, class, method, line and conditional (or branch) test coverage. This data will be recorded and displayed in the code coverage reports, allowing you to see how you are doing in your latest build, and also letting you observe trends in test coverage.
You can also different threshold values for each metric. These values determine how the coverage statistics will affect the project health indicators on the Hudson dashboard. The first column indicates the minimum coverage level required for a sunny weather indicator on the dashboard. The second indicates the level below which a stormy weather indicator will appear. Between these two extremes, Hudson will display differing degrees of cloudiness to indicate more or less satisfactory test coverage levels.
The third column lets you define a test coverage level that you consider unacceptable. If test coverage falls below this level, the build will be marked as unstable.
You may want to define more strict constraints on some values, and be more lenient on others. For example, you may require 100 percent coverage for packages and classes (all classes should be tested), but be more lenient on method and line coverage.
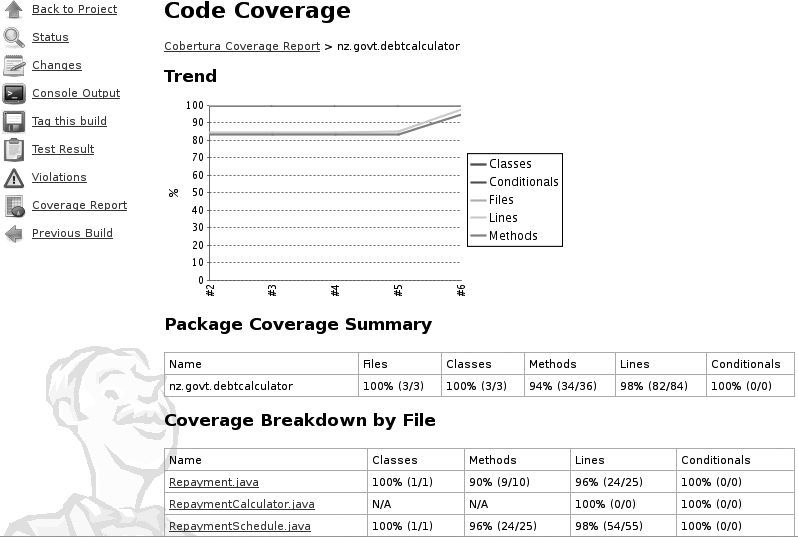
A summary of your project’s code coverage statistics are displayed on the project home page. This is a great way to get an overview of how your project is doing in terms of code coverage. You can also display a more detailed report by clicking on the graph, or on the “Coverage Report” link (see Figure 8-22). Here, you can view coverage trends at a project, package, or class level, or see precisely what lines of code are being tested (and, more to the point, what aren’t).