
Chapter 7
Loudspeaker behaviour in rooms
7.1 The anechoic and reverberation chambers
It is customary to measure loudspeakers in anechoic chambers, which represent as closely as possible a free acoustic field with no boundaries. The wedges which line the surfaces of most chambers serve to avoid abrupt changes in acoustic impedance and absorb from all angles to a uniform degree. The very high degree of absorption achievable with such systems functions down to a frequency where the length of the wedges exceeds one quarter of the wavelength. Below this frequency the absorption begins to reduce, and reflexions begin to occur. A room with one metre wedges would therefore be anechoic down to a frequency which has a four metre wavelength, which corresponds with a frequency of around 85 Hz. What happens below this frequency depends on the mounting conditions, the shell structure, and the size of the chamber – the larger the chamber, the weaker will be the reflexions at the measuring positions.
Loudspeaker measurements are made in such rooms because they provide an invariable reference which enables like to be compared with like. Real rooms tend to be like human fingerprints, with no two being exactly alike, so measurements made in real rooms would not be representative of the loudspeaker, alone. Although gating techniques exist which can allow computer-based measurement systems to eliminate the room effects, the gating systems themselves tend to introduce anomalies of their own. Large anechoic chambers, although very expensive to build (upwards of 1000 euros per square metre of total surface area for a 70 Hz chamber), really have no equal for measurement accuracy and repeatability.
Where absorption is very high, but incomplete, a room can be considered to be semi-anechoic. In such circumstances, and for given positions in the room, a response equalisation curve can be generated which allows compensation of the measurements for the small, smooth irregularities of the room, allowing an anechoic response plot to be realised in less than true anechoic conditions. A hemi-anechoic chamber, on the other hand, has one of its surfaces highly reflective and very rigid. If either the source of sound or the measuring microphone is set into the rigid boundary, no reflexions will be evident, although at higher frequencies, where the equipment in the room (either loudspeaker or microphone support) is comparable in size to the wavelength, a weak reflexion may return after travelling between the equipment, the hard-wall surface, and back again; or vice versa. The measured response in such chambers will show a rise at low frequencies due to the mounting in the boundary, the effect of which will be discussed later in the chapter. Fortunately, this can easily be compensated for by electrical means to yield a similar response to a fully anechoic measurement. The hemi-anechoic chamber represents radiation into a hemisphere, whereas in a fully anechoic chamber the waves are free to radiate spherically. The formula for the surface area of a sphere is 4πr2 (4 × the square of the radius), and for a hemisphere 2πr2. Consequently, the spaces are commonly referred to as 4π and 2π spaces. An anechoic chamber is shown in Figure 7.1.
At the other extreme, we have the reverberation chambers. These are built with massive, rigid, non-resonant walls and a non-parallel construction. The rooms are typically made from concrete, with the inner surfaces plastered and painted to provide a very smooth surface which is highly reflective up to the limits of audibility. The aim is to provide a uniformly diffuse sound field at all points in the chamber, although when the dimensions become small by comparison to the wavelength some modal, spacially dependent responses begin to appear. By means of the diffuse mixing of the sound, the total energy radiated by the source can be measured at any point within the volume of the chamber that is not too close to a boundary or the direct field of the source itself. Figure 7.2 shows a reverberation chamber with a decay time of around 8 seconds. It is useful in a chapter about room effects to begin with the two extremes of anechoic and diffusely reverberant spaces because all practical rooms lie somewhere in-between, and to a greater or lesser degree exhibit the properties of both of the above extremes.
The response of a loudspeaker measured on-axis and at various angles off-axis in an anechoic chamber is shown in Figure 7.3. The response of the same loudspeaker measured in a reverberation chamber is shown in Figure 7.4. If one can imagine measuring the loudspeaker in an anechoic chamber at all angles and in all planes, and then integrating the results, the mean response of all of the plots such as the ones shown in Figure 7.3 would look like the response shown in Figure 7.4. The reverberation chambers therefore act as acoustic power integrators, and provide a much quicker means of determining the total power response than the thousands of individual measurements that would need to be taken in an anechoic chamber.

Figure 7.1 The large anechoic chamber at the ISVR, Southampton University, UK. A section of the removable floor grids can be seen at the left-hand side. The wedges are made of glass-fibre, covered in muslin, and are one metre long. Above 70 Hz, the surfaces are almost totally absorbent
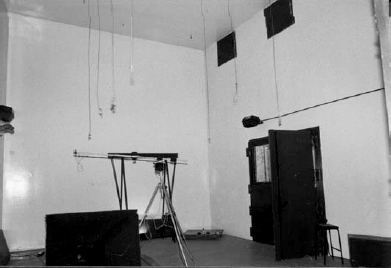
Figure 7.2 The reverberation chamber, adjacent to the anechoic chamber shown in Figure 7.1. The reverberation time at low frequencies is around 8 seconds. At the left of the photograph, the flash from the camera can be seen reflecting from the shiney wall surface
Most cabinet loudspeakers are omnidirectional at low frequencies and rather directional at high frequencies, therefore the extra low frequency power radiating in all directions is the reason for the bass rise in Figure 7.4. To maintain a flat response on axis, more total power must be radiated by the loudspeaker at the frequencies which spread out over a greater volume of the room. There are two common means of describing the directivity, the directivity index (DI) and the directivity factor. The DI is given by 10 log10Q, where Q is the directivity factor. In plain English, the DI is the ratio in decibels of the on-axis sound pressure compared to what it would be if the same radiated energy was distributed omnidirectionally. The directivity factor is the ratio of the actual directivity to the omnidirectional directivity, and has no units. For example, a source radiating into a hemisphere would have twice the directivity factor of a source radiating into a free field. Radiating into quarter space from a floor/wall junction would yield a directivity factor of 4. Q is perhaps the most commonly used symbol for directivity factor, but one also sees DF, λ and even R with a subscript Greek letter theta (θ).
7.2 Boundary loading and room gain
When a loudspeaker radiates in unrestricted space, the radiated waves are free to expand in all directions. Below about 250 or 300 Hz, the radiation pattern from a ‘monopole’ source (such as a loudspeaker cabinet) tends to be omnidirectional, but at higher frequencies, for conventional loudspeakers with the drivers mounted on a single front baffle, the radiation becomes more directional, as shown diagrammatically in Figure 7.5. For dipole sources, which radiate from both sides of their diaphragms, a figure-of-eight radiation pattern is more typical, as shown in Figure 7.6. Most cabinet loudspeakers, whether sealed boxes, reflex cabinets or transmission lines, act as monopole sources at low frequencies. Examples of common dipole sources are flat panel loudspeakers, such as some electrostatics, and open-backed guitar amplifier loudspeakers.
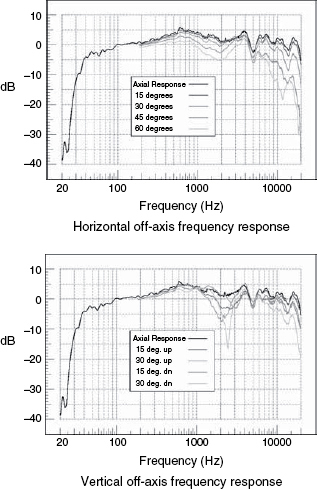
Figure 7.3 Axial and off-axis pressure amplitude responses as measured in an anechoic chamber
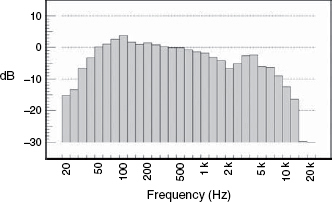
Figure 7.4 Total power response of the loudspeaker whose anechoic responses are shown in Figure 7.3. The reverberation chamber sums the responses from all directions
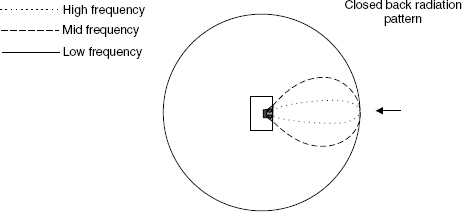
Figure 7.5 Typical radiation pattern from a closed back loudspeaker cabinet
On the axis (arrowed) all frequencies arrive with equal pressure, but the frequencies which radiate over a wider area also radiate more total power in the room, giving rise to the type of power response shown in Figure 7.4
When a wave expands spherically, the sound intensity (which is measured not in sound pressure level but in watts per square metre) is distributed over the surface of the expanding wavefront. Given a sphere of one metre radius, the area of its surface calculated from the formula given in Section 7.1 (4πr2 would be:
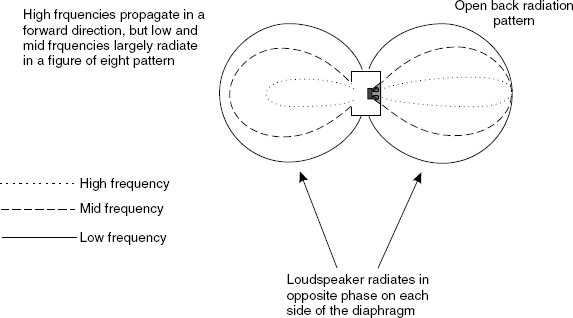
Figure 7.6 Typical radiation pattern from an open-backed loudspeaker cabinet
It is typical for less mid and high frequencies to radiate behind the loudspeaker cabinet due to mechanical obstructions
4π × 12 = 4π × 1 = 4πm2 12.6m2
A sphere of two metres radius would have a surface area of:
4π × 22 = 4π × 4 = 16πm2 50.3m2
which is four times the area of a sphere of one metre radius
A sphere of four metres radius would have surface area of:
4π × 42 = 4π × 16 = 16πm2 201m2
π, of course, being approximately 3.142
Sixty-four π square metres is four times 16πm2 which is four times 4πm2. Therefore, each time that we have doubled the radius we have increased the surface area by four times:
1 m radius = 4πm2 surface area
2 m radius = 16πm2 surface area
4 m radius = 64πm2 surface area
The sound intensity is a measurement of power distribution, so for any point on the surface of the expanding wave the intensity is reduced by a quarter each time that the distance from the source is doubled, because the same radiated power is spread over four times the surface area. Each time that intensity (or power) is halved, the level reduces by 3 dB. Each time that it is doubled, it is increased by 3 dB, so when the intensity is reduced to one quarter (one half of one half) it reduces by 6 dB (3 dB + 3 dB). Therefore, as the radius of a sphere doubles, and its surface area increases by a factor of four, the intensity at each point on the surface of the sphere is also reduced by a factor of four, and thus falls by 6 dB. This is the principle behind the well-known ‘double distance rule’, which states that each time the distance from the source is doubled, the sound pressure level (SPL) drops by 6 dB. The reduction is nothing to do with absorption in the air, but is purely a result of spreading the power over a greater area. Air absorption losses at short distances are negligible.
If the wave propagation were to be restricted to travelling along a tube, as shown in Figure 1.1, no expansion would take place, and therefore the only losses would be those incurred due to the non-perfectly smooth-and-rigid walls of the tube acting as absorbers. This is why it was possible in old ships to provide speaking tubes from the bridge to the engine room, and to speak and to be heard clearly over great distances and in noisy environments. In the 19th century, experiments were conducted with speaking tubes which were usable over distances of three kilometers, and conversations (by Biot, in Paris) in a low voice were possible at 1 km1.
Note, however, that although the sound power reduces by 3 dB when it is halved, the halving of sound pressure requires a 6 dB reduction. This is because the sound power is proportional to the square of the sound pressure. In electrical terms, voltage can be considered to be the electrical pressure, or electro-motive force. In Spanish and Portuguese, for example, the word ‘voltage’ translates as ‘tension’, just as in English we can refer to the very high voltages on a cathode ray tube as EHT, or extra high tension. In Spanish and Portuguese, blood pressure also translates as ‘blood tension’, so this concept of using the same word ‘tension’ highlights the link between voltage and pressure. The well-known equation for calculating the output power of an amplifier from the signal voltage and the load resistance is
![]()
Where W is the power, V the voltage and R the resistance.
This clearly shows the voltage (pressure) squared relationship to the power. Power, on the other hand, is power, whether mechanical, electrical, or heat, and a decibel is always a power ratio. A decibel is also always a decibel: there are no separate decibels for power, voltage, pressure or intensity. The relations are fixed and the decibel never changes. If a reduction of 3 dB takes place, the power is halved and the pressure falls by √ 2. If a reduction of 6 dB takes place, the power is quartered and the pressure halves. This relationship needs to be well established here, because when dealing with rooms, we need to deal with radiated power from the sources but we measure sound pressures within the rooms. This is principally because human ears are pressure detectors, so hearing relates better to pressure changes than to power changes, but loudspeakers radiate acoustic power and heat. Loudspeakers do not radiate pressure, because when all of the positive and negative pressure half-cycles are summed, no net pressure change takes place. A bomb-blast, on the other hand, radiates a unidirectional pressure wave.
7.2.1 Restriction of radiating space
If we mount a loudspeaker cabinet in an infinite, plane boundary, such as is simulated by the hard wall in a hemi-anechoic chamber, two things occur relating to the radiation of the low frequencies which are different to what happens when the loudspeaker is mounted in free space. Firstly, as no sound can radiate behind the source, the radiation can only radiate in a forward direction. As all of the power is radiated forwards, the pressure on-axis will rise by 3 dB, as the half of the radiated power which would have travelled behind the loudspeaker is driven forwards. Secondly, the increased pressure on the face of the diaphragm, resulting from this restriction of the expansion of the wave, tends to resist the movement of the diaphragm. In effect, the radiation impedance has been increased, which in turn gives the diaphragm something more substantial to act upon. The mounting surface can be thought of as a special case of a 180 degree horn of infinite flare rate (see Chapter 4), so it provides a more resistive termination. This extra loading gives rise to approximately another 3 dB of increased axial sound pressure, resulting from the increase in radiated power, although the precise increase is related to the loudspeaker sensitivity.

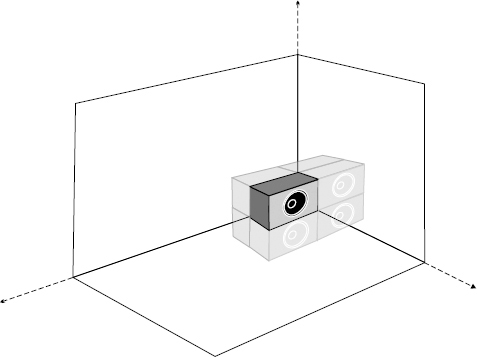
Figure 7.7 Radiation into quarter space (π space)
A loudspeaker bounded by two infinite planes at right angles to each other could only radiate into one quarter of the space compared to that of a free-field. The space restrictions would both constrain the expansion of a propagating wave and give rise to a greater acoustic loading on the diaphragm
If another boundary is introduced, just below the loudspeaker, as shown in Figure 7.7, the same effects occur. This is known as ‘quarter space’ loading, or π space, because the free-field (4π space) has been halved by the introduction of the first plane (2π space) then halved again by the introduction of the surface immediately below the loudspeaker (π space). If a further plane, rigid boundary surface is introduced at 90 degrees to each of the other surfaces, as shown in Figure 7.8, these effects will be repeated once more. This is akin to mounting a loudspeaker on the floor (or ceiling) in the corner of a room. The potential 6 dB increase which is added to the axial response as each boundary surface is added means that when placed in a three surface corner of a room, the axial radiation at low frequencies can be up to 18 dB (6 dB + 6 dB + 6 dB) higher than when the loudspeaker is receiving the same electrical input power and is radiating at the same distance from the measuring point in free space. This boost is a minimum phase effect, and incurs no penalty in the time or phase responses of the loudspeaker. There is no resonance associated with this effect, and no reflexions exist so long as the radiated wavelengths are substantially larger than the largest physical distances between the radiating surface and the walls enclosing it. This will be discussed further in Section 7.8. The loading can be thought of as mounting the radiating surface at the throat of a horn of triangular cross-section, as shown in Figure 7.9.
A clear significance of this boundary loading effect is that a domestic loudspeaker which is considered to be light on bass may have its LF response reinforced by placing it close to a corner. Conversely, if a corner is the only position suitable for the placement of a loudspeaker in a room, then a loudspeaker should be chosen which is somewhat bass light in its free-field response if a flat response in the room is the goal. In fact, one of the principal uses of tone controls on hi-fi systems is to compensate for such changes of overall responses due to loudspeaker positioning. The additional radiating efficiency also means that a loudspeaker which is placed in a position where its output is augmented 6 dB with respect to its input will need only one quarter of the power in order to achieve the same SPL in the room. Reliability will be increased and distortion will be reduced. However, in real rooms, other complications may arise such as the driving of extra room modes, and colouration due to the response boost not exactly matching the inverse of the natural roll-off of the loudspeaker.
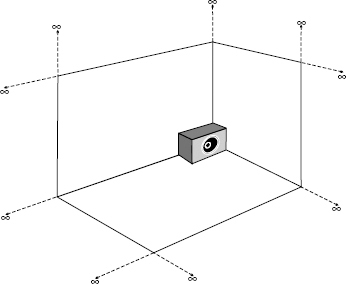
Figure 7.8 Radiation into eighth-space (1/2 space)
Radiating from the corner of three infinite, rigid boundaries, the loudspeaker would be constrained to radiating into one-eighth of the space of a free-field. In ideal conditions, the low frequency axial sensitivity of the loudspeaker could be up to 18 dB higher than for the same power input into free space
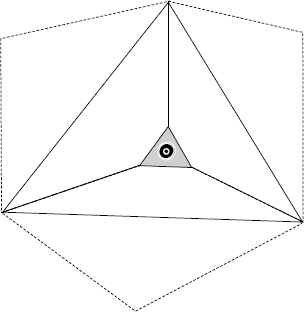
In this representation, Figure 7.8 has been re-drawn to show how, in effect, the loudspeaker constrained by three mutually perpendicular planes is mounted in a triangular horn
7.2.2 The mirrored room and mutual coupling
Another way of looking at the above concept is to imagine that the surfaces constraining the loudspeaker were all mirrored, and that in every place where one saw a reflexion of the loudspeaker a real loudspeaker existed which was radiating exactly the same signal. This idea is shown in Figure 7.10, and indeed, if one removed all of the reflective surfaces and put real loudspeakers in place of the reflexions, then the response at low frequencies would be exactly the same as that with one loudspeaker and the boundaries in place. In the case of a single boundary, the low frequency response rose by 6 dB. If two loudspeakers were placed back to back, with no boundary between them and fed with the same signal at the same power level, the result at low frequencies, radiating omnidirectionally, would also be a 6 dB increase. Now, if we drove each loudspeaker with one watt, the total input power would be double that of one loudspeaker, which would be a 3 dB increase. The additional 3 dB needed to yield the 6 dB output increase experienced in real situations is a result of a phenomenon known as mutual coupling.
When one loudspeaker radiates into free air, the local pressure on the diaphragm is that due to its own motion. When an identical second loudspeaker is added, placed very close to the first loudspeaker and driven with the same signal and with the same phase relationships, the local pressure into which each diaphragm radiates is its own pressure plus the pressure radiated by the other, adjacent diaphragm. This additional pressure exhibits itself as an increased radiation impedance, which gives rise to more sound being radiated.
Large diaphragms, in general, radiate low frequencies more efficiently than smaller diaphragms because there is a mutual coupling effect between all the individual sections of the one diaphragm. One can think of a large diaphragm as being made up of many small, individual surface areas. The bigger the diaphragm, the more difficult it is for the air in contact with it to move out of the way of the diaphragm motion. The ‘congestion’ of the air particles presents a more resistive load to the vibrating surface of the driver.
So far, we have only been discussing mutual coupling at low frequencies, but it is not just a low frequency phenomenon. In fact, it occurs at all frequencies, but it is only at low frequencies where it is entirely constructive. It can be considered to be 100% constructive up to frequencies where the distance between the radiating surfaces is no more than one eight of a wavelength, which means that the radiation from one loudspeaker reaches the other substantially in-phase with its own radiation. As the distance (or frequency) increases, the mutual coupling boost diminishes and actually becomes slightly negative at some wavelengths as the phase relationship of the two pressure components drift further apart. At still higher frequencies the mutual coupling effect becomes negligible. The zones of coupling are shown diagrammatically in Figure 7.11.
If we imagine a loudspeaker radiating low frequencies from the corner of a room with mirrors on all surfaces, what we would see would be cluster of eight loudspeakers. The power radiated by the single loudspeaker constrained by the walls and the floor is exactly the same as would be radiated in that space if the walls and floor were removed and the cluster of eight loudspeakers, each receiving the same power input as the one loudspeaker in the constrained space, were radiating into a free-field. Within the frequency range of mutual coupling, each doubling of the quantity of loudspeakers, all receiving the same input power, will raise the radiated output by 6 dB. Therefore, compared to one loudspeaker, two will radiate 6 dB more power, four 12 dB more, and eight 18 dB more power, hence the acoustic power increase referred to in Figure 7.8. However, this theoretical maximum is difficult to achieve, and may reduce with increasing loudspeaker sensitivities.
7.3 Room reflexions
When a vibration in the air reaches any boundary, three things will occur. Part of the energy will be absorbed, and converted into heat. Another part of the energy will pass through the boundary, and will be transmitted beyond it. The remaining energy will be reflected back into the room. As nothing on this planet is either perfectly absorbent, or perfectly reflective, all the above things must occur on each and every contact of a sound wave with a surface. Reflexions from room boundaries will combine at any given point with the direct radiation from the loudspeaker, and the pressure at that point will be the sum of the direct sound and all the individual reflexions which pass through it at the same time. Note, however, that the direct sound will still fall off at a rate of 6 dB per doubling of distance from the source, even though the overall direct/reflected sound level may fall off at a much lower rate.
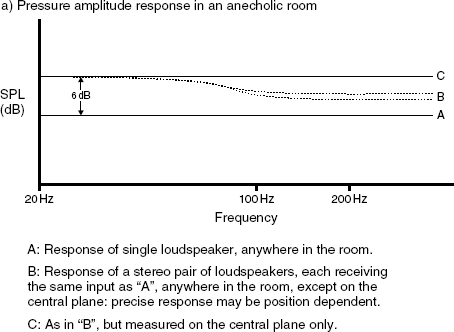
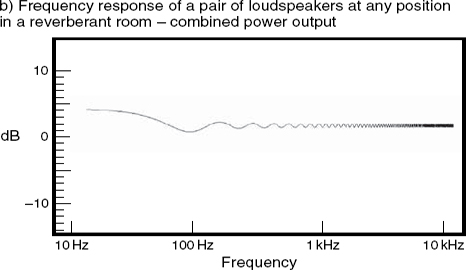
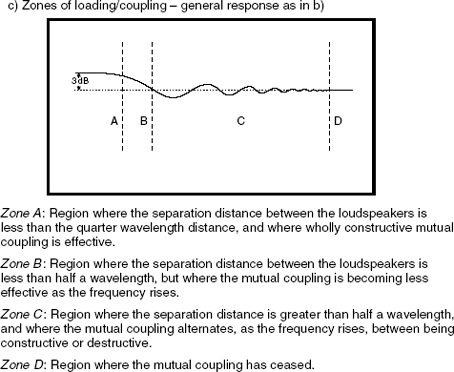
Figure 7.11 Mutual coupling effects – omnidirectional sources (continued on next page)
It is also important to understand that when pressures cancel to zero, the waves do not disappear. They merely pass through each other. Sound waves have a pressure and a velocity component, and when either one is at a maximum, the other is at a minimum. The concept is similar to that of a swinging pendulum – when the height is at a maximum, the pendulum stops, before falling back, so the velocity is at a minimum. As it swings through the bottom of its trajectory, the height is at its lowest point (minimum height), but the velocity is at a maximum. Likewise, when a sound wave hits a wall, the particle velocity must be zero, because the wave motion must stop and change direction. The energy, which can neither be created nor destroyed, must therefore all reside in the pressure. In the pendulum, the energy constantly cycles through potential (height) and kinetic (velocity), and in an acoustic wave it constantly cycles between pressure (potential energy) and velocity of particle motion (kinetic energy). These motions are 90 degrees out of phase. If one considers a sine wave, the energy cannot be at zero when the pressure passes through zero, because it if had disappeared, where would the energy come from to produce the next half cycle? It comes, of course from the velocity component, which was actually at a maximum (it had all the shared energy) when the pressure wave passed through zero.
The pressure components of reflected waves can also load loudspeaker diaphragms, but the fact that they may have travelled considerable distances means that their sound pressures will have fallen significantly by the time that they return to the diaphragm of their origin, so the effect is small. When two identical signals (either electrical or pressure waves) are added together, if either one is more than around 6 dB lower than the other, the total signal will not be significantly greater than the larger of the two, alone. Therefore, reflected energy in the far-field of a loudspeaker will have more effect in terms of the way in which it combines by superposition with the direct signal rather than any effect that it has by directly impinging on the diaphragm.
7.3.1 Resonant modes
A special case arises when a reflexion can, through multiple reflexions, retrace its own path, and arrive at a boundary with the same phase relationship and in the same direction as when it left, as shown in Figure 7.12. In this case, known as a resonant mode, each subsequent reflexion superimposes itself on the previous one, or the sum of the previous ones, and the energy in the mode builds up. Once the source of the energy is switched off, the energy stored in the mode will take some time to decay, dependent upon the reflectivity of the surfaces between which it is resonating. There is much more energy trapped in resonant modes than is normally encountered in single reflexions, and it is the modes which are largely responsible for the colouration which untreated rooms impart to the responses of nominally clear sounding loudspeakers. The energy in a modal resonance can be higher than the direct energy received from the source, whereas simple, reflected energy is always lower.
One sometimes hears the term ‘standing wave’ being used for resonant mode. Whilst it is true that all resonant modes are standing waves, all standing waves are not resonant modes, so the term ‘room modes’ is preferable to ‘standing waves’. Likewise, whilst all cows are mammals, all mammals are not cows. One can therefore call a cow a mammal, but one cannot call a lion a cow! [And whilst both Scots and English are British, it is wisest not to call a Scotsman ‘English’ or serious violence is likely to ensue!]
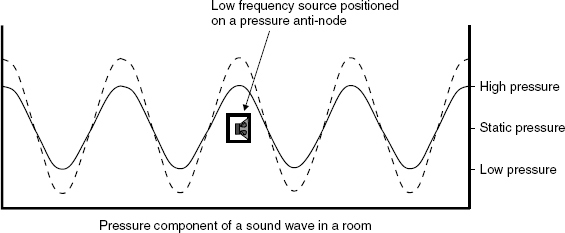
Figure 7.12 The driving of a resonant mode
At resonance, where an exact number of half-cycles can fit between the walls, the direct and reflected waves will superimpose constructively to create a resonant build-up, shown dashed. When the source driving the mode is switched off, the energy trapped in the mode will continue to resonate until it is dissipated by absorption
In Figure 7.13, modal pressure and velocity distribution are shown superimposed. If a conventional monopole loudspeaker, which radiates omnidirectionally at low frequencies, is placed on the node of the pressure wave, where the pressure is at a minimum, it will be unable to radiate a steady tone at that frequency which coincides with the mode, because the modal energy will constantly cancel the direct energy. Conversely, if the loudspeaker is placed at an anti-node, where the pressure is maximum, it will strongly reinforce the mode, just like a correctly timed push of a child on a swing, at the peak of the travel, will add impetus to the motion. On the other hand, a dipole loudspeaker, which radiates reverse polarity pressures equally from each face of its diaphragm, acts as a pressure source, and not a volume/velocity source like a monopole, and couples best at the pressure node of a mode, which is, of course, a velocity anti-node because of the 90 degree phase shift between the pressure and velocity peaks, as shown in Figure 7.13.
Therefore, if one were to compare a figure-of-eight radiating, electrostatic loudspeaker and a normal cabinet loudspeaker with an almost identical on-axis frequency response when measured in an anechoic chamber, the responses could be expected to vary widely when placed in the same place in a room with reflective boundaries. Part of the difference would be due to the difference in radiation patterns, and hence the different ways in which each one drove the reverberant field. The other great source of variation, particularly at low frequencies, would be due to the different ways that each loudspeaker coupled to the room modes. Consequently, when comparing the sound of open-backed and closed-backed guitar amplifiers it is useless to do so without finding room positions for each of them individually which support their tone. Similarly when assessing domestic high fidelity loudspeakers of monopole or dipole nature, it is essential to consider how each one will couple to the room modes. Clearly, one position will be unlikely to suit both, and it should also be remembered that because of the way that a dipole radiates in a figure-of-eight pattern, it will only drive the modes which occur between the parallel room surfaces which face the front and rear of the loudspeaker, whereas the omnidirectional low frequency radiation from a monopole source will drive modes in all three dimensions.
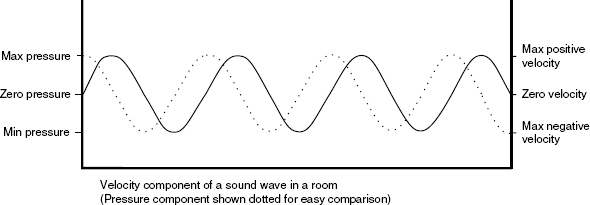
Figure 7.13 The relationship between pressure and particle velocity in a resonant mode
The particle velocity component of the wave must always be at a maximum when the pressure component is at zero, in order to conserve the energy contained in the wave. The energy cannot simply disappear when the pressure is zero, or there would be no energy left to continue the cycle
7.4 Flush-mounting
The response of a loudspeaker, except in a free acoustic field (i.e. without boundaries) is absolutely inseparable from the modifications which will be imposed by the room within which it is placed. Rooms form part of a loudspeaker system because they provide loading on the diaphragms which actually affect the sound radiation directly from the source. Rooms are not simply environments in which loudspeakers with fixed responses are used. If every position in every room will give rise to its own characteristic response for any loudspeaker placed there, it introduces a great variable in music monitoring conditions if the loudspeaker placement is not very carefully chosen. In many music recording studios, and in almost all film dubbing (mixing) theatres, the principal loudspeakers are flush mounted in the front wall.
By this means, questions of room positioning are eliminated, and as all rigid walls are pressure anti-nodes for all the modes which they support, these modes will all be driven equally. Conversely, no position within the room can drive all of those modes, because the node and anti-node positions vary with frequency. Flush-mounting loudspeakers in a boundary also means that no rear radiation can take place, so none can bounce off the wall behind the loudspeaker and return to the listening position with varying phase relationships to create peaks and dips in the pressure amplitude. What is more, flush mounted loudspeakers will effectively experience 2π radiation, as explained in Section 7.1, and will benefit from the greater sensitivity afforded by the increase in the radiation resistance and the constrained angle of radiation. In a room, which already constrains the wave expansion to some degree, as opposed to in a free-field, the sensitivity increase due to flush-mounting may be around 3 dB to 6 dB. This can be useful at high power levels because the halving of the heat in the voice coil even due to the 3 dB power reduction can be important in reducing thermal compression and increasing long-term reliability. Distortion can also be reduced due to the smaller cone excursions necessary to generate the same SPL. Frequency dependent cabinet edge diffraction effects are also eliminated. When all is considered, flush-mounting enjoys many advantages over free-standing, and no obvious disadvantages; at least in mono and stereo rooms. For these, flush-mounting is the choice of the great majority of large, professional studios. Of course, there also exists a further, non-electro-acoustic advantage for flush-mounting – it leaves the room much less obstructed, especially when very large loudspeaker cabinets are used.
One problem which can arise from flush-mounting if it is not well executed is that the front wall can vibrate, thus radiating an unwanted extra, resonant sound energy into the room. Some designers favour the resilient mounting of the cabinets, to avoid transmitting the cabinet vibrations into the structure. Other designers favour the rigid mounting of the cabinets into a heavy, rigid structure, too heavy to significantly vibrate with the available energy. Resilient mounting in a heavy structure is another option, but the advantage of rigid mounting in a heavy wall is that the cabinets are kept absolutely stable under all drive conditions. Cabinets that are intended for mounting in this way usually have no decorative finish except on the front face, because they will be fixed into the frame of the structure during construction.
7.5 Multichannel considerations and phantom imaging
When loudspeakers act in multiples, the response is not necessarily merely the sum of the individual components. When two loudspeaker cabinets are brought close together when reproducing different, uncorrelated signals, at the same sound pressure level, the overall pressure at the same distance from the loudspeakers will rise by 3 dB, which is the simple sum of the two radiated power levels. On the other hand, if the loudspeakers are radiating the same signal, the on-axis pressure will increase by 6 dB, due to the in-phase pressure superposition, although elsewhere in the room, at places where the phases cancel, lower levels will be evident. Figure 7.14 shows the pressure amplitude of the frequency response of four loudspeakers radiating the same signal, measured in free space at two different positions. The only point where a flat response could be received would be at the single point equidistant from the four sources. The loudspeakers represented in the figure are theoretically perfectly flat sources. The significance of this figure is that it shows that no matter how perfect the loudspeakers, or how flat the room, a single signal fed into four loudspeakers will not be able to deliver a flat response except in one spot, due to the phase cancellations given rise to by the different path lengths from the sources. For each frequency, and hence each wavelength, the spacial distribution will be different.
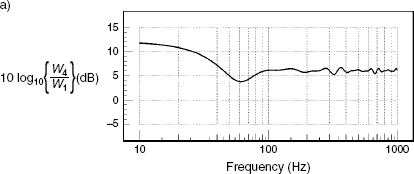
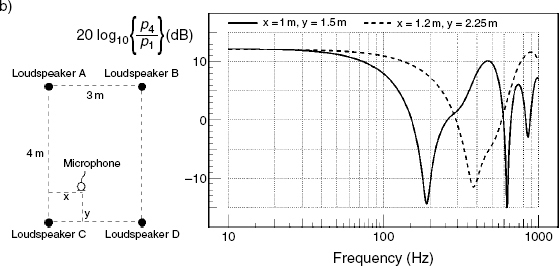
Figure 7.14 Frequency responses for four ‘perfect’ loudspeakers radiating the same signal. a) Total power response in a highly reverberant room. b) Combined frequency response of four omnidirectional loudspeakers at two different positions in an anechoic chamber
A wavelength is simply the distance in metres which it takes for a wave, travelling at the local speed of sound, to pass through a full cycle. The frequency, in turn, can be defined as the rate of change of phase with time, so the number of cycles per second is also the number of wavelengths that a sound wave will travel through in one second. The equation that relates frequency to wavelength, normally represented by the Greek letter λ (lambda), is:
![]()
where
| λ | = | wavelength in metres |
| c | = | speed of sound in metres per second |
| f | = | frequency in hertz |
For example, for 20 Hz and a sound speed of 340 metres per second:
![]()
For 100 Hz:
![]()
For 500 Hz:
![]()
For 1 kHz:
![]()
For 5 kHz:
![]()
![]()
This relationship ensures that the phase relationship between the acoustic pressures radiated from each loudspeaker will vary in all parts of the area between them. In fact, in free space, each quadrant shown in Figure 7.15 will be a mirror image of the adjacent quadrants, but when we take these loudspeakers into a room, the situation changes dramatically. The reflected energy from the room boundaries will complicate the sound field greatly. Unless all the wall surfaces and structures were absolutely identical, the symmetry of the quadrants would also be lost, because the absorption and reflexion properties would be asymmetrical. As the power radiated by the ideal loudspeakers that we are discussing is considered to be flat with frequency, (and let us presume that they are omnidirectional radiators) then the resulting sound field in a room with perfectly rigid walls would be uniform, with a flat response at all places, because the reflexion density would be so great as to ensure that all places receive all frequencies with all phase relationships. This is the integration process that was referred to at the beginning of this chapter when discussing reverberation chambers. Unfortunately, as neither anechoic chambers nor reverberation chambers make good control rooms, it means that all practical rooms exhibit frequency responses that are frequency and position dependent. The difference between the response of one loudspeaker in two different places in one room can often be greater than between two rather different loudspeakers in the same place in the same room. Room positioning is therefore a very critical subject, and sound control room designers go to great lengths to try to ensure consistent responses over the critical listening areas.
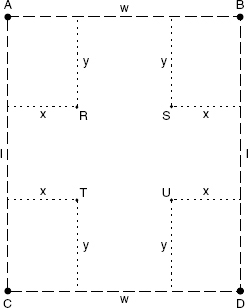
Figure 7.15 Symmetry of radiation patterns of multiple drivers
If loudspeakers at positions A, B, C and D are all radiating the same signal, the microphones at the symmetrical positions R, S, T and U would all receive the same signal. The response at each position would be identical
If we now go back to our four loudspeaker array, and consider its performance in a normal room, the effect on the low frequency performance can be very dependent on the musical signal. With a different instrument in each loudspeaker, the outputs are not correlated, so each loudspeaker will act as an individual source. If the loudspeakers are not symmetrically placed in relation to all three axes of the room, and if the room, itself, is not perfectly symmetrical in shape and construction, then each loudspeaker will drive the room in a different way, and some listening positions in the room may be better for some loudspeakers than for others. Conversely, from the listening position, some loudspeaker positions may be better than others in terms of the received flatness of response.
In the case where the loudspeakers are all receiving the same input signal, such as a centrally panned instrument, the situation changes. The correlated signal now means that there are four physically displaced sources, with a very fixed phase relationship between them. As previously stated, the central position would be the only one where the flat response could be received, even without the room reflexion complications. Furthermore, mutual coupling between the sources would also take place at frequencies where the distance between the loudspeakers was less than about a quarter of a wavelength, or where a boundary was within about an eighth of a wavelength of a source. The overall frequency response would thus change as the distance between the loudspeaker was changed, or as the loudspeakers were moved in relation to the walls, floor, or ceiling of a room. Not even one loudspeaker can produce a flat frequency response in a non-anechoic room, but when four loudspeakers radiate the same signal, the situation can become much more complicated. This is a subject that will be discussed further in Chapter 12.
The abovementioned effects have implications for signal panning, also. If a signal in one loudspeaker is panned into the centre of a pair of loudspeakers, the central image, when emanating from two loudspeakers, cannot have the same, in-room response as when only emanating from one loudspeaker. In a totally dead room, when each loudspeaker in a pair is radiating the same signal, the central phantom signal, on the central plane, will be 6 dB higher than the signal radiations from either the left or right loudspeakers alone. It will be 3 dB higher than the sum of the outputs of the left and right loudspeakers radiating individually. This is due to pressure summation on-axis, because when the pressure doubles, the response is 6 dB higher. In a reverberant room, no extra level will be detected at the listening position between a single, central source and the phantom sum of a stereo, two sided source, (except at low frequencies where mutual coupling occurs), because the room reflexions will tend to integrate the overall power response.
Most mixing console manufacturers use pan-pots which are about 41/2 dB down in the centre position, not only because most rooms lie somewhere in-between the anechoic and reverberation chamber responses, but also because mono electrical summing also needs pots which are 6 dB down in the centre (doubling the voltage gives a 6 dB increase). As was made plain in Chapter 1, even single loudspeakers are not simple devices. When we use them in multiples, the way that they behave is complex, and is anything but obvious to the majority of users. The acoustic summation of two loudspeakers, except on an extremely thin plane which divides them in an anechoic environment, does not sum like an electrical mix of the two signals. Few people using loudspeakers, even professionally, seem to realise that pan-pot laws are related to room acoustics.
To recapitulate, loudspeakers in normal rooms tend to sum power (double power =+3 dB), whereas pressures sum like voltages (double voltage =+6 dB), but the true pressure sum only exists on the central plane in an anechoic room. As 20 kHz has a wavelength of only 1.7 centimetres, and because only within a quarter of a wavelength can true summing be expected, then the full frequency range of the +6 dB summation plane is only around 4 millimetres wide.
7.6 Stereo perception in rooms
The man who conceived and patented the two channel stereo concept was Alan Dower Blumlein, working for the EMI company in England in the mid 1930s. In his patent he referred to a listener in a stereo seat. That seat was to form an equilateral triangle with two loudspeakers, which therefore subtended an angle of 60 degrees at the listening position. There is nothing about a pair of loudspeakers that creates stereo. The image that we perceive of a sound stage laid out before us is an illusion created within our brains. This is why we refer to phantom images, because there is no sound actually emanating from the directions from which we hear the images arriving unless they are coming from the extreme sides of the sound stage, i.e. out of one loudspeaker only.
Many loudspeakers are said to have good stereo imaging, but in reality it is not the loudspeakers themselves which have good stereo imaging. Good stereo imaging is perceived from loudspeakers that can supply the appropriate information to the ears which the brain can process as a phantom sound stage, but between the loudspeakers and the ears the signal has to cross the room, and rooms can do a good job of scrambling the information. The positioning of the loudspeakers in many studios in confined spaces, or where horizontal reflexions are likely, is guaranteed to diminish the stereo imaging perception from any pair of loudspeakers. Loudspeakers of only moderate imaging can easily out-perform potentially better loudspeakers if they are better located. There is nothing inherent in a loudspeaker's performance which give it the ability to create precise stereo imaging sensations independently of its mounting conditions.
In the open space of a domestic lounge, with large expanses of reflective walls, a loudspeaker with a wide, relatively flat off-axis response may tend to give the best stereo imaging. On the other hand, in the clutter of a cramped control room, a narrower directivity with a rolled-off bass power response, but still reasonably flat on-axis, may give the best stereo. It is just simply impossible to say which loudspeaker responses give which best results without knowing the acoustic conditions in which they will be used. Many commercial loudspeakers are designed to give the best results in the majority of the rooms in which their designers have expected that they will be used. Nonetheless, no matter how successful the design may be in the majority of cases, it still does not mean that that design is generally better than a design which takes a different approach. The positions of nearby reflective surfaces may strongly influence the choice of loudspeakers for a specific purpose.
Any fast reflexions of less than about 1 millisecond delay with respect to the direct sound (less than about 30 cm path length difference) will pull the image in the direction of the reflexion. Reflexions with more than one millisecond of delay will not do this, as the ear will lock the direction to the first arriving wavefront (known as the Haas effect, the precedence effect, or the law of the first wavefront) but colouration will result from the way in which the signals re-combine with different phase relationships, and transient signals will be smeared. If these things occur asymmetrically, say with a reflecting surface close to one loudspeaker of the stereo pair and not to the other, then the stereo imaging will surely suffer.
Floor reflexions are almost an inevitability, but as these will always arrive at the ear from the same horizontal angle as the direct sound, their effect on the stereo imaging is less noticeable. What is more, the ear is much less sensitive in the vertical plane than it is in the horizontal plane, presumably because humans and their ancestors have not had to worry about either predators or prey from either under ground or in the air. Ceiling reflexions tend to behave similarly if the loudspeakers are mounted high up. Wall reflexions can contribute to the spacial stability of stereo imaging, especially if the loudspeakers have a wide and flat off-axis response. It seems that the ear can detect reflexion patterns which are uniquely related to certain source positions, but it must be remembered that a phantom image has more than one source. The tendency is for stereo images to be more precise in highly absorbent rooms, but more spacially stable in rooms with some lateral reflexions. That is to say, the image in the stereo ‘hot seat’ will be better in absorbent rooms, but the images will tend to collapse towards one loudspeaker or the other as one moves off centre. Conversely, in more reflective environments, a wider area of stereo perception may be available, but nowhere will it be perceived with the precision afforded by the absorbent rooms. This situation has led to some varied approaches to the design of critical listening rooms, with different designers having different priorities.
7.7 Rooms for critical listening
The rooms in which musical instruments and their amplifiers will be used are usually designed to have some acoustic life which will enrich the sounds and help to inspire good performances. Stereo imaging is not a relevant concept in the design or use of such spaces because the images are almost invariably real, and not phantom. In the control rooms and listening rooms, on the other hand, stereo imaging is a great priority. There is a generally accepted philosophy in the design of such rooms that no reflexions should return to the listening area within 15 milliseconds of the direct sound or with a level above 15 dB below the level of the direct sound. This has led to the development of room geometries which deflect early reflexions away from the listeners, and only allow reflected energy to return via diffusely reflected surfaces. Philosophies such as the Live-End, Dead-End rooms use such principles2. Other approaches, such as the Non-Environment rooms, seek to maximally absorb all but the floor reflexions (although in some rooms, these too are absorbed), and provide life for the speech and actions of people working within the room by means of a highly reflective front wall3. As in the case with the hemi-anechoic chambers, if the source is set into the hard surface, it can only radiate away from it. If there are no reflective surfaces in the room to return the sound waves to the front wall, then no reflexions can bounce off the front wall in any way that could create either tonal colouration or image smearing. Readers wishing to study more about control room designs should refer to the Bibliography at the end of this chapter. Figure 12.19 also shows some design concepts for stereo listening rooms.
Room acoustics is a big and complex subject, but even when the room is ‘right’, and even when the loudspeakers exhibit exemplary performances, it only requires the introduction of furniture and equipment into the listening room, arranged in inappropriate places, to severely affect the perceived, overall response. In recording studio control rooms, the equipment needs to be readily accessible for practical reasons, but the positioning of the equipment needs careful thought. In domestic circumstances it almost goes without saying that no reasonable hi-fi enthusiast would put the dining room table and a few cupboards between themselves and the loudspeakers before listening, yet people, many times out of necessity, do very similar things in control rooms with the mixing consoles and equipment racks. In general, loudspeakers should be mounted in positions which are as unobstructed as possible, and careful thought should be given to the siting of nearby video monitors if sound-colouring reflexions are to be avoided.
Mounting loudspeakers high up is also not a recommended procedure, and Figure 7.16 shows how the tendency is then to listen from above one's head, which will not produce the same audible sensations as listening with the sound in front of one's nose. The high mounting in studio control rooms also tends to produce strong reflexions from the upper surface of the mixing console, which introduces time-smearing of transient sounds and colouration of more steady sounds. And whilst on the subject of mounting, Figure 7.17 shows how multi-driver, non-coaxial loudspeakers should be mounted. Many loudspeaker manufacturers now show such drawings in their instruction leaflets. The drivers should be kept in the same vertical line so that lateral movement of the listeners will not give rise to arrival time differences from the separate drivers in a cabinet; hence the stereo imaging and timbral colouration do not suffer so much. This point is easily demonstrated by feeding a pink noise signal to a loudspeaker and moving one's head laterally from side to side. The tonal change with the loudspeaker drivers displaced horizontally will be much more noticeable than with the drivers mounted vertically. Conversely, the listener could remain in the same place whilst an associate swivelled the loudspeaker; the effect would be substantially the same. Mounting reflective surfaces behind the listener as shown in Figure 7.18 should also be avoided if colouration is to be minimised.

Figure 7.16 When monitor loudspeakers are mounted at a steep angle, the high frequencies, in particular, arrive at the ears from an angle totally inappropriate for the perception of an accurate frequency balance. High frequencies will tend to be under-perceived when a listener is looking at the equalisation controls of the mixing console. What is more, unless the ceiling is highly absorbent, the low frequencies will suffer augmentation due to the proximity of multiple room boundaries. The off-axis radiation, shown by the continues lines, will also tend to reflect from the top surface of the console and smear the transient response
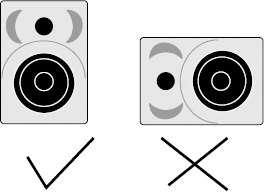
Figure 7.17 Orientation of loudspeakers.
It is preferable to mount loudspeakers with the drive units aligned vertically. When the listener moves to the left or right, the relative distances to the drive units will not change. If the loudspeakers are mounted horizontally, sideways movements will change the relative distance to the high and low frequency drivers, and give rise to phase shifts which will affect the perceived response, especially in the region of the crossover frequency
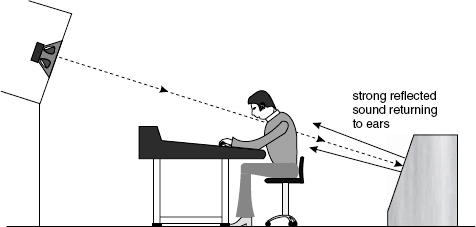
Figure 7.18 In many cases, an effects rack placed behind the engineer for easy access also performs the function of an acoustic mirror, returning strong reflexions to the primary listening positions. This is especially problematical when the main monitor loudspeakers are mounted high up
7.8 Electronic, digitally adaptive response correction
Electrical response-equalisation has long been a feature of loudspeaker design. The earliest forms were just simple potentiometers to adjust the tweeter levels to better subjectively suit their surroundings. Modern monitor loudspeakers with built-in amplifiers offer much more flexibility. Figure 7.19 shows the block diagram and the response flexibility of a Genelec 1030A monitor loudspeaker, designed to provide limited compensation for mounting conditions and boundary proximity. If the loudspeaker were to be placed close to a wall, the radiating space would be reduced, as described in Section 7.2, so the ensuing bass boost would be compensated for by suitable adjustment of the bass tilt and roll-off controls. As previously stated, such loading changes give rise to response changes which are of a largely minimum phase nature (which we shall look at in more detail in the following section), but many response variations which involve signal delays, such as reflexions, resonances and group delays due to filters and loudspeaker driver physical displacements, give rise to non-minimum phase responses. Such responses can often only be corrected by the use of acausal filters. ‘Acausal’ means effect before cause, and so these problems can only be dealt with by the insertion of signal delays which allow a filter to act on the signal before being incorporated into the output. There are no analogue solutions to such problems, so inevitably these methods reside in the world of digital signal processing.
The combined response of a loudspeaker and a conventional room is extremely complex. In fact it is absolutely, absurdly complex; far beyond what common sense would suggest. In the 1980s there was great excitement in some circles about the future of digital response correction, and it being the end of the line for room acousticians, but these expectations have not come to pass. It was widely believed that, despite the size of the problem, signal processing technology would develop apace, which indeed it has done, but complication after complication have arisen to confound many of the hopes. In fact, some excellent room/loudspeaker correction can indeed be achieved with modern technology, but there are prices to be paid for many of the improvements. As will be described further in Chapter 12, if one considers responses below about 100 Hz, and restricts oneself to dealing with largely minimum-phase problems, then signal processing can be put to some very good use. Loudspeaker manufacturers such as JBL and Genelec have adopted the philosophy that whilst a great many people will make decisions about professional sound recordings in less than ideal surroundings, largely due to the ever greater financial pressures, then active signal processing can make beneficial contributions to such environments. Using relatively inexpensive technology they can make improvements to conditions where neither space nor money allows for acoustic treatment. However, such responsible manufacturers also acknowledge that there is no real substitute for good room acoustics if the very highest levels of reproduction quality are required. In very good rooms, it can actually be the case that signal processing can introduce more problems than it solves, so one should always be aware of this.
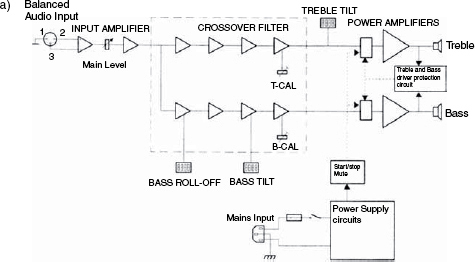
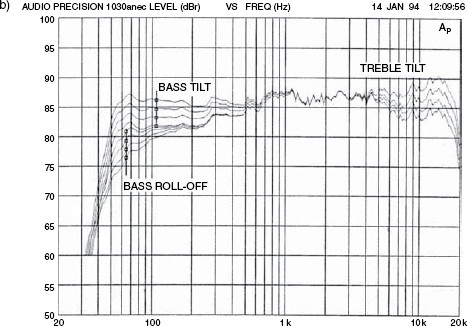
Figure 7.19 Controls and response flexibility of a Genelec 1030A loudspeaker. a) Block diagram showing active crossover filters, power amplifiers and drive units. b) The curves show the effect of the ‘bass tilt’, ‘treble tilt’ and ‘bass roll-off’ controls on the free-field response
It has also been shown that many systems of loudspeaker/room correction are only significantly beneficial at short distances4. Figure 7.20 shows the modulation transfer function (MTF) plots of three loudspeakers in a relatively neutral room at distances of one metre and four metres. The MTF scale (vertical) is really a measure of response accuracy in terms of information content; ‘1’ being perfect reproduction and ‘0’ being total inaccuracy. As can be seen from the one metre and four metre plots, the response accuracy generally tends to fall off with distance. (In an anechoic chamber the plots would be identical at both distances). Figure 7.21 shows the same loudspeaker responses after digital response equalisation. It is clear to see that the responses at one metre have been significantly improved, but no such improvement is evident at the four metre distance. The implication is that where the loudspeaker response dominates the overall response, in the close-field, the digital correction can be greatly beneficial, but in the far-field, where the complex room responses tend to dominate the overall response, the correction processes lose control over the response. It thus becomes evident that whilst such equalisation may be effective in the close-field monitoring situations of a poorly treated post-production room, it is no answer when a spacially uniform response is required in a large sound control room, where the non-minimum-phase room responses dominate, unless the room is well acoustically controlled. The MTFs are discussed in further detail in Chapter 9.
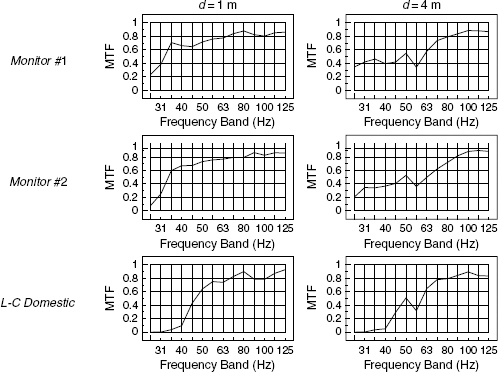
Figure 7.20 MTFs of three loudspeakers in a reasonably well-damped studio recording room at different distances (d) from the loudspeakers
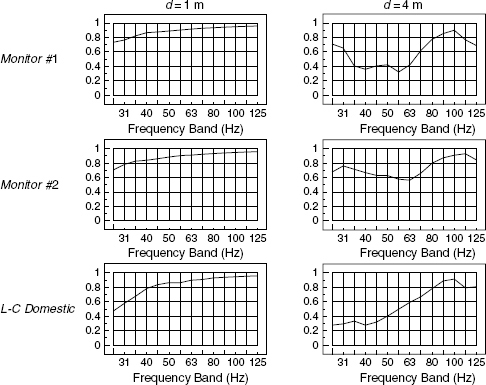
Figure 7.21 MTFs of the loudspeakers in a reasonably well-damped studio recording room at different distances (d) from the loudspeakers after equalisation
In 2004, Norcross, et al, published an overview of the situation in an Audio Engineering Society paper5. In the abstract to the paper, they stated “When the [response] is non-minimum phase, the artefacts [of the correction process] tend to become more severe and become distinctly audible. The artefacts produced by the inverse-filtering process can actually degrade the overall signal quality rather than improve it.” They recognised that without doubt, in many cases, the inverse filtering of a room/loudspeaker combination could improve perceived responses, but they were warning of the necessity to carry out very careful subjective listening tests before committing to the use of any signal processing system for professional purposes. Also, as discussed in Chapter 5, whenever digital signal processing is used in a way that needs immediate re-conversion to analogue, the converter quality is also critical if it is not to limit the resolution of a system. Digital processing is better employed within a digital signal chain and then passing the whole chain through only one re-conversion process. Once again though, when we are faced with a chain of processors, converters, loudspeakers and rooms, if only one link limits the resolution then other deficiencies in the chain may well not be noticed. Low resolution loudspeakers may not show the differences between good and very good processors or converters, and the decisions which are made on low resolution monitoring loudspeakers during the recording/mixing process may negatively affect the quality of a recording by not making evident the benefits of superior equipment.
The responses of most loudspeakers in rooms have a mix of minimum and non-minimum phase components, and the mathematically most correct inverse response may not always yield the most subjectively improved response. One loudspeaker may also prove to be more subjectively correctable than another, even where no obvious evidence for this can be seen from their uncorrected responses. Another factor which must be taken into consideration when applying complex inverse filtering is that the correction may be evident only in one small region of a room, and that in most other places the response may be significantly worse than before correction. A further related problem is where correction is used to flatten the axial response of a loudspeaker with an irregular off-axis response. As it is the same driver radiating the signal and its correction, it obviously cannot change the axial response by itself without also affecting the off-axis response. The reflexions returning from nearby surfaces with the modified off-axis response may be subjectively undesirable. It is thus very easy to publish the improved axial results, perfectly legitimately, but which do not reflect the true sonic situation in normal use. The significance of the off-axis response could also be very room dependent, in which case so could be the overall effects of the correction.
Furthermore, inverse filtering can produce pre-echoes, which can give rise to audible artefacts. These are inevitable by-products of certain types of inverse, acausal filtering that cannot be entirely eliminated. Sometimes, the processing artefacts can be as low as 60 dB below the signal, yet listening tests have shown them to be audible5. Every year, progress is made in the domain of digital signal processing. In live sound technology, the adoption of digital processing has been widespread, rapid and deep. Great strides forward have been made in terms of intelligibility and subjective sound quality. Obviously though, in live performance venues, audience noise, ventilation noise, and even the unavoidable air-related distortions resulting from the very high sound pressure levels close to the loudspeakers tend to mask any low level processing artefacts, so the benefits can clearly outweigh the penalties. Conversely, in recording studios, where the perception of small details is much greater than during live concerts, and where no visual performance is distracting the brain from concentrating on the sound, there have only been limited applications for the digital signal processing of monitor systems because of the great sensitivity to low level artefacts resulting from the correction algorithms. However, when people work on music recordings in rooms where computer discs and ventilation fans are whirring away, producing up to 40 or even 50 dBA at the principal listening positions, many subtleties of the recorded sound will also inevitably not be heard. It is imperative if high quality audio monitoring is to be achieved that such mechanical noises be banished from control rooms. There are no technical reasons why the noisy equipment cannot be located outside of rooms where high resolution loudspeaker monitoring is required. The introduction of so much noisy equipment into the lower level of studios has been a very retrograde step.
7.9 Minimum and non-minimum phase responses
In the previous section we mentioned non-minimum phase responses and acausal filters. A minimum phase system is one in which the phase shift associated with the amplitude response is the minimum that can be allowed whilst still exhibiting the properties of a causal system. A causal system is one in which the output never arrives before the input. In minimum phase systems there is a very strict relationship between amplitude and phase, and correcting either one will always tend to correct the other. The response boost at low frequencies given rise to by flush mounting a loudspeaker in a wall is an example of a minimum phase response change, which can be equalised with normal analogue filters to restore the free-field axial response in terms of both frequency response (amplitude and phase) and time response. The essential factor in a minimum phase system is that there is no appreciable delay between the generation of the signal and the effect of whatever is influencing it. If there is no appreciable delay, then there can be no appreciable phase shift, hence only minimal phase shifts will be evident. This is the origin of the term ‘minimum phase’.
In the case of non-minimum phase responses, amplitude correction, alone, cannot correct the phase responses. The Fourier transform is a mathematical means of linking the time domain representation of a signal to its frequency domain representations of amplitude and phase. The application of the Fourier transform to a signal waveform (time response) reveals the frequency components in terms of their magnitude and relative phase (i.e., the ‘spectrum’). The application of the inverse Fourier transform to the spectrum yields the original waveform. This unbreakable connection between the amplitude and phase on one hand, and the time response on the other, means that if the correction of a response in terms of its amplitude, alone, cannot correct the phase response, then the time response will not be correct. Transient sounds can be very dependent upon their waveforms in terms of their sonic characteristics, so non-minimum phase systems tend to have distorted time responses.
The far-field response of a loudspeaker system in a reflective room (but not in an anechoic chamber) is an example of a non-minimum phase effect. Here, there is a delay between the signal generation by the loudspeaker and the addition of the boundary reflexions to the composite signal at the listening position. The arrival time differences of the reflected waves give rise to phase irregularities which are frequency and distance dependent, so no simple manipulation of the amplitude response of the source can adequately compensate for the complex disturbances. This is why one-third octave-band equalisation of loudspeaker systems in rooms is only, at best, a very rough approximation of the application of the true inverse of the response, and also why many equalised systems sound no better, or even worse, than the unequalised responses. The equalisers may only, in effect, be moving the response bumps and dips around, and may actually be worsening the transient responses as they try to correct the non-minimum phase amplitude responses.
Another example of a non-minimum phase response is in the combination of the various outputs from crossovers, as discussed in Chapter 5. In any filter circuit, either mechanical or electrical, there are inherent group delays for any signals passing through them. The amount of group delay increases as the filter slope increases and as the frequency lowers. A crossover will consequently have a different group delay associated with each section. When the outputs are recombined they will therefore not produce an exact replica of the input signal. For this reason, conventional equalisation cannot be used to correct response errors at crossover points, and physical differences in the driver mounting positions may give rise to further non-minimum phase responses of the same general nature. Amplitude correction of the response irregularities given rise to by either the mechanical or electrical misalignments will lead to further phase distortions and hence further time response errors which may be noticeable on transient signals. The degree of deviation of a response from the minimum-phase response is known as the excess phase. Whenever time-shifted signals are mixed, the tendency is for the excess phase to build up.
Adaptive digital signal processing can deal with these problems, but it can realistically only be achieved to a very high degree at one point in space, or to a lesser degree over a wider area. In all cases, for every part of a room that benefits, another part of the room will suffer a deterioration in the response. In effect, the correction systems are redirecting the acoustic waves. It is a little like having a room with some finite layers of sugar cubes on the floor. The more that one builds up a pile in one place, the level must go down elsewhere. Very high quality control rooms and monitor systems tend to be expensive because there is really no substitute for high quality drive units in big boxes working in heavily acoustically treated rooms if flat, low distortion, high level, wide frequency band, spacially uniform monitoring is required. The problems must be eliminated at their sources, because electronic correction systems all have their compromises and drawbacks. However as mentioned in the previous section, if people will persist in trying to do professional recording in poorly controlled rooms on inexpensive loudspeaker systems, then digital correction may offer some overall performance benefits at affordable prices. Its application to sub-woofer processing will be discussed in Chapter 12.
In general, non-minimum phase response irregularities are difficult to deal with, and so are best avoided by the use of mechanical and acoustical means. The irony is that digital correction is best applied to rooms and components that are so good that they barely need correcting. For example, a related technology is the motional feedback of loudspeakers, where a sensor is placed on the woofer cone and is used to detect the actual cone movement. In Chapter 1, Section 1.5, it was noted how the entire surface of a diaphragm does not always move in unison. Consequently, a sensor on a cone only senses the movement at that part of the cone where it is placed. On transient signals, delayed, non-minimum phase responses can occur which risk wild instability in the system loop, which can be controlled by careful filtering, but the amplifiers tend to need to be much bigger than would normally be necessary in order to handle the superimposed audio signals and correction signals. The costs soon spiral upwards to a point where in many cases it would perhaps be better all-round just to build a better quality loudspeaker system in the first place.
No matter whether digital correction is being applied to the loudspeaker alone, or the loudspeaker/room combination, the need for this extra headroom always needs to be taken into account. This is one reason why large loudspeaker systems are rarely processed, because the amplifiers may need to be unreasonably large; and anyhow, large systems can be made with good transient responses and flat, low distortion frequency responses without the aid of signal processing. Given that the idea of motional feedback has been around since the 1930s6, the fact that it is still such a rarity suggests that it is not an easily realisable solution for electro-mechanico-acoustic transducer inadequacies. One of the greatest successes in active control has been in extending the lower frequency responses in relatively small boxes. Nevertheless, by whatever means that it is achieved, a given SPL requires a given volume of air to be moved at a given rate, so small drivers, no matter how they are processed, can still only achieve low SPLs at low frequencies.
References
1 Tyndall, J., ‘On Sound’, Sixth Edition, p 13, Longmans Green and Co., London, UK (1895)
2 Davis, Don and Davis, Chips., ‘The LEDE Concept for the Control of Acoustic and Psychoacoustic Parameters in Recording Control Rooms’, Journal of the Audio Engineering Society, Vol 28, No 9, pp 585–595, (September 1980)
3 Newell, P. R., Holland, K. R., ‘A Proposal for a More Perceptually Uniform Control Room for Stereophonic Music Recording Studios’, 103rd AES Convention, Preprint No 4580, New York, USA (1997)
4 Holland, K. R., Newell, P. R., Castro, S. V., Fazenda, B., ‘Excess Phase Effects and Modulation Transfer Function Degradation in Relation to Loudspeakers and Rooms Intended for the Quality Control Monitoring of Music’, Proceedings of the Institute of Acoustics, Vol 27, Part 8, Reproduced Sound 21 conference, Oxford, UK (2005)
5 Norcross, S. G., Soulodre, G. A., and Lavoie, M. C., ‘Subjective Investigations of Inverse Filtering’, Journal of the Audio Engineering Society, Vol 52, No 10, pp 1003–1028, (October 2004)
6 Colloms, M., ‘High Performance Loudspeakers’, 6th Edition, John Wiley & Sons, Chichester, UK (2005)
Bibliography
1 Newell, Philip., ‘Recording Studio Design’, Focal Press, Oxford, UK (2003)
2 Cooper, Jeff., ‘Building a Recording Studio’, Fourth Edition, Synergy Group Inc, Los Angeles, USA, (1984)
3 Davis, Don; Davis, Carolyn, ‘Sound System Engineering’, Second Edition, Focal Press, Oxford, UK (1997). NB: originally published by Howard W. Sams, USA (1987)
4 Walker, Robert., ‘A New Approach to the Design of Control Room Acoustics for Stereophony’, 94th AES convention, Berlin (1993)
5 Walker, Robert, ‘The Control of Early Reflections in Studio Control Rooms’, Proceedings of the Institute of Acoustics, Vol 16, Part 4, pp 299–311, UK (1994)
6 Walker, Robert, ‘A Controlled-Reflection Listening Room for Multichannel Sound’, Acoustics Bulletin (Journal of the UK Institute of Acoustics), Vol 24, No 2, pp 13–19, St Albans, UK (March-April 1999)
7 Newell, Philip, ‘Project Studios’, Focal Press, Oxford, UK (2000)