
The inquiries and report in Dynamics GP for budgets are good but fairly limited in functionality. Fortunately, another range of Dynamics products is available for use to report on budgets.
This is the Management Reporter 2012 financial reporting product. With the Dynamics GP 2013 Starter Pack (the base licensing pack), an unlimited number of administrator, designer, generator, and viewer licenses are available.
Management Reporter allows for the reporting of multiple budgets for periods, ranges of periods, or YTD. In this section, we'll take a look at producing a fairly simple budget for the Sales division using the 2017 SALES budget created earlier.
Before producing the report, you will need a fully implemented installation of the latest version of Management Reporter 2012 (at time of writing, this is Rollup 6). You also need security access to Management Reporter and a basic understanding of the reporting product.
We are going to cover a fairly simple report in this section in three parts showing how to create the row definition, column definition, and then the report definition, which pulls the first two together into a working report.
To create the row definition, follow the given steps:
- Launch Management Reporter 2012 and log into the Fabrikam, Inc. company as
normal. - Press Ctrl + Shift + R to create a new row definition.
- Click on the Edit menu and then click on Insert Rows from Dimensions.
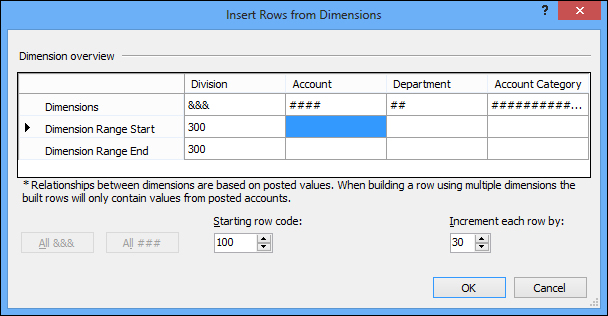
- In the Division column, perform the following steps:
- Enter
&&&into the Dimensions row. - Enter
300into the Dimension Range Start and Dimension Range End rows.
- Enter
- In the Account column, change the value in Dimensions to
####. - Click on OK to close the Insert Rows from Dimensions window and update the row definition.

- Click on Save.
- Enter
BUDGET-SALESin the Name field. - Enter
Budget – Salesin the Description field. - Click on OK and close the row definition.
This row definition is very simple in structure, and will give an overview of the figures for the Sales division. However, with the options on the report definition that we will set later, we'll be able to drill down and see more details.
To create the column definition, follow the given steps:
- Launch Management Reporter 2012 and log into the Fabrikam, Inc. company.
- Press Ctrl + Shift + C to create a new column definition.
- Enter
Descin the Column Type in column A. - In column B, perform the following steps:
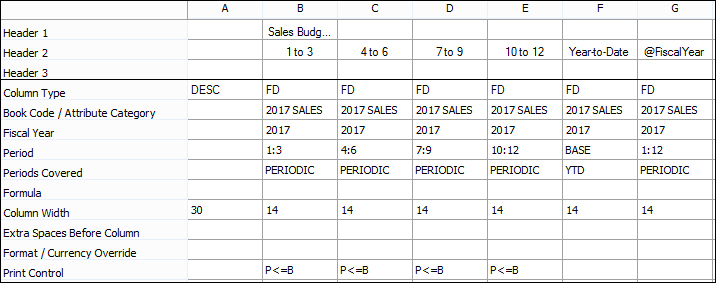
- Double-click on the Header 1 cell and enter
Sales Budget @FiscalYearin the Column header text and enterBin Spread from andGin Spread to. - Click on Ok to close the Column Header window.
- In Header 2 enter
1 to 3, which is the period range that the column will contain. - Enter
FDin the Column Type row which defines this column as containing either actual or budget figures from the financial dimension. - Enter
2017 Salesin the Book Code / Attribute Category row to select the required budget. - Enter
2017in the Fiscal Year row. - Enter
1:3in the Period row, which will calculate the figures for periods 1, 2, and 3. - Enter
PERIODICin the Periods Covered row. - Enter
P<=Bin the Print Column row.
- Double-click on the Header 1 cell and enter
- Repeat step 4.2 to step 4.8 for
4 to 6,7 to 9, and10 to 12in Header 2;4:6,7:9, and10:12in the Period row. - In column F, perform the following steps:
- In Header 2, enter
Year-to-Date. - Enter
FDin the Column Type row. - Enter
2017 Salesin the Book Code / Attribute Category row. - Enter
2017in the Fiscal Year row. - Enter
BASEin the Period row. - Enter
YTDin the Periods Covered row.
- In Header 2, enter
- In column G, perform the following steps:
- In Header 2 enter
@FiscalYear. - Enter
FDin the Column Type row. - Enter
2017 Salesin the Book Code / Attribute Category row. - Enter
2017in the Fiscal Year row. - Enter
1:12in the Period row. - Enter
PERIODICin the Periods Covered row.
- In Header 2 enter
- Click on Save to save the new column definition.
- Enter
BUDGET-SALES-2017in the Name field. - Enter
Budget – Sales 2017in the Description field. - Click on OK and close the column definition.
To create the default records needed for analytical accounting, follow the given steps:
- Launch Management Reporter 2012 and log into the Fabrikam, Inc. company as
normal. - Press Ctrl + Shift + P to create a new report definition.
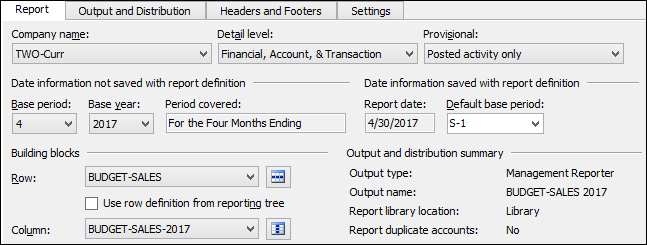
- Set the Detail level: to
Financial, Account, & Transaction. - Fabrikam, Inc. is operating in 2017, so change the Base Year: to
2017. - Set the Row: to
BUDGET-SALES. - Set the Column: to
BUDGET–SALES 2017. - Click on the Output and Distribution tab.
- Enter
BUDGET-SALES 2017in the Output name: field. - Click on Save to save the new column definition.
- Enter
BUDGET-SALES-2017in the Name field. - Enter
Budget – Sales 2017in the Description field. - Click on OK and close the column definition.
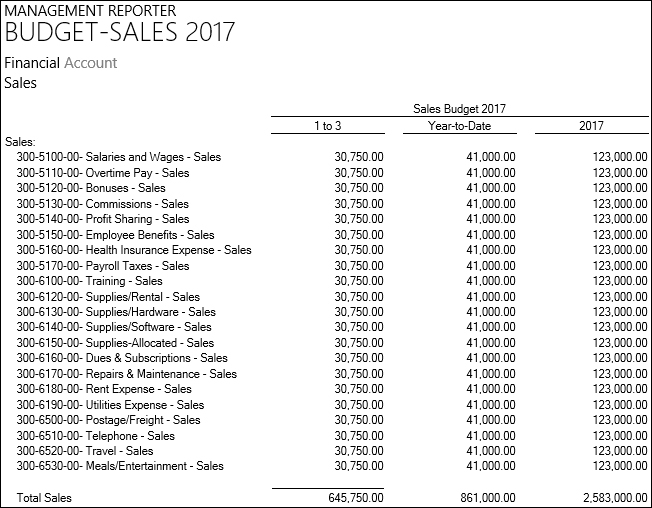
- Click on Generate to produce the report and launch the Report Viewer.
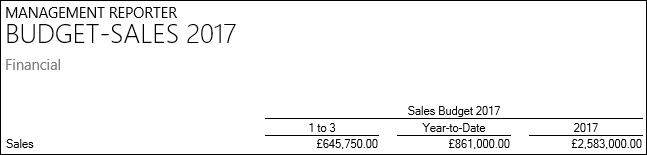
As the base period was set to April, the print control means only the first of the periodic columns displays on the report. Clicking on the line will drill down to the account level showing the breakdown of the budget values on the accounts.
As with report created in Management Reporter, additional columns can be added to the column definition to include actual figures in the report as well as calculation fields.