
TEST EQUIPMENT AND FAULT DIAGNOSIS
Several of the previous chapters in this book contain servicing and setting-up hints relating to the equipment dealt with there. It is the purpose of this chapter to concentrate on servicing and diagnostic matters entirely, since many readers are likely to be concerned with maintenance and repair to a greater or lesser degree.
SAFETY
For all equipment which operates from domestic mains supplies the first concern in servicing should be safety, particularly from electric shock hazard. While a risk of shock from internally generated voltage is present all the time the covers are removed, the most dangerous shock hazard is that of completing a circuit from mains live to earth. Since TV aerial systems can be expected to be earthed, and many other surfaces and equipment which surround the engineer may be earthed, it is essential that the main supply to the equipment under service is isolated. A double-wound and fully insulated isolating transformer is required, and to provide a suitably ‘stiff’ (low impedance) supply a 500 W type is recommended. Suitable fuses are a 5 A HRC type in the primary circuit, and a 2.5 A anti-surge type in the secondary circuit.
For field engineers the shock hazard on site is greater than in the workshop. Possible solutions are a large rubber mat on which to work, or the use of a portable isolating transformer: provided service is confined to reasonably modern TV sets a 250 W type suffices for diagnosis work. Test equipment for TV field work should not be earthed; it should be tested regularly for insulation integrity.
A second aspect of safety is the need for consumer equipment to maintain BS EN60065 and BEAB safety standards, as it did when it left the factory. These standards are mainly concerned with user safety, and are implemented by the OEM (Original Equipment Manufacturer); the requirement of the service engineer is that he does nothing to compromise the equipment safety. In practical terms, shock, fire and implosion risks are avoided by using OEM-sourced and approved components wherever a safety component (clearly marked by the symbol Δ or shading on the circuit diagram and/or parts list) is replaced, and by mounting it in the same way as the original. Particular care is necessary in the event of repairs to – or replacement of – back covers, cabinets, picture-tubes and user controls.
TEST EQUIPMENT
In effect the test equipment forms the eyes and ears of the engineer, who depends on its accuracy and reliability to interpret what is happening in the circuits being dealt with; but it is important to understand the limitations of the test gear and the effect of its use on circuit operation. Brief descriptions of the main classes of test instrument follows.
Multimeter
The traditional analogue multimeter is based on a sensitive large-scale moving-coil meter whose dial is calibrated in ohms, volts and milliamps, the latter two usually on a 3- and 10-full-scale deflection (f.s.d.) basis. Except for resistance readings it is a passive device, drawing energy from the circuit under test, the amount depending on the sensitivity of the moving coil. A basic 50 uA f.s.d. movement offers a sensitivity of 20 kΩ per volt on d.c. ranges, and the best known high-quality multimeter (AVO models 8, 9 and derivatives) have this specification, though more sensitive types, up to 100 kΩ/V, are available. The ranges of these types of meter are typically d.c. voltage from 3 V to 3 kV f.s.d.; a.c. voltage ditto, but at lower sensitivity; d.c. current from 50 μA to 10 A f.s.d.; a.c. current from 10 mA to 10 A f.s.d.; and three resistance ranges with which measurement between 1 Ω and 20 MΩ can practically be made. Lesser meters do not offer such wide ranges, especially of current measurement, but in all cases the ranges offered are quite adequate for servicing all types of consumer equipment. Since most general-purpose multimeters are subjected to accidental overload from time to time, a reliable cut-out/protection system is important. The AVO types score particularly here, with their electromechanical safety cut-out.
The passive multimeter is the most used general-purpose instrument in service work, but it has some limitations. Its accuracy is generally between ±1% and ±7% of f.s.d. depending on type and circumstances. Its loading effect on the circuit under test depends entirely on the impedance of that circuit. In high-impedance circuits an active meter must be used to prevent loading and thus achieve an accurate reading. It contains an amplifier to drive the meter movement, and typically has an input impedance of 10 MΩ on all ranges. This increase in sensitivity permits provision of much wider measurement ranges, which may now extend down to 10 mV a.c. and d.c., and up to 200 MΩ for resistance tests. On low a.c. voltage ranges it is important to bear in mind the effect of mains hum and time-base-radiation pick-up, however, especially when working on high-impedance circuits.
Digital meter
While the active multirange analogue meter overcomes the loading effect of ordinary multimeters, its intrinsic accuracy of reading is no better. A digital multimeter has much greater accuracy and higher resolution. It consists basically of a high-impedance precision voltage divider for range selection, an A-D converter and a digital readout system using a neon, LED, liquid-crystal or fluorescent display similar to those on videorecorder front panels. A typical instrument for general service work has a 3½ digit display whose maximum reading is 1.999 and decades thereof.
Digital multimeters (DMMs) come in various sizes and specifications; in all cases their greatest virtue is accuracy, which ranges from ±1% in inexpensive types to ±0.02% (two parts in 104) in precision 4½ digit bench instruments. Portable types are pocket size and offer typically 500 hours’ operation between battery changes due to a low-consumption LCD display. At the other end of the scale, mains-powered instruments have bright light-emitting displays and wide ranges – 29 or 30 ranges may be offered, though resistance ranges seldom go beyond 20 MΩ. Some sophisticated types have auto-ranging, in which it is only necessary to set the function (i.e. voltage, current, resistance) whereupon the level is automatically sensed, and units (mV, V; μA, mA, A; Ω; kΩ, MΩ) are displayed alongside the readout digits, together with an indication of polarity on d.c. ranges. DMMs are not easily damaged by the sorts of overload which would ruin analogue meter movements, but are vulnerable to accidentally applied pulse and e.h.t. voltage.
The main drawback with digital meters is the confusing display (known as fruit machine effect) where the measured quantity is not constant, i.e. a voltage line with superimposed mains hum ripple. The instrument samples the input condition several times per second, and if each ‘update’ is different, readings are difficult to take. Analogue meters make no such confusion, settling at the mean level of the varying quantity being checked.
Oscilloscope
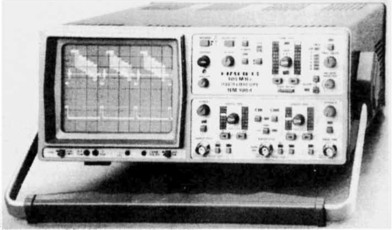
While the multirange meter is the most used test instrument, the oscilloscope is perhaps the most useful. Basically it provides a continuous plot of voltage against time, so that period, amplitude and waveshape of the applied input can be read off against a calibrated graticule over the screen. A typical bench oscilloscope for general service work, is pictured in Fig. 23.1.
The most important section of the oscilloscope is its Y amplifier, to which the signal is applied – two are incorporated in dual-trace types, which are essential to modern service practice. For general TV and video work, a bandwidth of 10 MHz is the minimum requirement; 20 MHz is better if it can be afforded. The second important factor is Y-sensitivity, invariably measured in millivolts per screen division: the screen is typically divided into 1 cm squares. A minimum sensitivity of 10 mV/div. is the requirement, though 5 mV/div. is better, and 2 or 1 mV/div. better still. In all ‘scopes a calibrated step-attenuator is used to set Y-gain, and at its maximum setting (greatest attenuation) a figure of 10 V/div. is typical. Normally the Y amplifier is a.c.-coupled via a large internal capacitor at the input socket to keep the trace centred on the screen, but maintain response down to about 10 Hz. For use as an accurate and fast-acting d.c. voltmeter this capacitor can be bypassed by setting the input-select switch to ‘d.c. coupling’.
A typical Y amplifier has relatively high input capacitance, and to reduce its loading effect on the circuit under test, a 10:1 attenuating test probe is generally used. This gives an effective load of 10 MΩ and 12 pF, but reduces the oscilloscope’s Y-sensitivity by a factor of ten. The test probe’s compensation trimmer must be set up on a squarewave input (often available at the ‘scope’s front panel) for ‘square corners’ – only then will readings at high frequencies be accurate.
The timebase section of the oscilloscope sweeps the light-spot over the tube face from left to right at constant speed, in identical fashion to that of a TV line timebase. Its sweep-speed control is calibrated in terms of time per division, and typically has a range (in conjunction with a vernier control) from 1 s/div. to 200 ns/div., often multiplied by a factor of five if required by an ‘X-expand’ switch. For examination of TV field rate waveforms a typical setting would be 5 ms/div., and for line-rate waveforms 20 μs/div. The output from the sweep generator is passed to the tube’s horizontal (electrostatic) deflection system via an X amplifier. Most oscilloscopes have facilities for application of an external signal to it, for use in X- Y applications.
The sweep generator must be triggered by some Y-signal-associated pulse to display a locked waveform, and trigger circuits are built into all servicing oscilloscopes. They can be driven via a separate front panel socket (EXT TRIG) or from either Y amplifier. Switches permit selection of positive- or negative-flank triggering; trigger level; and a built-in sync separator to permit locking at line or field rate from a composite video waveform. For TV and video work external triggering is recommended wherever it is possible. Some trigger circuits incorporate a variable delay (monostable type) in their path, useful for analysis of complex or transient waveforms.
The cathode ray tube is the heart of the oscilloscope, and the larger its screen the better. For best legibility a PDA (Post Deflection Acceleration) type operating at high EHT voltage (up to 15 kV) should be chosen; it gives improved performance in ‘strobe’ (short beam duty-cycle) applications.
Dual-trace ‘scopes have only one electron beam. At high X-scanning speeds the two Y amplifiers are gated to alternate sweeps, and at low X-scanning speeds a beam-chopper circuit switches between the two Y amplifiers to give the effect of two separate traces; in both cases traces ‘Y1’ and ‘Y2’ can be independently positioned on the screen by separate shift controls.
Other ‘scope terminals may be: sweep output; probe-calibration output; and Z (intensity modulation) input.
Frequency counter
The frequency counter is a digital instrument like the DMM, but is distinguished by its large readout length, typically 7½ or 8 digits. A precision internal reference crystal is used to time the open period of a signal gate – downstream of the gate is a pulse counter, whose accumulated count over (say) 1 second is readout on the display. With long gate periods considerable accuracy can be achieved, depending only on the accuracy of the internal crystal which may well be 2 ppm (2 in 106). The instrument can be easily checked and recalibrated if necessary by using a standard TV locked to a broadcast transmission: three widely different and highly accurate standards are available – field rate 50 Hz, line rate 15.625 kHz, and subcarrier frequency 4.43361875 MHz.
The main use for a frequency counter is in setting up colour-under circuits in video equipment, checking and setting SSG systems in colour cameras, and testing the operation of divider circuits. It is important to bear in mind that the digital frequency meter operates by counting zero-crossings of the waveform under test, so that where spurious components, or more than one frequency is present, erroneous or confusing readings will be obtained. A service-type counter commonly has a frequency range of 10 Hz to 200 MHz, and prescalers are available to extend this range upwards. Sensitivity is of the order of 10 mV r.m.s.
Test-pattern generator
The advance of IC technology has made possible the production of a wide range of relatively inexpensive pattern generators, ranging from battery-operated pocket types to full-facility bench models. All generate colour bars, grey-scale step wedge and a Crosshatch pattern of white on black for check and adjustment of picture-tube convergence. The more elaborate types can generate coloured rasters in red, green and blue for purity checks; circles and edge castellations for tests of scanning geometry and picture centring; ‘multi-burst’ in monochrome for frequency response and focus evaluation; special patterns for adjustment of colour decoders etc. There are complete composite pattern generators available which provide a test card similar to those used by the broadcasters – one such is featured in some of the off-screen photographs later in this chapter.
Simple generators have an output at a spot frequency in the UHF band – usually around Ch. 36. Bench-type instruments will generally have r.f.-modulated outputs over the UHF broadcast bands, and often at VHF and i.f. as well. Also incorporated will be a sound facility in the form of a 1 kHz tone, a baseband (1 V p-p) CVBS video signal, and possibly line and field sync pulse outputs. The composite-test-pattern generators are particularly useful in the service workshop, where their r.f. output can be ‘spliced’ into the UHF signal distribution system for use simultaneously at all benches.
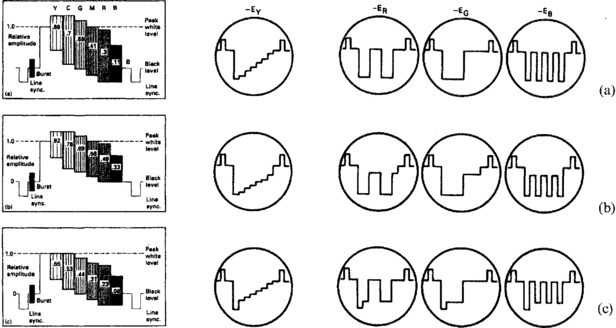
For colour bars, most generators provide 100% modulation, 100% saturation signals as used by the BBC. Other configurations are possible, however, and their effect on decoder and RGB waveforms should be borne in mind in decoder-RGB service and alignment. They are detailed in Fig. 23.2.
Vectorscope
The vectorscope finds its main use in the setting-up and alignment of colour-picture sources, particularly those using analogue devices, i.e. colour TV cameras. The circular screen represents one complete cycle of the colour subcarrier frequency, with the U axis at ‘three o’clock’ and V axis at ‘12 o’clock’. At rest the light spot is at screen centre; its angle of deflection is governed by the phase of the colour signal, and its strength of deflection by the amplitude of the colour signal. These instruments have two basic inputs, a reference subcarrier feed and the chroma signal itself.
The screen is calibrated in terms of the vector positions of the standard colour bars. A vectorscope display showing the burst and colour-bar axes for a standard signal is shown in Fig. 23.3.
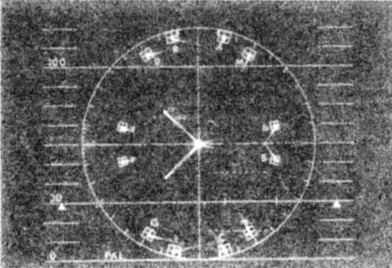
Fig. 23.3 Off-screen photograph of vectorscope display. The input signal is a standard colour-bar waveform. The boxes marked with capital letters (R, G, B etc.) correspond to the colour bar vectors on the ‘standard’ TV line, and the boxes marked with small letters (r; g, b etc.) those for the ‘PAL’ line. Photo courtesy Electronic Visuals Ltd, Woking
Spectrum analyser
The spectrum analyser gives an amplitude versus frequency plot of the signal applied to its input, and by varying the instrument’s scanning width, the user can examine energy distribution of a modulated signal, its sidebands and harmonics. Markers are provided to identify frequency and verify bandwidth. Spectrum analysers are useful and revealing instruments for checking filter response, videorecorder f.m. modulator characteristics, camera front-end electronics, and for identifying spurious signals, but in wide-coverage form are expensive and not sufficiently often used to justify economically except in large and specialist workshops. A very useful (and less expensive) version for service and aerial/distribution work is the UHF panoramic monitor, which uses a varicap tuner to scan the entire broadcast band, displaying the response on the screen. Adjustment of ‘shift’ and ‘zoom’ controls permits close and useful examination of individual broadcast carrier characteristics, as well as identification of spurious and interfering signals.
Logic probe
The logic probe takes the form of a hand-held device with an internal battery, a clip-lead for the ground connection, and a pointed prod for connection to the circuit under test. The logic indication is given as high or low, generally indicated by red and green LEDs respectively. Some types of probe have an audio output with separate tones for H and L indication. Where the probe is connected to a point carrying a pulse train the relative brightnesses of the H and L LEDs is proportional to the duty-cycle or pulse frequency at the point in question. Some probes have a third (e.g. orange-coloured) LED to indicate the presence of pulse activity – also signalled, where audio output is provided, by a warbling tone.
The logic probe is an inexpensive and convenient way of checking out operation in digital systems, especially in videorecorder syscons where parallel and single-line data is often used. Even for serial data lines and on parallel bus systems it can quickly indicate the presence or absence of pulse activity, and any ‘stuck’-high or -low lines. A great deal of diagnosis work in home computers, allied systems and peripherals can also be carried out with a logic probe.
In choosing a logic probe the important requirements are adequate overload protection; wide operating range, i.e. 5 V–15 V: wide frequency response to at least 20 MHz and ability to detect pulse trains with ‘mark’ widths down to 50 ns; compatibility with TTL, CMOS and MOS technology in microcomputers, microprocessors and the various forms of memory chip; an input impedance of 100 kΩ or more; and light but robust construction.
Logic analyser
While the logic probe is capable of indicating the status and the presence of information on a data line, it is unable to give an exact picture of the pulse train regarding pulse width, pulse spacing, and timing with respect to other data lines and to the clock signal. A dual-beam oscilloscope can indicate some of these things, but a stationary readable display is impossible with continually changing data on a serial-transmission line, and is time consuming even on a 4- or 8-wire bus carrying ‘static’ data. The need to analyse digital data fully arises surprisingly seldom except during in-depth diagnosis of computer malfunctions; in most domestic entertainment equipment an analogue meter, ‘scope and logic probe are adequate for diagnosis to component level, and for diagnosis of the faults in peripheral and ‘mechanical’ components which are so often at the root of problems.
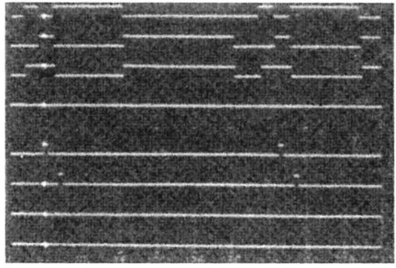
For full investigation of the operation of digital circuitry a logic analyser is required. Logic analysers can operate on serial or parallel data, and consist in essence of a series of latched registers, one for each line of the data bus, and where applicable the memory and/or control buses. At the required point in the program the data is ‘frozen’ by the latch system, then the register contents are continually read out into the Y-channel of an oscilloscope for analysis. The many parallel traces are generated by a beam-switching circuit operating synchronously with the ‘scope’s sweep generator. The data words are displayed in time-coincidence. Only one input to the oscilloscope is required – all other functions are handled by the logic analyser, A photo of an LA time-domain display is given in Fig. 23.4.
Picture tube tester/reactivator
The picture-tube is the most expensive part of a TV or monitor, and since it depends on thermionic emission, it is subject to wear. An indication of its condition is given by an emission tester, which plugs onto the tube base socket (discharge e.h.t. first) and sets up heater and gun electrode supplies to monitor beam current. In the best instruments three separate meters are used to simultaneously show the goodness of R, G and B guns for comparison. Such defects as inter-electrode short-circuits, slow warm-up and loss of vacuum are also indicated at this stage.
If low emission is indicated a reactivation process is possible, It is carried out by overrunning the tube heater for some seconds, then applying a positive voltage to the control grid. The resulting very heavy K–G current strips the oxide deposits off the cathode coating to expose a new emissive surface. This treatment is very effective, and can give a new lease of months or years to the tube’s life. A second ‘repair’ facility is provided to clear inter-electrode leaks due to conductive flakes lodging in the gun: a large capacitor is discharged across the afflicted electrodes, destroying or dispersing the conductive particle.
Signal strength meter
A useful indication of the strength of the received broadcast signal is given by an r.f. signal strength meter, which contains a standard UHF (and/or VHF) tuner, an i.f. amplifier and a meter, which generally monitors the a.g.c. control voltage required to maintain some specific level of detected video signal. Such an instrument cannot discriminate between signal and noise, and gives no indication of reflections unless it incorporates a miniature TV monitor; in the absence of this a sound detector and amplifier is usually incorporated to assist with identification of the broadcast being received. For a noise-free picture a signal level of 1 mV at the TV aerial socket is generally required, though modern TV sets give acceptable results down to below 250 μV provided the signal is reasonably free of noise.
Miscellaneous test gear
Apart from the main items so far described, the video-service jigs, tools and test cassettes covered in Chapter 18, and the variac and external power sources discussed in Chapter 11, there is a range of ‘secondary’ test equipment which is needed less often, or which is not fundamental to the servicing process.
Having to do with picture-tubes are degauss coils, with which the set, tube and magnetic shield, as well as external objects, can be demagnetised for correct purity; a microscope for checking of beam-landing accuracy in purity evaluation; and a reference light source, generally a fluorescent tube with the correct phosphor and ND filters incorporated to give a source of illuminant D at several levels for grey-scale matching. An e.h.t. meter or probe is also useful – an f.s.d. of 30 kV and impedance of >300 MΩ are typical of a practical instrument.
An insulation tester is necessary for safety checks to BEAB and BS EN60065 requirements. Be it self-powered or hand-cranked, a high applied voltage (see OEM specifications) and high resistance-reading capability are required.
A signal injector is useful for first-line and field checks on signal-dead equipment. It consists of a transistor or IC multivibrator whose basic output is in the a.f. range, but whose harmonics extend to very high frequencies. It will often help locate the point of loss of a signal – audio, video, chroma or even pre-detector, but misleading effects can result from breakthrough or radiation.
A component test-bridge can check passive components out of circuit with great accuracy, but seems to find little use in the average workshop. For testing capacitors a hand-held checker with LCD readout is available, but practice has shown that its ‘OK’ indication is not necessarily a guarantee that the capacitor will perform properly in service.
PRACTICAL SERVICING
In general the servicing process consists of three distinct steps: (a) diagnosis of fault; (b) repair or replacement of faulty component or assembly; and (c) setting-up, alignment and test. All three apply equally to mechanical, electronic and optical aspects of TV and video equipment. It is important to separate these three aspects of service work as far as possible. While diagnosis by substitution may be necessary where information, expertise, test equipment or (in some circumstances) time is lacking, it is far better to carry out careful analysis of the symptom and a logical process of reasoning – aided by progressive test readings – to identify the faulty component.
There are several exceptions to the rule, especially where (as is usually the case) the labour time in diagnosis must be held to the absolute minimum. Where the fault is an intermittent one, cross-substitution (e.g. of picture-tube cathode feeds, or of L and R channels in audio systems) is invaluable, especially where – as in the examples given – the fault can be made to give a positive indication of its origin when it appears. For complex faults the problem area can be considerably narrowed down by substituting complete sections or PC boards where possible. In cases where components (ICs, tuners, modules etc.) are pluggable and a substitute available, it is expeditious to test in this way. On the other hand, haphazard trial-and-error methods of faultfinding are likely to damage printed circuits and delicate components, multi-legged ICs and wound components, especially where tightly packed PC boards (many double-sided) are used in miniature and portable equipment. The time spent in this pursuit can often be more profitably used in analysing TV-screen images, voltages and waveforms.
It is good practice to spend the first few minutes (or more) of service attention in a careful and close visual examination of all sections of the equipment – a high proportion of failures are due to ‘physical’ causes like corrosion; damaged, split or cracked circuit boards; burnt, broken or misplaced components; intermittent joints or contacts; faulty plug/socket connections; and spark or corona discharge of one type or another. If no obvious problems can be seen, the next logical step is a check of supply voltages to appropriate sections of the equipment – not only in respect of correct voltage, but (particularly in the case of digital circuits) the degree of ripple and spurious noise riding on them. The presence of input signals, and correct operation and connection of peripheral components should next be checked for. Failure to do this could result, for instance, in a long diagnosis session in a videorecorder servo only to find that the control track head is dirty; the replacement of a TV tuner because the aerial has been blown down; or the replacement of a TV picture-tube whose heaters are not being energised! Only when it is proved that there are no physical problems, power lines are present and correct, input signals present and output or load devices connected need fault diagnosis begin in the signal-, power- or data-handling stages themselves, in the sequence: signal in, operating conditions, signal out. Reference to the OEM’s service literature is essential at this stage, not only to establish the layout and operating mode of the circuit and components, but to refer to the d.c. voltages and waveforms quoted for normal operation.
ICs are always direct-coupled internally, so that an incorrect pin voltage should lead to a check of the externally derived voltages on associated pins (refer to the IC block diagram) before condemnation of the chip itself. Where a clamping or gating action takes place inside an IC, incorrect ‘static’ voltage levels may well be due to a missing or badly shaped keying, trigger or gating pulse. In digital and especially processor chips, all relevant inputs should be checked in the event of an incorrect or missing output, bearing in mind that apparent loss of an input signal can be due to a stuck-low input gate within the chip itself.
Many circuits, analogue and digital, have feedback loops. While this may appear to complicate the task of fault-finding, it can often help, in that under fault conditions the two ‘loose ends’ of the loop move (electrically) in opposite directions in an attempt to restore normality. Thus the loss of an FG feedback signal will usually vastly increase a videorecorder’s capstan speed to aid diagnosis; a low gain UHF tuner in a TV will result in a ‘go-to-full-gain’ a.g.c.-line message to the tuner even with high applied r.f. input level; the chopper transistor in a switch-mode PSU will have a high duty-cycle waveform applied to its base in the event of no output due to its collector lead opening, and so on. Again, analysis of all symptoms, and rational thought, should lead to a speedy diagnosis.
Experience, both of diagnosis and fault patterns in general, and especially of the particular equipment under service, counts for a great deal. Many a problem has been very quickly solved on the basis of ‘hunches’ and a knowledge of the habits of various classes of components. Large electrolytic capacitors tend to dry up and reduce capacitance, especially when mounted in hot places; some sorts of transistors are prone to go b-e open-circuit in certain circuit configurations; heavily loaded drive belts in video decks will slip under heavy loading conditions – the list is very long. An experienced engineer is aware of all these things, and thus often able to short-cut much of the diagnostic procedure.
Some quick checks are easy to understand and follow. A 10 kΩ wire-wound resistor with 200 V across it is intact if it is very hot, and open-circuit if it is cold to the touch. A multirange meter’s prods form a handy and instant shorting link with the meter switched to its 10 A range. An analogue test meter, provided its sensitivity is known (e.g. 20 kΩ/V d.c., 1 kΩ/V a.c.), is a useful switchable substitute resistor provided the applied voltage will not overload the movement. The test voltage on an ohms range will switch on a transistor junction. These are but a tiny selection of time- and trouble-saving techniques.
In support of the approach to fault-diagnosis suggested above, the off-screen photos on the following pages have been chosen not as simple cause-and-cure cases (diagnosis by ‘stock-fault’ lists is seldom relevant to modern equipment) but as illustrations of logical testing and analysis, and of how much information can be gained by careful study of picture symptoms. The same principles apply to situations (i.e. deck malfunctions, digital logic faults etc.) where the convenience of a ‘screen’ fault display is not present, necessitating close observation or the use of test instruments at the outset.
SYMPTOM ANALYSES
Fig. 23.5 shows a snow-and-noise bar across the extreme bottom of a videorecorder playback picture from a known-good tape. The effect is due to mistracking, and because it is confined to one section of the picture it is unlikely to be due to a servo fault, or maladjustment of the tracking control. The bottom of the picture corresponds to the top half of the tape ribbon, and is read out by the head as the tape leaves the head wrap. The implication is that the tape exit angle from the drum is wrong, and it is likely that the trouble is confined to the exit guide or the adjacent section of head rabbet. The need for cleaning and position checking is more likely than a need for height adjustment unless the guide is loose or has been disturbed.

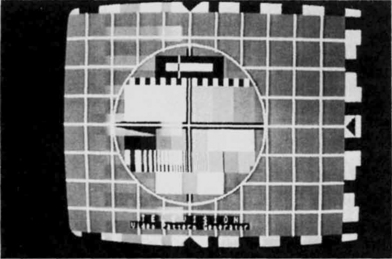
In Fig. 23.6 appears another videorecorder fault, this time in the form of a glass-like bar of picture disturbance on replay of a tape recorded in a faulty machine. In fact the bar is the visible effect of a wrongly timed head-switch point during record. Normally it is hidden at the bottom of the picture by the action of the head-drum servo which should ensure that the changeover point takes place at a point in time just before the field sync pulses. If the offending bar is stationary the first check, should be on the setting of the record switch-point preset and the monostable it controls. If the bar drifts up or down, an unlocked head servo is indicated; the correct action then is to check for correct playback servo lock on a known-good recording. If good lock is achieved the likelihood is that off-air field syncs are not reaching the head servo during record. If not, the head servo itself is suspect, and a first check would be for correct output pulses from the drum tachogenerator.
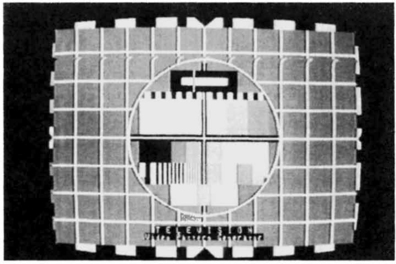
Fig. 23.6 The horizontal tearing effect near the top of the circle is due to an incorrect head-switch point
The display of Fig. 23.7 is symptomatic of white crushing, and could arise in a camera, TV set, monitor or video recorder. It can normally only take place in a video signal amplifier, and the trouble source is easily traced with an oscilloscope, progressively checking the video waveform until the non-linearity becomes evident. At this point the bias, supply voltage, input level and feedback arrangements should be checked.

It is possible for the symptom to arise from overdeviation of an f.m. modulator or signal distortion (‘bottom crushing’) in an a.m. i.f. amplifier – check bias and a.g.c. voltages.
Another video-stage fault is pictured in Fig. 23.8. The picture is heavily shaded from left to right and badly smeared. An immediate conclusion is that the luminance signal(s) is deeply modulated at line rate, and that it stems from a large ripple on some l.o.p.t.-derived power supply line. The most heavily loaded and worked is that for the 180 V or 200 V h.t. supply for the RGB output stages.
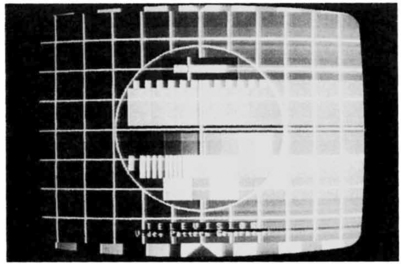
Fig. 23.8 Smearing and shading, due here to a lack of decoupling on the h. t. supply rail to the video output amplifiers
Most sets use flyback rectification to derive this supply, and since the picture is dark (high supply voltage) at left, which immediately follows flyback, and brightens (low supply voltage) as line scan progresses, the obvious conclusion is that the 180/200V -line reservoir is low capacitance due to leakage or drying up.
The display of Fig. 23.9 is a familiar one, and is due to a poor S/N ratio in the vision signal. First check (preferably with another TV) that aerial signal strength is adequate, and that the r.f. connections to the tuner are correct. If so, the next check should be of the applied a.g.c. voltage to the tuner, sometimes easiest done by applying a known correct voltage to the a.g.c. input pin. The persistence of the symptom with correct gain-control voltage incriminates the tuner, whereas restoration of a good picture shows that the r.f. a.g.c. circuit (or its control pot) is in need of attention. Any ‘low gain’ fault which gives this degree of noise must invariably be in an early stage of the signal-handling circuits; low gain in the final i.f. amplifier stage or in post-demodulator circuits gives a flat ‘milky’ picture rather than a snowy one.

The multiple images of Fig. 23.10 illustrate a case where the TV screen is better diagnostic instrument than any piece of test equipment. The problem here is due to signal reflections, and the strength and position of the ghost image with respect to the main one indicates the amplitude and delay of the reflected signal, the latter easily calculated on the basis of 1 μs equals 1/52 picture width, which can then be expressed if required in terms of signal path length.
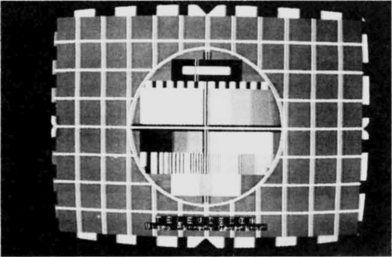
Fig. 23.10 Ringing. Double- or multiple images are the result of reflections in the signal path – to the aerial, in the downlead or distribution cable or within the receiver
While ghost images can arise from reflection of the UHF signal from hills, tall buildings etc., they can be generated within the equipment: this photo was taken with the ground connection of the luminance delay line open to give multiple reflections along the line.
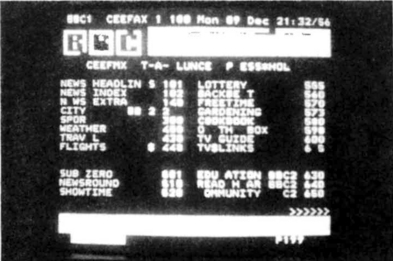
A likely effect of much shorter-term signal reflections appears in Fig. 23.11. Here a page of text shows corruption, in which the incorrect and missing characters result from misinterpretation of data. It can be caused by a faulty text decoder, but this is unlikely where its power line, grounding and video input signal level are correct. Apart from an eyeheight check with a ‘scope on the data lines, see Chapter 8, little can be done with ordinary test instruments. If the r.f. tuning and vision demodulator ‘tank’ coil tuning are correct, here is a justifiable case for testing by substitution – starting, perhaps, with a complete text-equipped TV set, because the aerial, distribution system, and downlead or feeder are prime suspects in these cases.
Moving onto the timebase sections of a TV or monitor, a picture display like that of Fig. 23.12 again rewards careful analysis with an almost certain diagnosis. Here the screen is grossly overscanned in the vertical direction, with evidence of bad non-linearity. This indicates a large increase in the power applied to the field scanning coils. Of several possible causes, those of an increase in the intrinsic gain of the field amplifier, or a large rise in the supply rail voltage to the field timebase are very unlikely; in the latter case, other symptoms would probably be present.
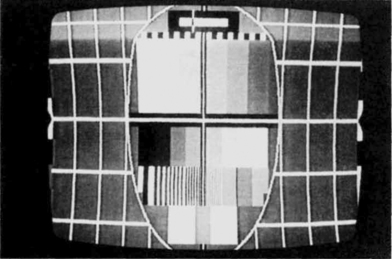
Fig. 23.12 Vertical overscan and distortion arising from an open feedback loop in the field-scan amplifier
An increase in generated ramp height is again unlikely, and could be quickly checked with an oscilloscope. The first check, though, should be made at the main output negative feedback loop which here is open-circuit.
The opposite effect, field collapse, is the subject of Fig. 23.13. Careful study of the resulting single scanning line, however, reveals a slight undulation of the line at the extreme left, and this is the effect of a ringing pulse induced into the field scan coils from the line-scan pair at flyback. This arises from a lack of damping in the field coil circuit, and is indicative of an open yoke circuit. The field scan coils themselves are rarely responsible, and investigation is generally confined to the coupling components between coils and output stage.

Fig. 23.13 Close-up of left-hand side of screen showing line-flyback excitation of vertical scan coils
A single vertical white line, where scan and e.h.t. are derived from the same flyback transformer, is likewise indicative of a break in the immediate circuit of the scan coil, typically due to a defective or dry-jointed S-correction capacitor or scan-balance coil.
A line timebase fault is depicted in Fig. 23.14. The basic problem here is a gross timing error between line scan and video signal, causing the line blanking period to appear on the screen. Its likely causes are perhaps less obvious without some thought. It is seldom possible for this error to arise in the line sync phase detector itself in a flywheel system; much more probable is that either its reference (incoming line sync) or feedback (line flyback) pulses are suffering an abnormal time delay. A check with a dual-trace scope will probably eliminate the former, and identify a problem in the pulse-feedback circuit between l.o.p.t. and line sync chip. A change in resistor value or leakage in a capacitor is often responsible.
Faults in PSU systems are common, and while many of them result in complete loss of picture and sound, others give a display symptom which immediately identifies the fault area, and sometimes the actual component. Fig. 23.15 shows one such. The picture has two ‘wasp-waists’ which shows that the main power line bears a strong 100) Hz ripple. This can only come from a full-wave mains rectifier system, and is almost certainly due to failure of the primary reservoir capacitor in the PSU. The bulging effect will generally move slowly up or down the screen because mains a.c. is not synchronous with TV transmissions.
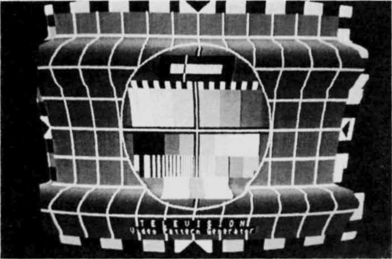
Fig. 23.15 100 Hz ripple modulation of horizontal scan, indicating a fault in the mains section of the power supply
A single wasp-waist is an almost certain indication that one of the four diodes in the rectifier bridge is open, resulting in half-wave rectification.
The screen image shown in Fig. 23.16 shows horizontal overscan, which would most likely be due to a fault in the flyback tuning of the line output transformer (check the capacitor(s) across the line output transistor c-e junction); a fault or maladjustment in the E–W raster correction circuit (start by checking whether the width control works); or an increase in supply voltage to the line output stage. While the latter possibility should certainly be checked, it is an unlikely one because the PSU over-voltage protection would normally prevent the fault being displayed.
TEST CARD FEATURES
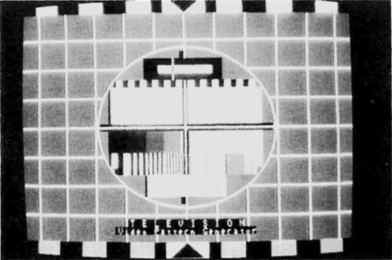
The final screen picture, Fig. 23.17, is an (almost!) fault-free reproduction of the test card used in the previous shots, which is representative of the general-purpose types used by broadcasters and in factories and workshops. The main features of the card shown here are as follows:
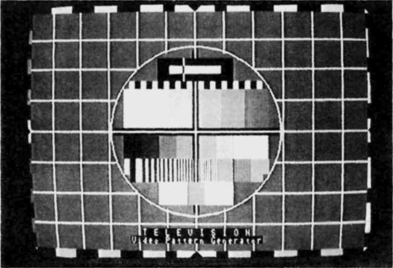
1. Crosshatch pattern: checks convergence/RGB registration, best judged without colour in the picture. Colour fringing should be zero at screen centre, minimal at the edges and corners
2. Border castellations: these define the edges of the pattern, and should be half visible on all four sides. The colours, positioning and brightness of the border castellations are designed to check (a) the sync-separator performance – shortcomings cause picture cogging or pulling along castellation lines; and (b) burst-gate timing, which if incorrect causes hue errors in horizontal bands aligned with the red or blue (LHS) or yellow (RHS) castellation blocks
3. Centre circle: provides a check on scanning amplitude and linearity. It should be perfectly circular
4. Black/white rectangles: these, at the top of the circle, offer a video l.f. response check; poor l.f. response shows as streaking to the right of white-to-black and black-to-white transitions. The needle pulses within the rectangles are designed to emphasise any ghost images which may appear to their right
5. Black-white squarewave pulse train: just above the colour bars, these blocks check transient and i.f. video response. There should be no ringing, overshoot, pre-shoot or ‘smudging’ on them
6. Colour bars: the colour bars just above the centre of the circle are, left to right, yellow, cyan, green, magenta, red, blue. Their characteristics vary with the design of the pattern as in Fig. 23.2. Here they are 75% amplitude, 100% saturation as per Fig. 23.2(c)
7. Grey-scale steps: immediately below the centre of the circle, the eight steps in the wedge represent linear graduations of luminance signal amplitude. The difference in brightness between adjacent rectangles should be approximately constant, with the first block just at beam cut-off point and its neighbour clearly differentiated from it
8. Multiburst: the frequency gratings correspond (from left to right) to approximately 250 kHz, 500 kHz, 1 MHz, 2 MHz, 3 MHz, 4 MHz and 5 MHz, not all of which are visible in this picture. On colour sets the final two generally contain cross-colour patterns, while low-band VCRs can only reproduce the first five
9. Colour-fit pattern: inside the circle at the bottom appear yellow-red-yellow rectangles as a check of chroma/luminance registration. The redness of the central rectangle should fit snugly between the yellows
TRACING INTERMITTENT FAULTS
Of all equipment malfunctions, intermittent faults are the most difficult and frustrating to trace and diagnose. Provided that operating conditions are not ‘borderline’, i.e. weak tacho pulses, low supply-line voltage, PSU starting resistor gone high resistance etc., they usually have their origins in mechanical or ‘thermal’ effects. Bad jointing on PCBs or within components, as well as hairline board cracks etc., can usually be traced by flexing, probing and tapping of PC boards – once the fault has been made to appear, use test equipment to prove its origin for a definite diagnosis.
Intermittent faults which are temperature-dependent can often be traced to a single component (very often a semiconductor) by the alternate use of gentle heat from a hairdrier and an aerosol freezing spray. The most vulnerable and suspect components for thermal faults are diodes, transistors, ICs and to a lesser extent ceramic and electrolytic capacitors. ‘Mechanical’ intermittent problems are most often due to dry joints (sometimes concealed under an apparently good solder blob), potentiometers, switches, plug/socket interfaces and board-print faults. The most vulnerable joints are those which carry heavy (e.g. scanning and primary power) currents, and those which support heavy or iron-tagged components like transformers and large electrolytic capacitors.
The main aim in diagnosis of intermittent faults should be to get positive indications of the identity of the faulty component or section. Thus a solder-up of suspect board joints or replacement of suspect components followed by a fault-free test period is not as satisfactory as a cross-substitution test of stages, panels or individual components, in which the fault can be reproduced in isolation. Whether this takes the form of transferring an intermittent blue picture to an intermittent green one by interchanging B- and G-output transistors, or an indisputable meter reading at some crucial point in the circuit during the presence of the fault, it gives complete confidence in the diagnosis and the repair.
It is important to glean every clue from the equipment user in cases of alleged intermittent faults. Analysis of these can considerably narrow down the field of search. In difficult cases, it is necessary to leave the equipment with diagnostic instruments (ideally redundant and aged test gear saved for the purpose) hooked semi-permanently on key test points.
PCB PRACTICALITIES
The second aspect of service after fault diagnosis is repair and component replacement. Ease of repair and access varies enormously between different make, type and vintage of equipment. Unsoldering of PCB-mounted components, especially multi-legged types, is most easily done with a small hot soldering iron and commercially prepared desoldering wick, which consists of resin-impregnated copper braid to absorb old solder as it is melted. A useful alternative, especially for use with double-sided and plated-through-hole boards, is the solder pump, a spring-loaded vacuum device; the most effective is the type in which it is combined with a mains desoldering iron whose bit is made in the form of a hollow nozzle.
The very tightly packed double-sided PCBs used in cameras, camcorders and portable videorecorders are the most difficult to deal with – see Fig. 1.3. Many of their components are SMD (Surface-Mounting-Device) types, which are soldered direct to the print panel on both sides of the board. These pinhead-size transistors, resistors, links and capacitors are glued to the board surface in manufacture, then soldered to the print in a bath-wave operation. To remove them, one or more small hot soldering irons are required to simultaneously release all connections. For multi-legged SMDs like miniature ICs it is usually necessary to use a specially designed desoldering station with hot-air blower and heat shields for both de-soldering and subsequent fitting of the replacement chip. It is important to be sure of the diagnosis before changing components on these high-density assemblies, and to closely consult the manufacturer’s service information in all cases.
STATIC PRECAUTIONS
Increasingly, C-MOS and similar IC technology is being incorporated in consumer equipment, and careful handling of these devices is required to prevent damage from static electricity charges. The necessary precautions are to ground the soldering iron and (by means of an earthed wristband) the operator; to keep the replacement device in its conductive packing until the moment it is to be fitted; to temporarily ground the circuit into which it is being fitted: and if possible to keep its leadouts strapped together until the fitting/soldering operation is complete. A wide range of accessories is available to combat the risk of ESD (Electro-Static Discharge) damage. They include conductive bench- and floor-mats, heel/toe dischargers and devices to check for static charges and for the efficacy of wristband dischargers.
SERVICE MANUALS AND DOCUMENTATION
Unless one is very familiar with the equipment under service it is foolhardy to attempt diagnosis on any but the simplest equipment without a service manual, preferably that produced by the OEM. Most manufacturers and some specialist and trade magazines produce fault-finding guides and algorithms, lists of common faults, modifications and spares ordering information. All this information should be carefully filed, along with personal notes and findings, by make and model.