CHAPTER 
Performance measurement and improvement

 INTRODUCTION
Case study
In 1989, the staff at the Hollola Roll Finishing plant were given an ultimatum by Valmet Corporation, their parent company: Turn around the plant and make a profit within the next 18 months, or you will be shut down. Just 12 months later, the plant was not only making a profit, it had become Valmet's best-performing unit, and other plant managers – and even management professors – were coming to Hollola, a small city in Finland, to see how it had been done (Blackmon and Boynton, 1994).
Hollola manufactured a critical piece of the equipment for papermaking; the systems that remove finished rolls of paper from the papermaking machines, then wrap, label, and move the rolls to finished goods storage. When Hollola's roll-finishing systems didn't arrive at the customer site on time, or took extra time to start up, or failed to work, then the entire papermaking plant was delayed in starting up.
All 90 of Hollola's staff attended a 2-day survival meeting, at which they completely mapped out the existing processes, including marketing, R&D, production and field service. They then completely transformed the system's design, and figured out a way to use information technology to support the process from beginning to end. The new reference model system (RMS) not only supported the plant in all of the steps in delivering value to customers; it also helped the company dramatically improve its performance in time, inventory, product quality and other important aspects.
You have probably heard the saying ‘What gets measured gets done’. People make decisions and do their work at least partly based on how they will be evaluated. As a result they tend to improve in performance aspects that will be measured and rewarded, rather than in unmeasured aspects, even it these do not necessarily support organizational goals or customer satisfaction. As anyone who has called up Directory Inquiries with a tricky request will know, call-centre operators who are evaluated on the number of calls that they handle during a given time period will try to minimize the length of calls rather than search for the right number.
Measurement is not only a way of determining what has already happened, which is like ‘driving by looking in the rear-view mirror’, but is also a way of getting people to act in ways that will bring about desired future outcomes. Aligning performance measurement with organizational goals can be a significant challenge. This is noticeable when different ways of working are being introduced – for example, total quality management (TQM) and just-in-time (JIT) – if performance is still being measured using standards based on old-fashioned, mass production ideals.
Another problem is that performance measurement in operations has been largely accounting-driven, so that financial goals predominate. Accounting and operations must work together to support long-term organizational competitiveness and world-class performance. The problem is that financial measures are often short term. For example, a firm's financial performance is measured in quarters – a matter of weeks! – by the financial markets such as the Dow on Wall Street in New York and the Stock Exchange in the City of London. Consequently, long-term strategic performance measurements can sometimes be sacrificed in order to satisfy short-term financial targets.
 Aims and objectives
This chapter introduces the concepts of performance measurement and performance improvement. The first section reviews the basics of performance measurement for operations management. The second section looks at kaizen, and ways to analyse and continuously improve processes. The final section introduces some techniques for more radical improvements in performance, process re-engineering and benchmarking.
After reading this chapter you will be able to:
![]() Distinguish between measures of economy, efficiency, and effectiveness
Distinguish between measures of economy, efficiency, and effectiveness
![]() Describe the traditional and enlightened bases of performance standards
Describe the traditional and enlightened bases of performance standards
![]() Apply different techniques for improving operations.
Apply different techniques for improving operations.
 PERFORMANCE MEASUREMENT
Performance measurement systems measure the inputs and outputs to an operation in order to determine how well (or poorly) the operation is using them. Performance measurement is important to all functional and strategic areas within an organization, but it is especially critical to operations management because of the direct impact operations has on the business in terms of efficiency (processes), including the acquisition (purchasing) and use (inventory) of materials through the business.
The objectives of any operation must include making the best possible use of resources, which can lead to lower costs and higher profits. As seen in Chapter 1 these resources include transforming resources such as facilities, technology and people, and transformed resources such as materials, energy and other natural resources, and financial resources.
The value added by operations must also be considered. For operations to be self-sustaining, the economic value of outputs must be higher than the economic value of the inputs. In addition, the organization will want to concentrate on those products that have higher value-added and discontinue those with lower value-added.
 Historical performance measurement
The major focus of traditional performance measurement is financial performance. The performance measurement systems used in modern business originated in the systems of double-entry book keeping developed in Venice during the fourteenth century. These formed the basis for the financial measurement systems that developed in the mid-nineteenth century for the American system of manufacture. These accounting systems were appropriate for keeping track of the repetitive production of large quantities of standardized products using standardized parts in mass production.
As businesses grew larger, elaborate management accounting systems were developed for external reporting and internal control. The principles for external accounting and financial reporting were introduced in the 1920s, and have remained largely unchanged since the 1930s. These were developed to standardize reporting performance to external monitoring agencies and shareholders. These systems focused mainly on financial statistics such as sales, cost of sales, profits, assets and liabilities. However, they also became widely accepted for measuring the performance of manufacturing and distribution operations. This led managers to make poor decisions, because these systems measured the wrong things in the wrong way, and motivated people to do the wrong things.
 Economy
Going back to the ideas expressed in the transformation model, performance measurement systems for operations management have focused on measuring inputs and output. These translate into operations performance measurements of economy, efficiency and effectiveness.
A primary concern of operations management has been monitoring and/or reducing costs. Economy describes the level of use of resources in creating and delivering products and services. Performance measures based on economy are improved by using less of a particular resource. For example, one performance measure for a fleet of buses might be the amount of petrol used during the year, and its cost.
Purchasing managers are often responsible for a number of performance measures based on economy. For example, they may be measured by how much they have reduced the cost of a particular purchased component or module compared to the cost of the previous year. Effective cost management is important, because up to 70 per cent of product or service costs are typically incurred within the operations function.
 Efficiency
A more useful measure than economy is efficiency. Efficiency describes how well the operation does in transforming inputs into outputs. Measures of efficiency contrast actual product or service output with the standard for that product or service. Typical measures of efficiency focus on the units of product or service produced per employee or per unit of time.
Traditional performance measurement systems often focus on measures of efficiency – that is, the level of outputs produced relative to inputs such as labour and equipment. Traditionally, product costs have been computed by adding together overhead costs and the direct cost of labour and materials. Overhead costs are costs that cannot be associated directly with particular processes or outputs, such as administrative costs, sales, research and development, and capital expenditures, which must be allocated across the organization. These are usually calculated as a percentage of direct labour hours, but may also be allocated to machines according to their maximum output capacity. The efficiency ratio is simply:
![]() measured in individual variables – e.g. labour, machine hours, and space.
measured in individual variables – e.g. labour, machine hours, and space.
However, there are concerns with the efficiency ratio: it can be made to look artificially strong simply by reducing the number of inputs. For example, if a firm divests part of its operations, then typically its efficiency ratio will appear to be stronger. However, such divestment is not sustainable over the long term, because the firm will go out of business. So we need to be a little careful: if we see that the efficiency ratio is × per cent now and was y per cent last year, it sometimes pays to ‘get behind the numbers’ to see the reasons for the change.
Standards and variances are based on an accounting approach to performance measurements. In this system, a standard measurement is first developed for each input or output, which focuses on time and/or cost. For example, the standard output for a process might be determined to be 100 units per hour. If the process actually produces 75 or 125 units, then a negative variance of –25 units or a positive variance of +25 units from the standard occurs, which must be accounted for by the operations manager.
Along with direct labour, performance measurements may also use equipment usage as the denominator in performance measures. Two measures of machine utilization are: the actual time a machine is producing output compared with the available time; and the proportion of rated output that a work centre is producing.
As you can see, traditional performance measurement concentrates on direct inputs (especially labour), and thus on keeping people and machines fully occupied, whether or not they are producing the right products at the right time in the right amount. Direct labour costs were a significant part of the costs of producing goods when traditional performance measurement systems were introduced, and are still significant for many service operations. Major criticisms that have been levied against this way of thinking are that it emphasizes internal rather than external measures, focuses on conformance, and is short-term in orientation – in other words, it reflects the time and motion study mentality of the mass production era.
These measures focus on whether people are being kept busy producing output, rather than if they are producing the right things. One operations outcome of this way of thinking has been a focus on reducing direct labour hours, reflected in practices such as downsizing and outsourcing.
 Effectiveness
Efficiency is a better measure than economy, but effectiveness is better than either. Effectiveness concentrates on whether the right products or services are being produced, rather than on how efficiently they are being produced. Examples of effectiveness measures across the organization include market share, profitability, competitor growth rates, raw materials, direct labour, indirect labour, R&D, overhead costs, capital costs, product features, customer service, product quality, brand image, manufacturing, distribution, sales force, information technology, human resources and finance.
 New approaches to performance measurement
Traditional performance measurement systems were useful in the relatively stable competitive environment that persisted through the 1960s, but began to be questioned during the 1980s and 1990s. A particular weakness was its cost focus, which is only one of the key performance criteria that operations supports. In particular, new performance measures are needed to support manufacturing techniques such as TQM and JIT, which emphasize process rather than outcomes. Further, performance measurements must support a change in focus from management to customers.
During the 1980s, accounting and manufacturing groups began working together to develop organization-wide systems that more accurately reflect product variety, quality and customer service. Compared with the financial focus of traditional performance measurement systems, these emphasize clear, commonsense measures that reflect trends and long-term improvements, provide decision-making support, and direct and motivate workers.
Two of the more well-known approaches to performance measures that developed during this period are activity-based costing (ABC) and the balanced scorecard. These two practices are briefly discussed below. Whilst they are not specifically limited to operations management, they have direct relevance.
 Activity-based costing
Activity-based accounting (ABC) is an accounting method for realistically estimating costs for products and services, and ultimately for supporting strategic decision-making. As seen above, traditional cost accounting systems measure labour costs, machine costs and materials costs at the unit level (one unit of product or service), and assign common costs among multiple products on the same per-unit basis. Larger quantities of a product are penalized by assignment of a larger share of these common costs, since they are charged a larger share of overhead costs even when they do not actually create higher costs.
Activity-based costing tries to proportion common costs to products based on the resources that the products or services actually consume. Instead of relying on standard cost-accounting procedures, ABC defines activities and cost drivers that accurately reflect resource consumption. Cost drivers are selected based on what actually causes the cost of an activity to increase or decrease, rather than direct labour hours or machine utilization. Furthermore, ABC allows costs to be allocated at the unit, batch, process or plant/organizational level.
The five steps to implementing ABC are:
1 Identifying all activities performed in the operation
2 Categorizing activities as value-added or non-value-added
3 Selecting the cost drivers
4 Allocating the total budget to the activities
5 Identifying the relationships between cost drivers and activity centres.
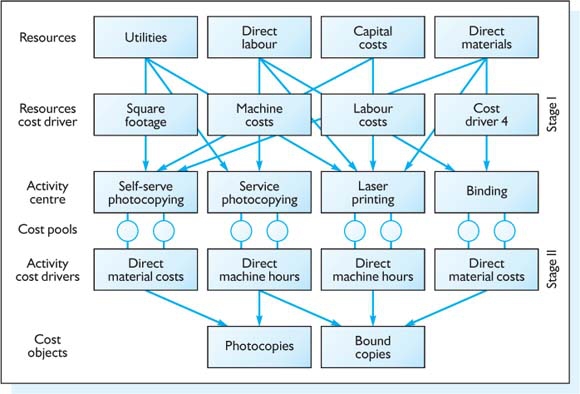
Figure 10.1 The two-stage cost allocation process.
Most ABC systems use a two-stage system for allocating costs to products or services, as shown in Figure 10.1. The cost pools represent the resource costs allocated to a particular activity centre, such as a machine, or a particular function within a service operation.
ABC systems can be used to improve product decisions through more accurate costing, engineering design through life cycle and parts costing, cross-functional decision-making through accurate process costing, and continuous improvement through identifying value- and non-value-added activities. However, ABC systems are not perfect ways of allocating costs, although they fit with operations logic much better than traditional cost-accounting systems.
 Balanced scorecard
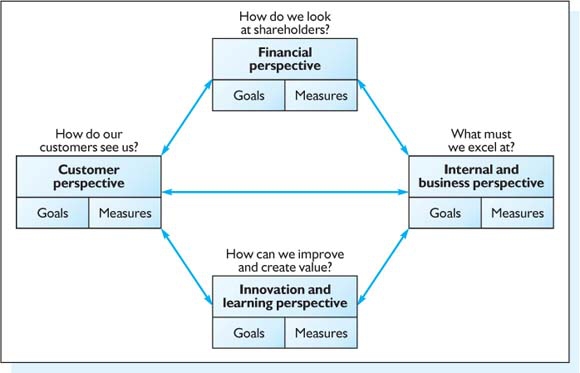
Another performance measurement tool that has been widely taken up by top management is the balanced scorecard. The balanced scorecard was developed by accountants Kaplan and Norton (1996) to represent how well an organization performs with respect to different stakeholder groups. Figure 10.2 shows a generic balanced scorecard. The balanced scorecard is really targeted towards senior management, but operations managers may find themselves responsible for activities that show up on the scorecard.
Figure 10.2 The balanced scorecard (Kaplan and Norton, 1993).
 Designing a performance measurement system
An enlightened performance management system measures the right things rather than things that are easy to measure, in order to change the way people work and to support strategy. Enlightened performance measures must be balanced, dynamic, timely and efficient, measure key processes (including asset utilization, productivity, quality and improvement), and focus on customer satisfaction (Table 10.1).
Whilst enlightened performance measures include financial performance and productivity, they focus more on effectiveness and value-added measures rather than ratios of outputs to inputs. One way of enlightening performance measures is to base them around processes rather than outcomes.
A performance measurement system should support both operations and the overall corporate strategy. At the operations level, performance measures should link processes to strategic objectives, and motivate both workers and managers. They should balance financial measures with non-financial measures such as measurements of waste and of customer satisfaction. Over the long run, good performance measures will help support organizational transformation and organizational learning, and sustain competitiveness.
Table 10.1 Traditional and world-class performance measurement systems compared
|
Traditional |
Enlightened |
Purpose of measurement |
External reporting |
Information for improvement |
Emphasis |
Profits |
Continuous improvement |
Cycle times |
Long |
Short |
Production |
Batch |
Continuous |
Volume |
High |
Just right |
Inventory |
Buffers |
Eliminated |
Waste |
Scrap and rework |
Eliminated |
Design emphasis |
Engineering |
Manufacturing/customer value |
Employee |
Deskilling |
Involvement |
Environment |
Stable |
Rapid change |
Enlightened performance measurement systems are those that are:
![]() Relevant
Relevant
![]() Integrated
Integrated
![]() Balanced
Balanced
![]() Strategic
Strategic
![]() Improvement-oriented
Improvement-oriented
![]() Dynamic.
Dynamic.
In order to be relevant to operations, performance measures should be primarily non-financial. Process-based performance measures are particularly relevant in operations management, because they relate to a particular process and can be used and maintained by people working in the process. Good process-based measures provide very quick feedback on performance. They can often be visually displayed in the workplace as charts, graphs and other pictures that can be quickly and easily understood. Such visual management is a key element of Japanese practices.
Performance measurement systems should be aligned with strategic priorities (Kaplan and Norton, 1993); in operations, this means being aligned with manufacturing/operations strategy. New performance measurement systems should take into account not only current measures, but also strategic objectives. They should be focused around critical success factors, and take into account trends that might affect the organization.
As you will see later in this chapter, performance measurement systems should support improvement as well as monitoring. To support improvement performance, measures should be simple and easy to use, and provide fast feedback.
They should also be dynamic, rather than static, so that they can monitor and respond to changes in both the internal and external environment (Bititci et al., 2000) through changing over time as needs change. Performance measurement systems can also harness computer and communications technology. Bititci et al. (2000) suggest that corporate Enterprise Resource Planning (ERP) systems can be used to support dynamic performance measurement systems.
 Enlightened performance measures in practice
Process measures include those of layout, inventory and throughput, such as manufacturing lead time, customer lead times and supplier lead times, schedule performance and equipment effectiveness.
Enlightened performance measures are related to performance objectives. Enlightened quality measures might include measures of waste and errors, such as failure and error rates, distance travelled and order changes. A final category of enlightened performance measures is measures of improvement and innovation, such as investment in employees, including employment and training.
Process-based measures are more useful in operations than results-based measures, which relate to broader issues or targets for larger organizational units. Results-based measures usually comprise data collected in the workplace that are analysed and presented somewhere else. They are still useful, however, as management information, although they are often too detailed to be useful in the workplace.
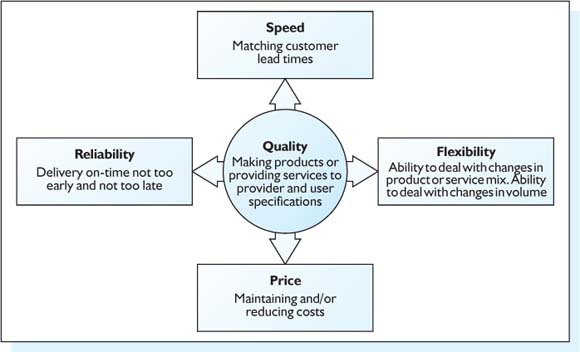
The new bases of performance measurement for operations are shown in Figure 10.3.
The changes in organizations and their environments have fundamentally altered the relationships between organizations, employees, customers, suppliers and other stakeholders. Performance measurement systems should reflect these changes. However, traditional managerial accounting systems focus on uniformity rather than utility. Special issues relating to service operations and supply chain management are briefly raised below.
Figure 10.3 Enlightened performance objectives.
 Service operations issues
In designing a performance measurement system for a service operation, special consideration should be given to whether the operation being measured is a front-room or back-room operation. The principles underlying back-room performance measurement are similar to those underlying manufacturing performance measurement systems, but those applied to front-room performance measurement also need to focus on service quality and customer satisfaction.
The service–profit chain emphasizes the role of service quality and customer satisfaction in overall service business performance.
 Supply chain issues
Performance measurement in supply chains has been profoundly affected by changes in customer requirements, particularly for reliability, speed and quality. On-time deliveries have become an order-qualifier in many industries. Short-lead times are becoming the norm in many industries, as are six-sigma quality or zero defects in delivered items.
Supplier performance on these objectives is even more closely scrutinized when single-sourcing and supplier-base reduction (for example to support just-in-time manufacturing) is used. Performance criteria become very different from traditional relationships, which were adversarial and focused on purchase price reduction, achieved through negotiations and playing competing vendors off against each other. Supplier performance must be carefully tracked and monitored so that the right vendor can be selected and certified, and the relationship developed over time. Key criteria become quality, reliability, just-in-time delivery, and lead time.
Experience with companies such as Amazon.com is also training consumers to have much higher expectations of delivery speed and product availability. In some major metropolitan areas customers are too impatient to wait even for overnight delivery, and same-day delivery has been implemented for immediate gratification.
 CONTINUOUS IMPROVEMENT
An effective performance measurement system must be in place so that the organization can assess how well (or poorly) it is doing, and identify where to target its performance improvement efforts.
There are two different approaches to improving performance:
1 Kaizen (continuous improvement)
2 Radical improvement (big leaps in improvement).
 Continuous improvement
Continuous improvement is a management philosophy that sees quality improvement as an ongoing process of incremental improvement rather than once-and-for-all or episodic series of major improvement efforts. A key aspect of continuous improvement is setting demanding but achievable objectives, and feeding back achievements against these objectives.
Kaizen describes the Japanese concept that major improvements come through a series of small, incremental gains (Imai, 1986, p. 3):
The essence of kaizen is simple and straightforward: kaizen means improvement. Moreover, kaizen means ongoing improvement involving everyone, including both managers and workers. The kaizen philosophy assumes that our way of life – be it our working life, our social life, or our home life – deserves to be constantly improved.
Continuous improvement is an essential element of total quality management, which was introduced in Chapter 8. Another aspect of TQM, actively involving employees, is central to continuous improvement. Continuous improvement can take place in any situation, but will often be focused around quality circles (QCs).
Many organizations have adopted continuous improvement, especially for processes, where continuous process improvement is used to improve products and services through improving the inputs and processes used to produce them. This approach is clearly evident at Toyota, who state (Brown, 1996):
All Toyota employees in their respective functions pledge to:
![]() Consider customers first
Consider customers first
![]() Master basic ideas of QC; adhere to the cycle of management; plan, do, check and act; judge and act on the basis of concrete facts and data; provide standards to be observed by all concerned; all personnel should contribute to kaizen
Master basic ideas of QC; adhere to the cycle of management; plan, do, check and act; judge and act on the basis of concrete facts and data; provide standards to be observed by all concerned; all personnel should contribute to kaizen
![]() Put them [QC ideas] into practice.
Put them [QC ideas] into practice.
The reason for doing so is:
. . . to improve corporate robustness so that Toyota will be able to flexibly meet challenges.
Quality circles can play an important role in achieving and maintaining process and product quality. Although the circles were initially developed in Japan, they have been one of many ideas ‘transferable’ to the West. It must be kept in mind, though, that quality circles will be successful only if senior managers are prepared to be committed to implementing ideas for change that might come from the quality circles. For example, Huge (1992, p. 71) observes how Japanese companies that are successful global competitors use quality circles to achieve the following:
. . . an astounding 20–100 suggestions per employee with over 90 percent implemented compared to less than one suggestion per employee in UK companies; lower absenteeism – 1 percent compared to 7–11 percent for UK companies.
Toyota refer to quality circles as ‘small group improvement activities’ (SGIAs). Although quality circles will differ according to the nature of the industry in which they operate, common features tend to include:
1 Identifying a particular problem that a group needs to investigate
2 Forming a group, from a range of levels and across a number of functions within the firm
3 Freedom to suggest improvements from every member within the group
4 Decisions on implementation are left, largely, to the group
5 Disbanding the particular group and the creation of further ad-hoc groups for other quality investigations.
This not only serves as a means of improving process quality; QCs also greatly enhance employee involvement, and feelings of responsibility and morale are heightened. This is spelt out by Toyota (Toyota Motor Corporation Human Resource Division – QCs):
At Toyota we recognize the following three primary aims [for QCs]:
1 To raise morale and create a pleasant working environment that encourages employee involvement
2 To raise the levels of leadership, problem-solving and other abilities; and
3 To raise the level of quality, efficiency and other worksite performance.
The Japanese transplants make extensive use of quality circles. For example, in the Marysville Ohio plant, Honda's QCs are a part of everyday life and are an integral part of their approach to manufacturing.
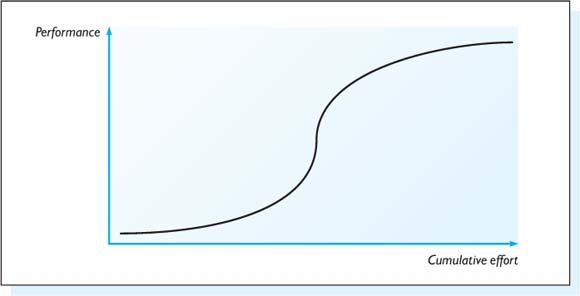
The amount of enhancement that can be gained from improvement activities varies over time, as shown by the S-curve model (Figure 10.4). This shows how large gains (relative to effort) can be achieved early on in the improvement cycle, whilst later on much higher levels of effort are required to achieve improvements.
Many tools have been developed to help work teams and quality improvement teams take a structured approach to improvement. The PDCA (planning, doing, checking and analysing) cycle describes an overall approach to continuous improvement, whilst the five-why process, the fishbone diagram and Pareto analysis are associated with process improvement.
Figure 10.4 The S-curve model for incremental improvement.
 The PDCA cycle
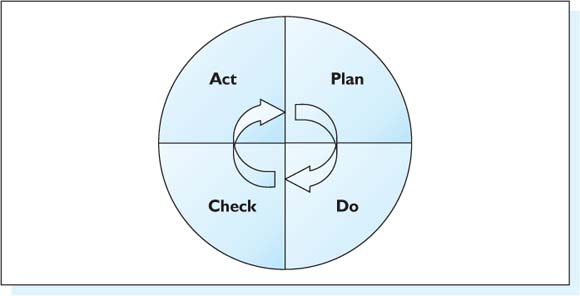
A tool called the PDCA cycle (Figure 10.5) is often associated with continuous improvement. The PDCA cycle was popularized by W. E. Deming, the quality expert, although Walter Shewart was actually its originator.
PDCA stands for the continuous improvement steps: planning, doing, checking and analysing. The PDCA cycle is sometimes called the Deming cycle. The PDCA was developed in the USA by A. W. Shewhart, and introduced to Japan by W. E. Deming, and reintroduced to the USA by Shigeo Shingo.
Figure 10.5 The PDCA cycle.
Planning involves developing a plan or strategy for improving, beginning with collecting data, defining the problem, stating the goal and solving the problem. Doing refers to implementing the plan. Checking means monitoring the improvement, and collecting and analysing data to see how well it is working. Acting follows checking, keeping the changes in place if they are successful or analysing them and remedying them if they are unsuccessful.
In continuous improvement the PDCA cycle does not stop with acting, but starts a new PDCA cycle. Instead of being a static wheel, the PDCA cycle for continuous improvement becomes a wheel rolling downhill!
 The fishbone diagram
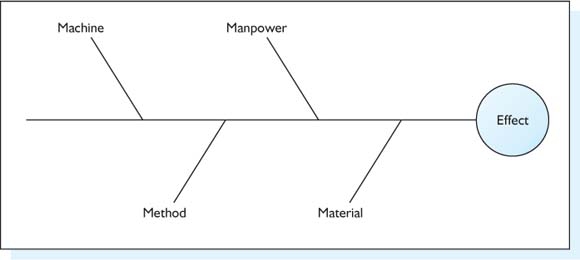
Another type of cause–effect diagram (besides the five-why) is the fishbone, which was developed by Ishikawa. Ishikawa is chiefly remembered as the founder of quality circles. The Ishikawa (or cause and effect) diagram is one of a number of tools and techniques that can be used within these groups and can be a valid discipline in the pursuit of ongoing process quality improvements. Continuous improvement groups will brainstorm for ideas and divide problem awareness into basic categories, using these as the basis for the Ishikawa diagram (as shown in Figure 10.6.
The diagram is important in focusing efforts to improve upon specific areas. Often firms’ continuous improvement groups will rank problems in order of importance, or award a percentage value to the problem. For example, in the above diagram it may emerge in an actual group session that material problems account for 50 per cent of the whole problem, with methods accounting for 10 per cent, machines 20 per cent and humans 20 per cent. The allocation of weightings to the diagram creates a sense of urgency for dealing with specific problems. Tasks will then be allocated and staff made responsible for rectifying the problem. The group will then agree to meet at another time to track process in improvements.
Figure 10.6 An Ishikawa (fishbone) diagram.
 Pareto diagrams (histograms)
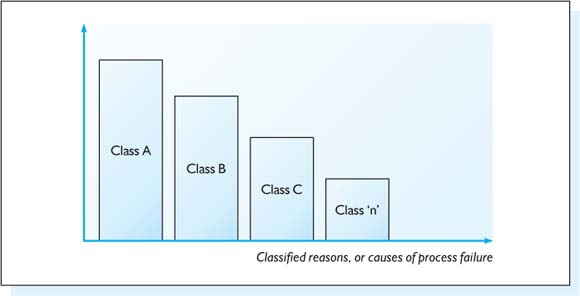
In Chapter 7, we saw how a Pareto analysis can be used to determine the importance of specific inventory items. The Pareto analysis (the 20 : 80 rule) has many applications, and an important one is in analysing and classifying problems. Class ‘A’ items will be those where 80 per cent of the numbers of occurring defects will be centred round the same 20 per cent grouping of causes.
This analysis is important because unless all items are identified and dealt with, particularly the Class A causes, competitive factors such as cost and delivery may be threatened. Pareto analysis is best undertaken in quality circles – groups can identify major causes themselves, and then take responsibility for changing processes in order to make improvements. A simple Pareto analysis is shown in Figure 10.7.
Figure 10.7 The Pareto process applied to types of problems.
Class A are the 20 per cent of recurring causes resulting in the greatest overall number of problems. These are critical, and must be rectified.
 The five-why process
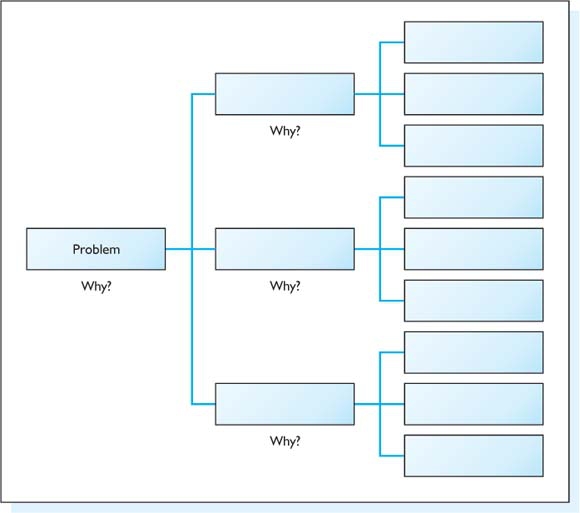
Most improvement opportunities require getting beyond apparent problems and superficial problem symptoms to identify real problems and their causes. The ‘why-why’ process, developed at Toyota, can be used by work teams and quality improvement teams to identify the root cause of problems. It is called the ‘five-why’ process at Toyota, because it usually takes five rounds of questioning why to get to the real problem. A diagram of the process is provided in Figure 10.8.
Figure 10.8 The five-why approach to process analysis.
The following is a transcript of an interview undertaken by one of the authors in 1996. It has not been published, but is provided here to offer insight into the use of the five-why process from a supplier to Toyota in the UK:
It was the most incredible thing I've experienced – I would be asked, why I did something in particular way. I would then explain it and the Toyota engineer would ask: ‘why?’ Everything we said was met with one of the engineers asking, ‘why’. It drove me crazy to begin with – a series of ‘why, why, why’ all the time. But when we realized that they were here for our benefit as well as theirs we were willing to change the way we did things. In less than 6 months we had reduced costs by 20 per cent without hurting our business. They [Toyota] benefit but so do we. Now we always ask the question ‘why?’ before we do anything new in this plant. We also ask it of everything we do anyway, new or not. What a difference . . .
Although all of these techniques are useful and can have a powerful impact on performance, there are occasions when an organization has to reorganize itself fundamentally. The following section discusses the more radical approaches to improvement that have emerged recently.
 RADICAL PERFORMANCE IMPROVEMENT
Sometimes continuous improvement is not enough for the organization to reach its goals, and more drastic performance improvements are needed. Two practices often associated with the step-changes in operations improvement are:
![]() Business process re-engineering (BPR)
Business process re-engineering (BPR)
![]() Benchmarking.
Benchmarking.
 Business process re-engineering
Business process re-engineering (BPR) is an approach used in fundamental, radical, dramatic process change, over short time horizons. BPR involves rethinking all aspects of a business process, including its purpose, tasks, structure, technology and outputs, then redesigning them from scratch to deliver value-added process outputs more efficiently and effectively. As explained by Hammer and Champy in 1990 (Hammer, 1990; Hammer and Champy, 1993), the four general themes of BPR are process orientation, the creative use of information technology (IT), ambition, and rule-breaking.
Process orientation refers to BPR's strong focus on the process, including jobs, tasks, precedence constraints, resources and flow management protocols. The focus on the use of IT includes the use of automation to facilitate processes (see, for example Davenport and Short, 1990; Davenport, 1993).
The five phases of process re-engineering are:
1 Planning
2 Internal learning
3 External learning
4 Redesign
5 Implementation.
BPR provides answers regarding where to go and how to get there.
 Process mapping
BPR makes use of a core operations tool, process mapping. Process maps are pictures of the way that work, information, customers and materials flow through an organization. BPR is a technique for mapping, analysing and improving processes, because processes link the customer's or client's requirements and the delivery of products or services (Jones, 1994, p. 25).
Key business processes include delivery (customer-facing processes) and support (those required to sustain the delivery functions) (Jones, 1994). Delivery processes include product/service development, customer order processes, and product (service) maintenance processes. Support processes include human resource acquisition processes, material acquisition processes, cash acquisition processes, business management processes, and business acquisition processes.
The stages in process mapping are as follows:
1 Define the boundaries of the activity and clarify customer and currency
2 Clarify the desired outcome of the activity
3 Map the process elements undertaken now
4 Confirm functional responsibility for each element
5 Identify failure points – a key failure may be that the current practice fails to achieve the desired outcome
6 Decide if failure points can simply be corrected, or require search for best practice or more detailed mapping.
Processes can be measured and controlled:
![]() At each internal supplier/customer (user) interface
At each internal supplier/customer (user) interface
![]() At each interface with the external customer
At each interface with the external customer
![]() By the process owner.
By the process owner.
Processes can be either internally or externally focused. They have measurable inputs, measurable outputs, added value and repeatable activity. Because process maps represent both sequences of events and the relationships between them, they are an effective way to understand operations processes and to begin to improve them.
BPR is often confused with, and is sometimes used as a euphemism for, downsizing. It is true that BPR often identifies inefficiencies in processes that, once identified, reduce the number of people required to carry out a particular process, especially when IT systems are used to automate specific elements or entire processes. However, the decision as to whether to retain or downsize the workforce is independent of the BPR process.
 Benchmarking
Benchmarking is a technique for operations improvement through setting goals based on best performance, whether in industry, in class or in the world. Benchmarking is the practice of comparing one's own organization's practices and performance against other organizations in order to identify and implement better ways of doing things. Along with BPR, benchmarking is one of the most used tools in operations improvement.
Table 10.2 The evolution of benchmarking in the USA (based on Watson, 1992)
Dates |
Major method |
Description |
1950–1975 |
Reverse engineering |
Taking apart a product to find technical improvements that can be copied |
1976–1986 |
Competitive benchmarking |
Analysing competitors to find out best practices |
1982–1988 |
Process benchmarking |
Searching out best practice examples from unrelated industries as well as competitors |
1988+ |
Strategic benchmarking |
Focuses on change at the business level as well as the process level |
1993+ |
Global benchmarking |
Benchmarking that crosses national boundaries |
Over time, benchmarking has evolved from identifying performance measures and setting targets to learning about best practices and linking them to an organization's strategy through the five phases seen in Table 10.2.
Robert Camp (1989) of Xerox, one of the best-known champions of benchmarking, defined the practice as ‘the search for industry best practices that lead to superior performance’. Other definitions include:
![]() The overall process by which a company compares its performance with that of other companies, then learns how the strongest performing companies achieve their results
The overall process by which a company compares its performance with that of other companies, then learns how the strongest performing companies achieve their results
![]() Looking at what you do, identifying areas for improvement, examining ideas or best practices and implementing changes
Looking at what you do, identifying areas for improvement, examining ideas or best practices and implementing changes
![]() A formally structured process of measuring products, services or practices against the recognized leaders in these areas
A formally structured process of measuring products, services or practices against the recognized leaders in these areas
![]() A process-driven activity that requires an organization to have a fundamental understanding of its ‘as is’ process and the superior performing benchmark process, both outputs and processes, in order to incorporate transferable practices into the organization's inferior performing practice and achieve a dramatic improvement in process performance
A process-driven activity that requires an organization to have a fundamental understanding of its ‘as is’ process and the superior performing benchmark process, both outputs and processes, in order to incorporate transferable practices into the organization's inferior performing practice and achieve a dramatic improvement in process performance
![]() Learning from and with others to achieve a level of performance better than the rest.
Learning from and with others to achieve a level of performance better than the rest.
Although benchmarking was originally used in surveying to refer to a fixed reference point, the American company Xerox is generally given credit for introducing and popularizing benchmarking as a management tool for a ‘continuous process of measuring our products, services and practices against our toughest competition or those companies recognized as world leaders’. Xerox used benchmarking as one of its major weapons in fighting off a serious challenge in photocopying from Canon in 1979 (Zairi and Hutton, 1995, p. 35).
In the UK, benchmarking was first used by affiliates of American firms such as Rank Xerox, Digital Equipment and Milliken, whilst British Steel, British Telecom, ICI, Shell and Rover followed. The DTI published Best Practice Benchmarking in 1989 (DTI, 1989), and the British Quality Associate organized a benchmarking seminar in 1991. By 1993, a survey by Coopers & Lybrand for the Confederation of British Industry found that 67 per cent of respondents claimed to be undertaking some form of benchmarking.
Many benefits have been claimed for benchmarking. The Cardiff Business School and Andersen Consulting (Andersen Consulting, 1993) described benchmarking as ‘the most powerful tool for assessing industrial competitiveness and for triggering the change process in companies striving for world class performance’. Similarly, Voss et al. (1997) found that benchmarking and a learning orientation were powerful tools in performance improvement. However, it is an indication of the volatile competitive environment that even when firms do employ benchmarking this is no guarantee of success. At the beginning of the new millennium, Xerox's financial performance was poor and Rover's very future remained in doubt.
 Types of benchmarking
The two major distinctions between types of benchmarking are between internal benchmarking, in which units within a firm are compared with other units in the same firm, and external benchmarking, in which the organization compares itself with other organizations. Companies usually begin with internal benchmarking before external benchmarking, which includes comparisons against organizations in the same industry (competitive benchmarking), non-competing firms in another industry (generic benchmarking), and the best firms in the world (world-class benchmarking). For example, the Bradford Health Trust in the UK deliberately looked outside and benchmarked against an airline company. In terms of their core business, the two have little in common. However, the Health Trust was able to learn a great deal about how the airline was managing the movement of people, which is a key feature of some of the processes within health care.
 Objectives of benchmarking
The objectives of benchmarking are to:
![]() Assess current performance relative to other companies
Assess current performance relative to other companies
![]() Discover and understand new ideas and methods to improve business processes and practices
Discover and understand new ideas and methods to improve business processes and practices
![]() Identify aggressive, yet achievable, future performance targets.
Identify aggressive, yet achievable, future performance targets.
Bullivant (1994, p. 4) lays out four conditions for using benchmarking:
1 It must be key to business survival or development
2 There must be a high value area of concern
3 It must present a high opportunity for improvement
4 It must be unable to be solved by other means.
 Stages of the benchmarking process
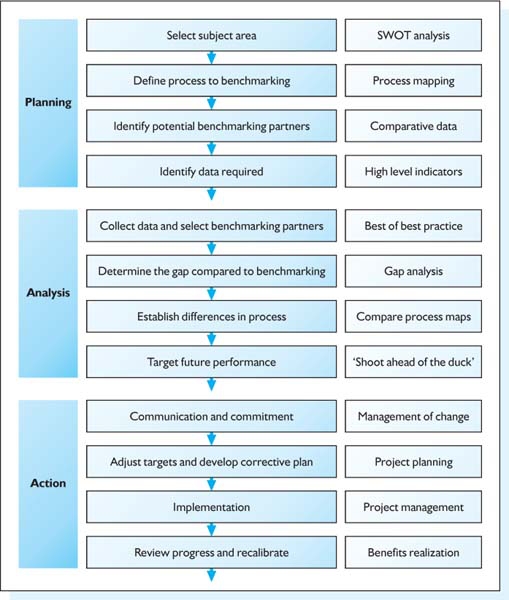
As well as many definitions of benchmarking, there are many different models of the benchmarking process. Many authors see benchmarking as following the PDCA cycle (e.g. Pulat, 1994; Zairi and Hutton, 1995), which was described above. One of the most widely used models was developed by Camp (1989), and is presented in Figure 10.9.
Figure 10.9 The twelve steps to successful benchmarking (Camp, 1989).
Key issues vary between phases, including who should participate. Finding out what to benchmark. Sources of information about what areas should be addressed include suppliers, customers, employees, and competitors or others in a similar field (Webster and Lu, 1995). SWOT analysis, internal or external reviews or audits and/or customer feedback are useful tools for selecting the subject area. Setting out a simple process map may help identify the area concerned.
Selecting one area for benchmarking. The team may best be composed of process owners and results. Typical criteria include benefits, feasibility and expense (Webster and Lu, 1995).
Exploring key features of the area. Good tools include brainstorming, Ishikawa diagrams and systematic diagrams (Webster and Lu, 1995) in order to generate a range of possible solutions. The problem-solving team will normally be multidisciplinary, and may include both internal and external members.
Analysing solutions. Experts should be used to evaluate the ideas, based on their expert knowledge and experience.
Specify a solution. Figuring out the way forward may consist of ignoring the findings, following them exactly, or interpreting them.
Once the area has been selected, the next step is to define the process to benchmark.
Gathering information about other company's practices can be done through telephone discussions and on-site visits with selected partners. Other sources of benchmarking information include benchmarking clubs, common interest groups and published data. Some questions that often come up during benchmarking are:
![]() Which companies should we talk with and/or visit?
Which companies should we talk with and/or visit?
![]() Who else should be involved in benchmarking?
Who else should be involved in benchmarking?
![]() Who else has important information about (or access to) a company not available elsewhere?
Who else has important information about (or access to) a company not available elsewhere?
![]() What issues that relate to acceptance of benchmarking can be addressed?
What issues that relate to acceptance of benchmarking can be addressed?
![]() Whose ideas should be voiced?
Whose ideas should be voiced?
Benchmarking succeeds when it results in the implementation of real, meaningful change that shows up in the company's financial performance (Goldwasser, 1995). Bullivant (1994, p. 3) describes the keys to successful benchmarking as:
1 Senior management commitment
2 Process mapping
4 Identification of high performance partners
5 Goodwill from benchmarking partners
6 Effective project management.
There is nothing new or unique in the components of benchmarking; rather, it is a framework for focusing attention on issues significant to business survival and development (Bullivant, 1994, p. 2; Mann et al., 1998). It shares many elements with competitive analysis, competitive information gathering, total quality management (TQM) and business process re-engineering (BPR). Perhaps the best way to understand how these all link is to see benchmarking as a process for identifying problems and potential solutions, whilst the others are the tools for actually accomplishing the implementation of solutions. If the problems and solutions are relatively well known, problem-solving teams and quality teams may be more applicable.
Goal setting is one of the key components of benchmarking (Camp, 1989; Watson, 1992), and may account for a significant portion of its effects as compared to other factors such as information about best practices, etc. (Mann et al., 1998).
 SUMMARY
In the modern era where many markets are highly competitive, organizations have to improve all aspects of their business on a continuous basis. The temptation for firms if they achieve recognition – in the forms of awards or prizes, for quality, or services to industry – is to relax. This is understandable but is not acceptable. However, it's not just organizations within the private sector that have to improve their performance. Organizations in the public sector have to make better use of resources than before simply because there are less resources available. This means that techniques and tools employed in large privately owned firms can be transferred and utilized within organizations in all types of sectors.
Improvements can come from a regular ongoing pursuit, via kaizen. On occasions, though, an organization may have to embark upon more fundamental improvements, and these can include business process re-engineering (PBR) and benchmarking. All of these techniques are aimed at dealing with the core issue of this chapter – performance measurement and improvement.
The European aerospace manufacturer
In the late 1990s, a large aerospace manufacturer undertook a strategic review of its business and, in particular, the way it measured its performance both internally and externally (suppliers). This process was part of a much wider initiative aimed at improving the overall levels of profitability of the firm. All the signs were that the company was doing very well. The aerospace market, which had been in a downturn, was now booming. Commercial and military orders were up, and the entire market was in a buoyant mood. It was clear from the firm's position that they were doing very well; Sales targets were well in excess of what they had anticipated a few years ago. As a singe measure of performance, this put the company in a very good light. Indeed, managers and employees throughout the business often remarked on the high levels of orders – phrases such as ‘this will put us in good stead for the next 10 years’, were often heard. However, on further analysis it was clear that if a profitability measure was used, the firm was hardly making any profit on its sales and in some cases was actually making a loss. The logic often used was that they could reverse the problem with profits by selling spares to the customer. However, the spares business, due to new trade laws, was now in danger of becoming deregulated and losing its once lucrative monopoly status.
In addition to the confusion with the overall measurement system, several other key issues arose from the review process. First, the firm used only one method for assessing its suppliers, so no matter what was bought the focus was essentially on price. Whilst this is appropriate for high-volume/low-value items, it was inappropriate for the complex procurement tasks where innovation was required. Secondly, the firm measured each business function individually. For example, Purchasing would be measured on how cheaply it bought things, and Engineering on the quality of its designs. The problem with this method was that these measurements were often directly opposed to each other. For example, Engineering would be encouraged to over-design to exceed its measures, but Purchasing could now not purchase a standard part due to all the (often unnecessary) design additions (as seen in Chapter 3, this concept is often known as over design).
In order to make the firm competitive, it was decided that a new way of working was required. The firm adopted the balanced score card approach to focus the strategic development across a range of issues. This led to changes throughout the organization. The internal structure was changed to cross-functional teams, thus placing an emphasis away from function to that of process. In order to achieve this change it was necessary to refocus the measurements from a function- to a team-orientated approach. This meant that each project team would work together to find the best solution possible and not focus on maximizing their individual functional goals and objectives. The vendor assessment scheme was also changed to reflect the variety of goods and services bought. For the straightforward items – low-value, low complexity ‘standard’ components – efficiency-based measures were used. For the more complex ‘critical’ components, effectiveness measures, including innovation development, and cost transparency were used.
The combination of the overall strategic focus and the alignment of the measures throughout the organization has allowed this firm to achieve its goals of maintaining a competitive market position whilst focusing on improving its internal efficiencies.
Key questions
1 In the modern era, why is it important for all firms to measure and improve upon their performance?
2 What type of performance measures and improvements might you see within operations management in the following settings?
a. Higher education
b. Provision of health care
c. Provision of social services
d. A high street bank
e. A fast-food outlet
f. A large manufacturing firm.
3 What are the key differences between continuous improvement and business process engineering?
4 What are the major differences between effectiveness and efficiency? How can the balanced score card align these measurement issues?
Activity-based costing
Balanced scorecard
Benchmarking
Business process re-engineering
Direct labour
Economy
Effectiveness
Efficiency
Fishbone diagram
Histogram
Indirect labour
Kaizen (continuous improvement)
PDCA cycle
Performance measurement
Standards and variances
References
Andersen Consulting. (1993). The Lean Enterprise Benchmarking Project: Report, London: Andersen Consulting.
Bititci, U. S., Turner, T. and Begemann, C. (2000). Dynamics of performance measurement systems. Int. J. Operations Product. Man., 20(6), 692–704.
Blackmon, K. and Boynton, A. C. (1994). Valmet: Dynamic Stability in Action. IMD Management 2000 Business Briefing No. 2 (Spring).
Brown, S. (1996). Strategic Manufacturing for Competitive Advantage. Prentice Hall.
Bullivant, J. R. N. (1994). Benchmarking for Continuous Improvement in the Public Sector. Longman.
Camp, R. C. (1989). Benchmarking: The Search for Best Practices that Lead to Superior Performance. ASQC Quality Press.
Davenport, T. H. (1993). Process Innovation: Re-engineering Work through Information Technology. Harvard Business School Press.
Davenport, T. H. and Short, J. E. (1990). The new industrial engineering: information technology and business process redesign. Sloan Man. Rev., Summer, 31(4): 11–27.
Department of Trade and Industry (1989). Best Practice Benchmarking. DTI.
Goldwasser, C. (1995). Benchmarking: people make the process. Man. Rev., June, 39–43.
Hammer, M. (1990). Re-engineering work: don't automate, obliterate. Harvard Bus. Rev., Jul–Aug, 104–12.
Hammer, M. and Champy, J. (1993). Re-engineering the Corporation: A Manifesto for Business Revolution. Harper Business.
Huge (1992). Personnel Management Plus, Sep., 62–3.
Imai, M. (1986). Kaizen: The Key to Japan's Competitive Success. McGraw-Hill.
Jones, C. R. (1994). Improving your key business processes. TQM Magazine, 6(2), 25–9.
Kaplan, R. S. and Norton, D. P. (1993). Putting the balanced score card to work. Harvard Bus. Rev., Sep–Oct.
Kaplan, R. S. and Norton, D. P. (1996). The Balanced Scorecard. Harvard Business School Press.
Mann, L., Samson, D. and Dow, D. (1998). A field experiment on the effects of benchmarking and goal setting on company sales performance. J. Man., 24(1): 73–96.
Pulat, B. M. (1994). Process improvements through benchmarking. TQM Magazine, 6(2), 37–40.
Voss, C. A., Ahlstrom, P. and Blackmon, K. (1997). Benchmarking and operational performance: some empirical results. Int. J. Operations Man., 17(9/10), 1046–58.
Watson, G. H. (1992). The Benchmarking Workbook. Productivity Press.
Webster, C. and Lu, Y.-C. (1995). Using IDEAS to get started on benchmarking. Managing Service Qual., 5(4), 49–56.
Zairi, M. and Hutton, R. (1995). Benchmarking: a process-driven tool for quality improvement. TQM Magazine, 7(3), 35–40.
Further reading
Atkinson, A. A., Waterhouse, J. H. and Wells, R. B. (1997). A stakeholder approach to strategic performance measurement. Sloan Man. Rev., Spring, 25–37.
Reichheld, F. F. (1996). The Loyalty Effect. Harvard Business School Press.

