CHAPTER 12
Calendar Spreads
Calendar spreads, sometimes called time spreads or horizontal spreads, are the most versatile option strategy available in that they can be bullish, bearish, or neutral, but option traders tend to use them less than they should. Calendar spreads can be neutral, meaning they maximize profit if the underlying goes nowhere; they can be mildly bullish, making money if the underlying appreciates slightly; they can be very bullish, losing money if the underlying sits but generating significant profits if the underlying rallies; they can also be bearish in the same way they can be bullish, mildly so or aggressively.
Calendar spreads are underused, particularly by newer option traders, because the risk/return or payoff chart is a little more difficult to understand and additional action is generally required when the first option expires. However, there are few option structures that take advantage of option math and the phenomena we’ve discussed as well and as clearly as calendar spreads.
In executing a calendar spread, you buy a longer-dated option and sell an otherwise identical option that expires sooner. Since you are long the longer-dated, more expensive option and short the shorter-dated, less expensive option, you are long the calendar spread. Selling the longer-dated and buying the shorter dated would be a short calendar spread.
Buying a calendar spread requires payment of net premium, since the longer-dated option is always going to be more expensive than the shorter-dated option. Selling a calendar spread generates net premium for the same reason.
The XYZ 100 strike put calendar spread, as shown in Table 12.1, would consist of being long the XYZ August 100 strike put option, which had 60 days to expiration, at a cost of $4.85 and short the XYZ July 100 strike put option, which had 30 days to expiration, generating $3.43. The net cost of buying the calendar spread would be $1.42 ($4.85 – $3.43). The net daily erosion received, assuming XYZ didn’t move, on the first day would be expected to be $0.017 ($0.057 – $0.040).
Table 12.1 XYZ Calendar Spread as of June Expiration
| Price | Daily Erosion | |
| XYZ Stock | 100.00 | |
| XYZ July 100 Strike Put | 3.43 | 0.057 |
| XYZ August 100 Strike Put | 4.85 | 0.040 |
Buying a calendar spread is a fantastic way to get the difference in option erosion by time to expiration working in our favor. The short-dated option will nearly always have greater daily erosion than the otherwise identical longer-dated option. The one exception is if the strike price is too far from at-the-money and much of the time value has already come out of the short-dated option. We saw how this happens in Part One.
Since buying calendar spreads gets this math of erosion working in the trader’s favor we’ll only discuss buying calendar spreads. There are very few reasons to sell calendar spreads. Why would you want to get the option math working against you?
In the scope of the equity options discussed in this book it’s nearly impossible to buy a calendar spread for a credit, but for options on futures it’s occasionally possible because different option expirations have different underlying assets. In the futures world the March option might have the March futures contract as its underlying, while the September option might have the September futures contract as its underlying. In this situation the difference in price between the futures contracts might generate a net premium to the buyer of the option calendar spread, but that’s illusory. It’s driven by the difference in price between the two futures contracts, a difference that can be substantial, particularly in agriculture commodities where the two futures contracts might represent different harvests.
MAXIMUM PROFIT AND LOSS
The maximum potential loss for a long calendar spread is the net premium paid for the spread, assuming the remaining option is closed when the front option expires. In the XYZ example that maximum potential loss would be the $1.42 paid for the calendar spread. Again, this assumes that the August put was closed (sold) at the time the July put expired. This maximum loss would be realized if there was no time value remaining in the August put at the expiration of the July put. This could occur in two ways, either XYZ has rallied significantly so that the August 100 put is worthless at the July expiration, or XYZ has fallen sharply so that the August put has no time value and the entirety of its price was inherent value. In the first case both of the options would be worthless at July expiration. In the second case, both of the options would be worth the inherent value at July expiration. If XYZ was at 50 at July expiration, both the July and August 100 puts would be worth $50.00. The calendar spread would be worth zero.
The maximum potential profit at the expiration of the short option depends on the price of the long option at that time. This price is affected by the underlying price as well as the implied volatility of the back option. Thus, it’s not possible to precisely know the maximum potential profit at the time of the front-month expiration, even if the underlying has not moved.
The generally expected profit for an at-the-money calendar spread, assuming the underlying has not moved, is the amount by which the longer-dated option is discounted from the shorter-dated option when the trade is initiated. This discount is really equal to the sum of the differences in daily erosion between the two options for each day of the term of the option sold.
In the previous XYZ example, if XYZ did not move for the term of the July option and implied volatility was unchanged, then the August put would cost $3.43 at the July expiration since it is now a 30-day option, just as the July put was when it was initiated. The profit for the calendar spread, assuming the August put was closed by selling, would be $2.01. Our trader would have pocketed the entire $3.43 received for selling the July put and the loss on the August put would be $1.42 (the $4.85 initially paid minus the $3.43 current value). It’s no accident that this $2.01 profit is equal to the discount seen in the August put at initiation. The 30-day July put cost $3.43. If daily erosion were linear the August put, with exactly twice the time to expiration, would cost exactly twice as much, or $6.86. Instead it cost $4.85. This difference of $2.01 ($6.86 – $4.85), as shown in Table 12.2, is the expected profit for an at-the-money calendar spread if nothing (price of the underlying, implied volatility, interest rates, etc.) changes over the life of the front option.
Table 12.2 XYZ Calendar Spread as of July Expiration
This discount is the expected profit for any at-the-money calendar spread assuming nothing changes. The profit ultimately is the front-month premium received and kept, minus the reduction in value of the back month option. Table 12.3 shows this discount and the resulting profit and profit components, for a variety of option prices.
Table 12.3 The Long Option Discount and “Expected” Profit
How likely is it that nothing will have changed during the term of the front option? Not very. These aren’t really the expected profits because we’d expect something to change during the term of the first option. Either the underlying would move or the implied volatility would change; implied volatility would likely drop if the underlying price didn’t change. Though these numbers are not really the expected profit, they highlight the theory of calendar spreads. These examples also work because the back month has exactly twice the time to expiration as the front month. When the timing isn’t this neatly arranged it’s easier to use OptionMath.com to calculate the expected price of the back month at the front month’s expiration, then the math is simple. The expected profit on the calendar spread (if the underlying doesn’t move and nothing else changes) is the price of the front month minus the loss in value of the back month.
If the price of the underlying has not moved but implied volatility has increased, then the profit will have increased. Because a higher implied volatility means the remaining option, the option our trader is long, is worth more. If implied volatility has decreased, then the profit will have decreased because a lower implied volatility means the remaining option, the option our trader is long, is worth less.
Unlike the other strategies that we’ve discussed, covered call and short put, it’s not possible to know the ultimate profit for a calendar spread by simply knowing where the underlying is at either expiration. It’s possible to know the profit or loss at the first expiration given certain assumptions (underlying price and implied volatility, for example). It’s possible to know the profit or loss at the second expiration given other assumptions such as underlying price, for example, and the answer to some other questions (was the front option in-the-money at expiration, and what action did the trader take at the first expiration, for example). As such, the traditional payoff charts we used in Chapters 10 and 11 won’t work for a calendar spread.
THE PHENOMENA
Time decay is one phenomenon that overwhelmingly places the option math of long calendar spreads on the side of the option trader. The difference in expected daily erosion should theoretically show up in the trader’s account at the end of every day. While this effect is often camouflaged by the impact of changes in the underlying price and implied volatility (which impacts the two legs of a calendar spread differently), this difference in erosion and the apparent discount generated in the longer-dated option, is the expected profit.
As we saw in Part Two, the expected daily erosion increases as the time to expiration decreases, and since this expected daily erosion increases exponentially the net expected erosion, the erosion received from the short option minus the erosion paid for the long option, also increases as the time to expiration decreases. In Table 12.4, the net daily erosion for the very shortest calendar, the 10-day/20-day calendar, is $0.029 or nearly double that of the 30-day/60-day spread and nearly triple that of the 90-day/180-day spread, even though in all instances the back-month option has precisely twice the time to expiration as the front-month option. While the theoretical discount for the 120-day/360-day calendar is $8.71, this isn’t the expected profit since the 360-day option has 3 times the amount of time to expiration. In this case the expected profit is $4.63. After 120 days the front option has expired, resulting in a profit of $6.85, and the back-month option how has 240 days to expiration. Given that its value would be $9.67, meaning the loss on this option would be $2.17 ($11.84 – $9.67) the net profit would be $4.68 ($6.85 – $2.17).
Table 12.4 The Impact of Time to Expiration on Calendar Spreads

Skew has very little impact on calendar spreads. It usually has some minor impact on out-of-the-money put calendar spreads, however, since skew tends to be more pronounced in shorter-dated options as each strike of a shorter-dated option serves less well as a hedge for the other strikes of the same shorter-dated expiration.
The volatility risk premium is generally about equal in volatility terms for both expiration months of a calendar spread. It’s not likely to have much impact on the ultimate profitability of a calendar spread.
Any calendar spread should be executed as a spread, that is as a single trade, rather than as two separate trades, for the reasons we discussed in Part Two. In some underlying stocks the bid/ask spread might be wide, particularly in the longer-dated expiration. In these situations the impact of the bid/ask spread can materially impact the price realized for the calendar spread.
There’s one sensitivity the calendar spread buyer should be particularly aware of. Changes in implied volatility impact longer-dated options to a much greater degree than shorter-dated options. Thus, a long calendar spread wants implied volatility to increase during the term of the first option, as shown in Table 12.5.
Table 12.5 XYZ Calendar Spread and Changes in Implied Volatility
LONG CALENDAR SPREADS AND IMPLIED VOLATILITY
Long calendar spreads benefit from a higher implied volatility when it is initiated and is hurt by lower implied volatility. While a higher implied volatility makes the calendar spread more expensive it increases the discount for the longer-dated option. Just before expiration of the front option the impact of changes in implied volatility on that option is minuscule so it is at this point that changes in implied volatility have the greatest impact on the profitability of a calendar spread. Table 12.6 uses the same XYZ Corp options with different levels of implied volatility.
Table 12.6 The Impact of Implied Volatility on Calendar Spread Prices
The difference in sensitivity to changes in implied volatility also means that a calendar spread is helped by an increase in implied volatility after the trade is initiated and is hurt by a drop in implied volatility after the trade is initiated.
For example, our initial XYZ Corporation example assumed that implied volatility was 30 percent for both options and stayed at 30 percent for the term of the July put. If that was the case, and XYZ was still at 100.00 at the July expiration, the calendar would have generated a profit of $2.01. But if implied volatility had changed at the time the July put expired the value of the August put would have been affected.
The impact of a change in implied volatility is initially not linear as we see in Table 12.7. An increase in implied volatility helps the calendar spread just about as much as a decrease hurts. In this XYZ example implied volatility decreased from 30 percent to 10 percent, resulting in a loss of $0.28, $2.29 less than the $2.01 profit we’d expected if implied volatility hadn’t changed, and an increase from 30 percent to 50 percent generated a profit of $4.29, an increase of $2.28 over the $2.01 profit we’d expected.
Table 12.7 The Impact of Changes in Implied Volatility
Since an increase in implied volatility helps a long calendar spread after it’s been initiated, we’d say a long calendar spread is a long implied volatility trade.
CALENDAR SPREAD PAYOFF AT FRONT-MONTH EXPIRATION
Assuming nothing changes from the time the at-the-money calendar spread is initiated to the time the front-month option expires, the payoff chart for a long calendar spread like the XYZ example would look like Figure 12.1.
FIGURE 12.1 Put Calendar Spread Assumed Profit/Loss at First Expiration
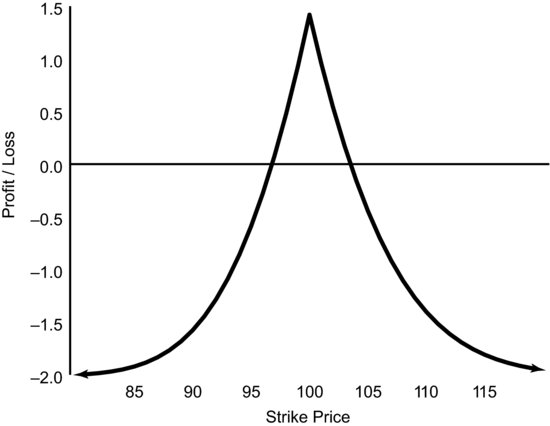
The payoff chart makes many assumptions so it should only be used as a rule of thumb, but it can highlight several interesting aspects of the calendar spread. First, although it’s difficult to tell, the payoff is not symmetrical. It’s got a slight bias, too slight to be of value, but the bias comes from the time value remaining in the back month option at expiration.
NEUTRAL, BULLISH, AND BEARISH CALENDAR SPREADS
Calendar spreads are the most versatile option structures available since they can be neutral, somewhat bullish, very bullish, somewhat bearish, or very bearish. All long calendar spreads want the underlying to be at the strike price at the expiration of the front-month option, but since traders can select any strike price they can always buy a calendar spread that conforms to their outlook for the stock. For instance, traders can select a strike price that is currently at-the-money, resulting in a calendar spread that does best with no movement; an out-of-the-money call calendar spread that does best with an increase in the underlying price; or an out-of-the-money put calendar spread that does best with a decrease in the underlying price. It is possible to select a calendar spread that is too aggressive, in either direction, and end up selling a short-dated option that has very little time value left. In this situation the option math is no longer working in our favor, since the net daily erosion might be negative. We’ll discuss this more fully when discussing bullish and bearish calendar spreads.
Neutral Calendar Spreads
Neutral calendar spreads begin with selecting a strike price that is close to the current price of the underlying stock. Neutral calendar spreads need the underlying stock to stay within a fairly narrow range around this strike price at expiration. As we saw in Figure 12.1, the profit decreases as the underlying gets further away from the strike price at expiration and eventually reaches its maximum loss of the amount paid for the calendar spread if the stock price is sufficiently far from the strike price at the front-month expiration.
As implied volatility increases the width of the profitable zone increases as well. (Again, we’re assuming that the implied volatility of both legs is equal at initiation. This is unlikely to be exactly so, but the difference should be small so we’ll continue to make this assumption since it simplifies the math and highlights the theoretical issues at play.) This comes at the cost of greater total risk since the increased implied volatility increases the total cost of the calendar spread. Figure 12.2 shows the payoff for an at-the-money call calendar spread for varying implied volatilities. These payoff charts assume that implied volatility was equal and unchanging for the options and that the underlying did not move for the term of the first option.
FIGURE 12.2 Neutral Calendar Spread Payoffs for Varying Implied Volatilities
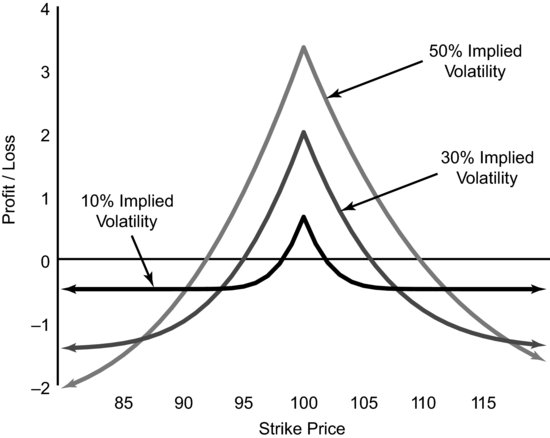
These payoff charts are curved because the August expiration still has time value remaining, as we saw in the time value to expiration charts in Part One.
The XYZ example we discussed previously was a neutral calendar spread. It used the 100 strike puts in July and August expirations with the underlying price at $100.00. This is the 30 percent implied volatility example in Figure 12.2.
The assumption that we would liquidate the remaining option once the front option in a neutral calendar spread has expired is logical. We put on a neutral calendar spread because we didn’t think the underlying was going to move during the term of the first option. (See Table 12.8.) There’s no reason to believe that the underlying is now going to magically start moving in the direction we desire simply because the front option has expired. We used a calendar spread because it put the option math on our side. Staying long the August put, which is now a 30-day option, makes option math, particularly the volatility risk premium and time decay, our mortal enemy. This means that while all calendar spreads have limited risk, specifically the amount paid for the spread (assuming the remaining option is closed once the front option expires), it also means that a neutral calendar spread essentially has a limited return as well. It’s possible that the underlying doesn’t move until the front option has expired and then moves drastically in the direction that generates the most profit for us, but it’s unlikely and isn’t the sort of price action an option-math-savvy trader will expect or even hope for.
Table 12.8 Neutral Calendar Put Spread
| Maximum Loss | 1.42 |
| Maximum Profit (assuming no changes in underlying or implied volatility) | 2.01 |
| Theoretical Downside Breakeven Point | 95.00 |
| Theoretical Upside Breakeven Point | 106.14 |
The goal of this at-the-money calendar spread is to capture the difference in daily erosion, ultimately capturing the entire discount in the price of the August put relative to the July put at initiation. In this case that’s $2.01.
Bullish Calendar Spread
The bullish calendar spread is constructed using call options with a common strike price that is above the current price of the underlying asset. Again, a long call calendar spread is accomplished by buying the longer-dated call option and selling the shorter-dated call option.
One difference between the neutral calendar spread and the bullish calendar spread is that a very aggressive bullish spread, one that uses a strike price that is substantially above at-the-money and that expects the underlying stock to appreciate substantially by the time of the front-month expiration, can actually lose money if the underlying doesn’t move by this first expiration. In this case it is unlike the neutral calendar spread, which will be profitable if the underlying stock doesn’t move.
A mildly bullish calendar spread can generate a profit if the stock does not move at all before the initial expiration, but it will realize its maximum profit if the underlying stock does rally and is precisely at the strike price at the first expiration—so in this way it is like every other calendar spread, it generates its maximum potential profit with the underlying at the strike price at the first expiration.
Assume we were considering buying a call calendar spread. The November calls have 30 days to expiration and the December calls have 60 days to expiration. What would the profit or loss be at the November expiration if the underlying stock hadn’t moved? How aggressive can we be, that is, how high a strike price could we select, and still have our calendar spread be profitable, assuming nothing else had changed, at the November expiration? Table 12.9 shows the profitability of various call calendar spreads. They differ by strike price, with more aggressive calendar spreads having the highest strike prices, but all assume the underlying stock does not move before November expiration.
Table 12.9 Calendar Spread Profitability if Underlying Doesn’t Move
For these calendar spreads the most aggressive (highest) strike price that will still return a profit if the underlying doesn’t move is the 105 strike. This is the upper bound for November/December call calendar strike prices. If we construct a call calendar spread with a strike price higher than $105, then we have to see the underlying rally prior to November expiration or we will lose money.
Figure 12.3 shows the profitability of bullish call calendar spreads if the underlying doesn’t move during the term of the first option. The horizontal axis shows the strike price of the calendar spread increasing from at- the-money.
FIGURE 12.3 Bullish Call Calendar Profit if No Movement, by Strike Price
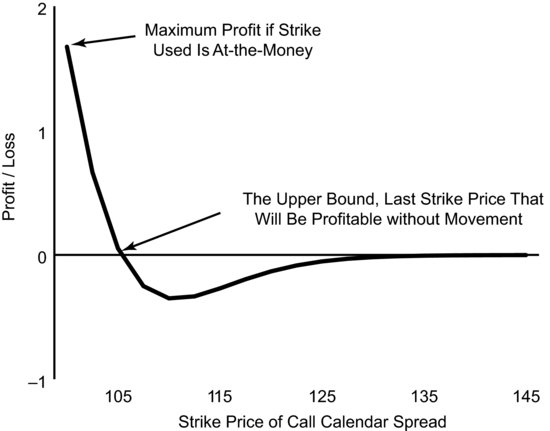
The goal of any bullish calendar spread is to have the stock rally during the term of the front month yet be just equal to the strike price at that expiration. In that situation the front month will expire worthless and the back month is now worth more; actually it’s achieved its maximum amount of time value since it’s now at-the-money, as the underlying rose in price this call option likely rose in price.
Which of the call calendar spreads we examined previously would be most profitable if we were correct and the underlying rallied to the respective strike price? Table 12.10 shows the profitability of each of these call calendar spreads at the first expiration, assuming volatility hasn’t changed (which is a big assumption), with the underlying price at the respective strike price.
Table 12.10 Calendar Spread Profitability by Moneyness
The potential profitability of a bullish call calendar spread increases as the strike price selected, and then achieved, increases. This is logical since the initial cost of the calendar decreased as the strike price selected got further from at-the-money at initiation. Also, the likelihood of the underlying stock rallying to the strike price decreased as the strike price increased. We would expect to make a greater profit if the risk was increased. However, is the potential additional profit from selecting a far out-of-the-money strike price worth the additional risk? Probably not, given that the likelihood of a 10 percent move in the one-month term of our November call option is pretty remote but this is why we say that the calendar spread gets more aggressive as the strike price gets further from at-the-money.
CALENDAR SPREAD PROFITABILITY WITHOUT MOVEMENT
The goal of any bullish (bearish) calendar spread is to have the underlying rally (fall) to the strike price at the front-month expiration. However, since the daily erosion for a far out-of-the-money option is limited, it’s possible to go too far out-of-the-money and get into a situation where the underlying has to rally (fall) or the trade will be unprofitable. Figure 12.4 shows the general shape of the payoff curve for a call calendar by strike price if the underlying doesn’t move. This general shape applies regardless of the implied volatilities of the options (we’ve assumed the implied volatility of both options was equal and unchanging during the term of the first option), but the bump at the bottom of the chart will move to the right, that is, it will cover higher strike prices, as implied volatility increases. Figure 12.4 shows this payoff chart for 10 percent implied volatility, 25 percent implied volatility, and 50 percent implied volatility.
FIGURE 12.4 Bullish Call Calendar Profit if No Movement, by Strike Price for Three Implied Volatilities
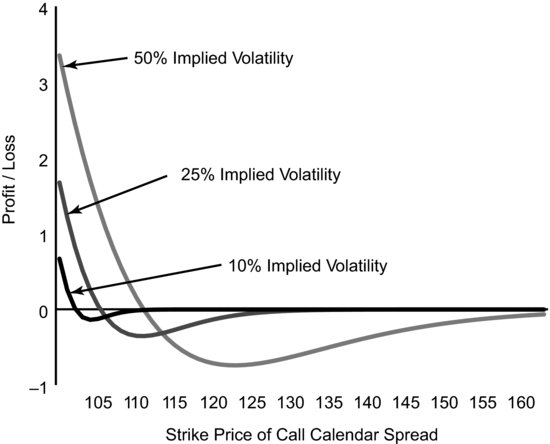
As you can see, the potential loss increases as implied volatility increases but the upper bound, the highest strike price that is profitable without any movement in the underlying, increases and is pushed further to the right on Figure 12.4, as implied volatility increases.
Bearish Calendar Spread
Bearish calendar spreads use put options with a strike price that is lower than the current market price of the underlying stock. The further out-of-the-money the strike price is at initiation, the more aggressive the spread is and the more movement it needs to reach its point of maximum profit. As we saw with a bullish call calendar, it’s possible for a bearish put calendar spread to lose money if the underlying doesn’t move prior to the initial expiration, and if the strike price selected is sufficiently out-of-the-money. The further out-of-the-money the strike is at initiation the further the underlying has to move in order for the calendar spread to break even.(See Table 12.11.)
Table 12.11 How Much Does the Underlying Need to Move?
| January/February Put Calendar Spread, Underlying at 100.00 at Initiation | |
| Strike Price of Calendar | Breakeven at First Expiration |
| 95 | Profitable without Movement |
| 92.50 | 98.92 |
| 90 | 97.31 |
| 87.50 | 95.93 |
The goal of a bearish put calendar spread, as with nearly all spreads, is to have the underlying at the strike price of the short option (in the case of a calendar spread it just happens to also be the strike price of the long option) when the short option expires. A mildly bearish put calendar will be profitable if there is no movement. A more aggressive bearish put calendar requires the underlying price to fall some prior to the initial expiration.
CALENDAR SPREAD SENSITIVITIES
Differing times to expiration often have a profound impact on options’ sensitivities to changes in underlying price, time to expiration, and implied volatility. For a calendar spread these sensitivities are often distilled to their core, since issues affecting other spreads (such as differing strike prices) aren’t a factor with a calendar spread.
A neutral calendar spread wants little market movement. Mildly bullish and bearish calendar spreads also generally want little market bumpiness, but would do best with a very slow, methodical march to the strike price, getting there just as the front option expires worthless. Very bullish and very bearish calendar spreads generally need a fair amount of volatility in the underlying stock, as that’s the only way the underlying is going to end up moving to the strike price by the front-month expiration.
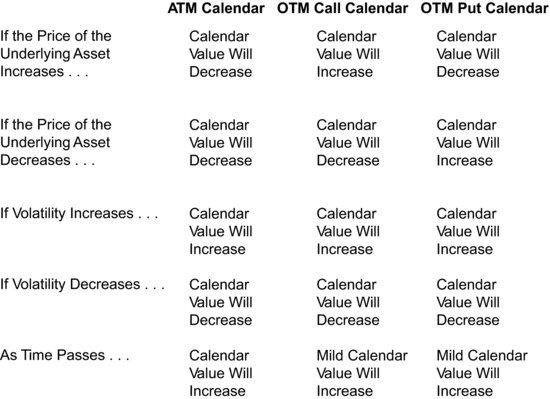
Again, the main goal of a calendar spread is to collect the difference in daily erosion while, for the bullish and bearish versions, incorporating assumptions about the direction and magnitude of the movement of the underlying stock. Figure 12.5 shows the sensitivities of a neutral calendar spread, as well as for mildly bullish and bearish calendar spreads.
FIGURE 12.5 Calendar Option Sensitivities
FOLLOW-UP
The follow-up action for a neutral calendar spread is pretty easy if the spread achieved the majority of the profit goal. The trade was put on because we thought that the underlying stock wasn’t going to move very much for the term of the front option and we wanted to collect the difference in daily erosion and the discount seen in the back-month option. Now that the front option has expired worthless, there’s no reason to think that the underlying is suddenly going to move in the direction we need it to move. It’s just as likely to move in the opposite direction, and since it’s an at-the-money option, and thus will see its price change by 50 percent of the change in price of the underlying stock, just a little movement in the wrong direction will wipe out all of the profit made.
The correct follow-up action for a neutral calendar that has realized most of the profit potential is to close out the remaining option. The trade has been profitable, now the job is to not screw it up.
As we’ve discussed, the neutral calendar spread, either using call options or put options, needs the underlying asset to stay very close to the strike price. What if it doesn’t?
If we initiated a neutral call calendar only to see the underlying stock move dramatically, we need to evaluate how much time value exists in the remaining option. If the underlying stock has fallen substantially, the front option will expire worthless and we will get to keep that premium. Unfortunately, the remaining option, the leg we’re long, will have fallen in value to a point that makes the trade a loser. If there is still a reasonable amount of time value remaining in the long option, it’s probably time to take the loss and move on. Table 12.12 shows the results of taking a small loss based on a 100 call calendar spread.
Table 12.12 Taking a Small Loss
| November/December 100 Call Calendar Spread | |
| At Initiation | |
| Stock | 100.00 |
| November 100 Call | 2.86 |
| December 100 Call | 4.04 |
| Spread Value | 1.18 |
| At November Expiration | |
| Stock | 95.00 |
| November 100 Call | 0.00 |
| December 100 Call | 0.98 |
| Spread Value | 0.98 |
In this situation the December call has $0.98 of time value remaining, so the net effect of selling there would be a loss of $0.20 ($1.18 – $0.98) on the calendar spread. The expectation was for little movement and instead the underlying stock fell by 5 percent over the 30-day term of the November option. A $0.20 loss given the magnitude of the miss is not too bad. Such a relatively small loss is due to the phenomena we’ve discussed and that were at work on this calendar spread.
But what if there’s no time value remaining? Table 12.13 shows such a scenario.
Table 12.13 Follow-Up after Getting It Wrong
| November/December 100 Call Calendar Spread | |
| At Initiation | |
| Stock | 100.00 |
| November 100 Call | 2.86 |
| December 100 Call | 4.04 |
| Spread Value | 1.18 |
| At November Expiration | |
| Stock | 75.00 |
| November 100 Call | 0.00 |
| December 100 Call | 0.05 |
| Spread Value | 0.05 |
If there’s no time value remaining, or very little time value remaining, then there’s no additional risk from holding the option. In this example the loss can’t really get any larger than the $1.13 already sustained, and while it might be comforting to simply take the loss by selling the remaining option for whatever can be had for it, $0.05 in this case, it makes sense to do nothing now. The commission cost to collect that $0.05 would surely make selling the December call even less worthwhile.
It almost never makes sense to sell teenie options---options that are very cheap in absolute terms, about $0.10 and less. It certainly never makes sense to sell these options to create a new short position. Options that are inexpensive in absolute terms are called teenies from the days when stock and option prices were quoted in eighths ($0.125) and sixteenths ($0.0625) of a dollar. A price of 1/16 of a point was called a teenie. The term is now generally used for any cheap option, particularly options costing less than $0.10 and certainly for options costing less than $0.05.
The best strategy in this situation is to just stay long that out-of-the-money call option and hope the stock rallies back. In a situation like this it’s often a very good idea to place a good-till-cancelled (GTC) order to sell the call option at a small price, but one that’s high enough to be worth selling. A GTC order isn’t automatically canceled at the end of the trading day if it’s not filled. It will automatically be reentered each day until it’s filled or the option expires.
It depends on other variables, but leaving such a good-till-canceled order to sell the call option at $0.50 is often a good way to be able to move on to the next trade and not worry about how or whether to close the position. If the sell order is executed then we are out of the position and have mitigated some of the damage. If the order isn’t executed then we’re no worse off.
Smart option traders don’t get in the habit of saying, “it’s only $0.50, why bother?” First, those traders are probably selling that option for more than it’s worth, even if they’re only selling it for $0.50. Second, $0.50 here, $0.50 there, and pretty soon they’ve collected enough to deploy in another trade. This doesn’t mean a smart trader will sell options at $0.10. That’s a very different trade and not one the smart option trader will make very often. So what’s the difference between $0.10 and $0.50? It’s more than $0.40; it’s the difference between an option that has some time value and an option that’s really just a lottery ticket for someone else.
If the stock has rallied above the strike price of the call calendar such that both of the options are trading at parity, then the follow-up action is also fairly straightforward. In this situation the short call, the November 100 call in our example shown in Table 12.14, will be exercised by the holder and we will be forced to deliver 100 shares. This can be done by borrowing the shares and delivering them such that we are short the shares. However, since we’re long the back-month call option, the December 100 call in our example, which is trading at parity, we have no additional risk to the upside. If the price of the stock increases, the value of the long call option will increase by an equal amount.
Table 12.14 Follow-Up after Being Assigned
| November/December 100 Call Calendar Spread | |
| At Initiation | |
| Stock | 100.00 |
| November 100 Call | 2.86 |
| December 100 Call | 4.04 |
| Spread Value | 1.18 |
| At November Expiration | |
| Stock | 110.00 |
| November 100 Call | 10.00 |
| December 100 Call | 10.00 |
| Spread Value | 0.00 |
| Position after November Expiration | |
| Stock | Short 100 shares |
| December 100 Call Option | Long 1 option |
This short stock, long in-the-money call option position is really like being long a put option. Why? Because this position makes money as the stock drops. In fact, this new position, which can’t lose any more than the $1.18 the calendar has already lost, would do best if the price of the stock dropped to zero at December expiration. With the stock at zero at December expiration, we can buy our stock back for zero and the December call option we’re long expires worthless. We would have made $100.00 on the stock we’re short and would have lost $10.00 on the December call, as $10.00 was its value when we shorted the stock to satisfy our obligation at the November expiration.
Immediately after the November expiration the logical follow-up activity is to do nothing. There’s no time value in the remaining December call option. There’s no additional risk from keeping the position as it exists. There’s only potential profit, and that occurs if the price of the stock drops. If it drops to a point that results in time value coming back into the call option, then we might close the entire position at a smaller loss, as we can see in Table 12.15.
Table 12.15 Further Follow-Up After Being Assigned
| Position with 15 Days to December Expiration | |
| Stock | 102.50 |
| December 100 Call | 3.54 |
| Option Time Value | 1.04 |
With 15 days to expiration we can close the position by buying back the shares we are short at $102.50 and selling the December 100 call at $3.54. That $3.54 includes $1.04 of time value, which will reduce the loss on the entire trade. With the options trading at parity that loss was the $1.18 paid for the spread. By selling the December call with $1.04 of time value, the loss has been reduced to $0.14 ($1.18 – $1.04).
What do we do if we’ve initiated a bullish or bearish calendar spread and the market has moved toward our strike? Table 12.16 shows the follow-up for a successful directional calendar spread; we discuss the ramifications of certain actions that result in an unrealized profit of $1.30.
Table 12.16 Follow-Up for a Successful Directional Calendar
| November/December 95 Put Calendar Spread | |
| At Initiation | |
| Stock | 100.00 |
| November 95 Put | 0.98 |
| December 95 Put | 1.94 |
| Spread Value | 0.96 |
| At November Expiration | |
| Stock | 96.00 |
| November 95 Put | 0.00 |
| December 95 Put | 2.26 |
| Spread Value | 2.26 |
| Unrealized Profit | 1.30 |
Now we have a choice. We can close the back-month put option position for a profit of $1.30 or we can stay long the back-month put option. This is unlike the neutral calendar spread at front-month expiration. In the neutral calendar spread we have correctly predicted that the stock would not move for the term of the front option. In that situation there’s no reason to believe the stock will magically begin to move in the optimal direction for us. The bearish put calendar is different. In this situation we have correctly predicted that the stock would fall toward the strike price. Again, there’s no reason to believe that the stock will change behavior simply because the front-month option has expired. We can stay long the December 95 put option—after all, we’ve gotten the direction correct—but that sets the option math working against us. We’re long an option for which the price is likely higher than its value, and since it now has only 30 days to expiration the daily erosion is going to pick up rapidly. In this case no one would blame us for staying long that put for a short period to see if the stock continues to move lower, but no one would blame us for closing the position and taking our profit. If we chose to stay long the December 95 put, it would make sense to enter a GTC order to sell it at a price currently above the market. We might enter a GTC limit order to sell this option at $3.00 as a way to exit the trade. We might also enter a contingent order to sell the December 95 put at the market price if the underlying stock trades at $95.00. This would be the point when time value is maximized although the total value of the put option will continue to increase if the stock continues to drop. One important note: We don’t want to have both orders in the market simultaneously such that they might both get filled.
Another alternative that maintains downside exposure while mitigating some of the phenomena is to turn the long put into a long put spread. By selling the December 90 put at $1.05 the effect of daily erosion is reduced and we have put option skew working for us. Since we only paid $0.96 for the original calendar spread and will receive $1.05 for selling the December 90 put, we have gotten ourselves into a situation where the worst we can do is make $0.09 ($1.05 – $0.96). This is probably not the best way to look at the trade, however, since we currently have an unrealized profit of $1.30. But we now have a vertical spread on. We’ll discuss vertical spreads later in Part Three.
The Super Calendar
One of the very best follow-up trades for a profitable calendar spread is to turn it into a super calendar as shown in Table 12.17. This is done after the front option has expired by selling another option with the same strike price but with an expiration date that’s shorter than the remaining long option. If the original calendar spread sold a 30-day option and bought a 90-day option, then at the front-month expiration the remaining option would have 60 days to expiration. We could turn this into a super calendar by selling a new 30-day option of the same type (put or call) and the same strike price. The result is that we reload the phenomena in our favor. As weekly options become more common, selling a weekly to create a super calendar is also possible for some underlying stocks and ETFs.
Table 12.17 The Super Calendar Spread
| November/December 95 Put Calendar Spread | |
| At Initiation | |
| Stock | 100.00 |
| November 95 Put | 0.98 |
| December 95 Put | 1.94 |
| Spread Value | 0.96 |
| At November Expiration | |
| Stock | 96.00 |
| November 95 Put | 0.00 |
| December 95 Put | 2.26 |
| Spread Value | 2.26 |
| Unrealized Profit | 1.30 |
| After Selling Weekly 95 Put to Create a Super Calendar | |
| Stock | 96.00 |
| December Weekly 95 Put | 0.88 |
| December Standard 95 Put | 2.26 |
| Spread Value | 1.38 |
| Total Profit with Stock at 96.00 at Weekly Option Expiration | 1.84 |
A super calendar is a great way to add to a winner. The initial calendar spread was a winner; we had the direction right and the phenomena worked in our favor. In this case it’s often a great idea to believe the stock is going to maintain its recent trend and to put the phenomena back on our favor.
BULLISH BECOMES BEARISH…
If the market overshoots a bullish or bearish calendar spread the nature of the spread changes. A calendar spread that was originally bullish only to see the underlying stock rally over the strike price, now needs the stock to drop back in order realize the maximum potential profit. Likewise, a put calendar spread that was originally bearish only to have the stock drop below the strike price needs the stock to rally back to the strike price in order to realize the maximum potential profit. Calendar spreads are one of the few option structures that experience this sort of change.
For example, with ABC at $150.00, as shown in Table 12.18a, a bullish call calendar needs ABC to rally to the strike price to recognize the maximum profit.
Table 12.18a A Bullish Calendar Spread Becomes Bearish
| September/October 160 Call Calendar Spread | |
| at Initiation | |
| ABC | 150.00 |
| September 160 Call | 3.18 |
| October 160 Call | 5.80 |
| Spread Cost | 2.62 |
| September 160 Call with ABC at 160 at Expiration | 0.00 |
| October 160 Call with ABC at 160 at Sept. Expiration | 7.31 |
| Expected Profit with ABC at 160 at Expiration | 4.69 |
But if ABC rallies past $160.00 then the expected profit will be reduced, and if ABC rallies enough that both options are trading at parity (i.e., at their inherent values without any time value), then the hoped-for profit has become a loss of $2.62. In these cases the spread has become bearish in that it needs ABC to fall in price.
If ABC rallies substantially, say to $190, the calendar spread, as shown in Table 12.18b, is now worth less than our trader paid for it and he now needs ABC to drop back toward the 160 strike price of the calendar spread. Our calendar spread was originally bullish in that it did best if ABC stock rallied from $150 to $160, at $160 the calendar spread achieved its maximum profit. But since ABC has overshot the $160 level this trade is no longer bullish; it is now bearish because it does best if ABC drops. Specifically, we want ABC to drop from $190 back to $160.
Table 12.18b A Bullish Calendar Spread Becomes Bearish
| September/October 160 Call Calendar Spread | |
| with 2 Weeks to September Expiration | |
| ABC | 190.00 |
| September 160 Call | 30.09 |
| October 160 Call | 31.31 |
| Spread Value | 1.22 |
CATALYSTS
The major caveat a calendar spread buyer has to be aware of is the timing of catalysts such as dividend payments and earnings reports. Given the nature of calendar spreads and the differing expiration dates, it’s possible to have a catalyst affect the longer-dated option but not the shorter-dated option. Since these events are knowable they will impact the prices at which we can initiate our calendar spread.
In the case of an earnings report, having the catalyst affect the back month, meaning the option we’re buying, and not the front month, the option we’re selling, generally makes the calendar spread more expensive to buy and reduces the amount of the discount in the back-month option. In some cases the discount disappears totally. For example, Starbucks was due to report earnings on April 26. This meant that the April options would expire before the report was public, but the July options would catch the resulting price action. At the March option expiration, as shown in Table 12.19, the April options had about 30 days to expiration and the July options had about 120 days to expiration. How much of a discount was the July 55 call trading at when compared to the April 55 call option?
Table 12.19 Starbucks 55 Call Calendar at March Expiration
In this situation the July option is trading at a small premium due to the fact that it catches the price action of the earnings release, while the April option does not. The back-month option, which catches a catalyst that the front-month option misses, will always be more expensive than expected, which will tend to make buying a calendar spread less attractive.
In the case of a dividend payment, longer-dated puts will look more expensive relative to shorter-dated puts and longer-dated calls will look less expensive relative to shorter-dated calls. This is due to the fact that the market price of the stock will drop by the amount of the dividend on the day the dividend is payable. For example, the Royal Bank of Canada was due to pay a dividend of $0.58 on April 22. This date would be after the April options had expired but before the July options expired. At the March option expiration the April options had about 30 days to expiration and the July options had about 120 days to expiration. How much of a discount was the July 55 put trading at when compared to the April 55 put option?
The premium shown in Table 12.20 is due to the dividend payment and subsequent drop in the price of the stock on April 22. If we were to factor this in, the July option would actually be trading at a discount to the April option, just as we would normally expect.
Table 12.20 Royal Bank of Canada 55 Put Calendar at March Expiration
So a dividend payment will make a put calendar spread appear less attractive than it would otherwise. What would happen to a call calendar spread in Royal Bank of Canada? (See Table 12.21.)
Table 12.21 Royal Bank of Canada 60 Call Calendar at March Expiration
While it seems that the April/July 60 call calendar is showing the sort of discount in the July option that we’d expect, it’s important to remember that Royal Bank of Canada stock will drop by the $0.58 amount of the dividend on April 22, and will drag the price of the July 60 call with it. Dividends make call calendar spreads look more attractive than they actually are.

- Long calendar spreads put the difference in daily erosion to work.
- The maximum loss from a long calendar spread is the amount paid for the spread, assuming the remaining leg is closed at the expiration of the front leg.
- The maximum profit from a long calendar spread is similarly limited, but the actual profit at expiration of the front month is not knowable given the potential change in implied volatility (and option prices) during the term of the spread.
- The goal of a calendar spread is to collect the discount in the price of the back-month option. This discount is really the cumulative difference in expected daily erosion.
- Calendar spreads can serve every market outlook—bullish, bearish (very much so or mildly so), and neutral.
- Bullish calendar spreads can become bearish and vice versa.
- Since a calendar spread has two different expiration dates, catalysts can play havoc with the outcome.