
8. Building Output Profiles: Final Destinations
Output profiles do more than just deliver your known, calibrated color to your output device. They’re also the map you use when you’re deciding where you want to drive that color. Output profiles not only help the color management system (CMS) produce the right numbers to represent your color on the output device, but they also help the CMS show you, on your display or on another printer, how the output device will render the color before you print it. Most of our captured images contain colors that our output devices can’t reproduce, so we have to decide how we want to handle these out-of-gamut colors: the output profile is the map that shows you the possible destinations. If that map doesn’t describe the territory accurately, you’re liable to get lost, and if an output profile doesn’t describe the behavior of your output device accurately, your color won’t end up where you expected it to.
This capability to preview the results before they happen is one of the most valuable things color management brings to the table—it lets you use relatively inexpensive devices like monitors and inkjet printers to predict what will happen when you send your color to much more expensive devices like printing presses or digital film recorders, so you can take any necessary corrective action beforehand.
But to do so, the color management system needs accurate profiles. The process of building a profile is quite simple—you feed the profiling software some measurements, and it munches them and spits out a profile—but just as profile accuracy makes or breaks color management, the accuracy of the data you collect makes or breaks the profile.
If you skipped straight to this chapter without reading Chapter 5, Measurement, Calibration, and Process Control, because you figured it didn’t apply to you, Stop, Do Not Pass Go, Do Not Collect $200. If you just print the profiling target, measure it, and let the profiling software do its thing, you may get a decent profile. But the chances will be a lot higher if you spend some time making sure that the device you’re profiling is working properly before you print the profiling target—that’s why we spent a whole chapter harping about calibration and linearization.
In this chapter, we talk in detail about the things you have to do before profiling to make sure that the data you collect represents the behavior of the device you’re profiling as accurately as possible, and after profiling to make sure that your device keeps behaving the way the profile expects it to. Even if you don’t plan to build your own profiles, relying instead on any of the many reputable profile-building services available online or through consultants, you need to make sure that the profiling target gets printed properly, and you need to be aware of the things that can affect your device’s behavior, and hence the accuracy of its profile, after the profile is built.
The Moving Target and The Rubber Ruler
As we pointed out in Chapter 5, Measurement, Calibration, and Process Control, profiles are snapshots in time. In the case of output profiles, all that they can do is to describe how the output device was behaving when it printed the profiling target.
But most output devices change over time, though different kinds do so in different ways. So unless you like trying to measure moving targets with rubber rulers, you need to develop strategies for making sure that you collect good data to build the profile and for keeping the device’s behavior in sync with the profile. In this chapter, we’ll point out the kinds of variability that plague different types of output devices, and suggest strategies both for collecting good data and for tracking the device’s behavior so that you know the data remains good. The primary tool for doing all these things is the measuring instrument.
Measuring Instruments
If you’re serious about building output profiles, a dedicated measuring instrument is essential.
In theory, you can use either a reflective colorimeter or a reflective spectrophotometer to build output profiles. In practice, we recommend reflective spectrophotometers because they offer the most bang for the buck. They don’t cost a whole lot more than colorimeters, but they’re more accurate and versatile.
Do yourself a favor and choose an instrument that’s directly supported by your profiling software. If you’re a tinkerer by nature, you can probably figure out the data format your profiling software expects—the patch order, the measurement type, and the actual formatting of the file—and then export the measurements to a text file that your profiling software can read, but it’s a lot of work! (Bruce remembers using Red Ryder 10.1, a venerable Macintosh terminal emulator, to take readings with a Gretag SPM50, and blames it for a considerable amount of hair loss.) It’s just so much simpler to use a device that your profiling software can talk to directly.
There are profiling packages that use a flatbed scanner to measure the printed targets, but in the final analysis, scanner-based profilers are like the talking horse: what’s amazing isn’t how well they do it, but that they do it at all. We don’t recommend them.
Measurement Geometry
Spectrophotometers have two different flavors of measurement geometry—the direction from which the light strikes the sample, and the direction from which that light is collected. Instruments with d/0° or 0°/d geometries are often known as “integrating sphere” or simply “sphere” instruments. They measure the color of the sample without regard to surface texture and are most often used in the formulation of paints, inks, plastics, and other colored materials. In the graphic arts world, we favor instruments with a 0°/45° or 45°/0° geometry (the two are functionally equivalent), because they make measurements that correspond more closely to the way the sample appears to the human eye, taking into account surface texture and its effect on the apparent color (see Figure 8-1).
Figure 8-1 Measurement geometries

Most sphere instruments offer an option to “exclude the specular component,” producing a measurement more like the 45°/0° geometry; so if you do use a sphere instrument, use this option if it’s available.
Aperture Size
All spectrophotometers measure light through an opening, or aperture. Most of the spectrophotometers used in color management have a measurement aperture of around 4–8 mm in diameter. Smaller aperture sizes are pretty rare, but some instruments have larger apertures in the 12–15 mm range. The disadvantage of larger apertures is that you have to print targets so that the patches are large enough to be read individually by the instrument, which uses more paper—a concern if you’re profiling expensive art papers or specialty photo-inkjet papers.
However, there are two situations where a larger aperture can help. One is when you’re profiling output with very low line screens, such as billboard printers, where a small aperture may not capture a large enough area to correctly determine the ratio of coverage between the halftone dots and the paper on which they’re printed. The other is when you’re profiling a “noisy” print process, such as uncoated watercolor paper or canvas on an inkjet printer, where each patch contains substantial variation. The larger aperture effectively averages out the “noise.”
Filters
Some papers contain fluorescent brighteners that convert ultraviolet light into visible blueish light, fooling our eyes into thinking the paper is whiter and brighter. (Many laundry detergents use a similar technique, which is why they’re often blueish in color.)
Unlike our eyes, spectrophotometers don’t have white point adaptation and aren’t fooled by paper brighteners, so they see the paper as being blueish. Profiling tools compensate by adding the complementary color, yellow, so the resulting output may have a yellow cast from highlights to midtones, or sometimes even green quartertones, as the yellow ink and bluish paper combine.
One way to deal with this problem is to use a spectrophotometer with a UV filter. Bruce sees this as the colorimetric equivalent of sticking your fingers in your ears and yelling lalalalala—it deals with the problem by pretending that it isn’t there—but he admits that it can produce better results than no UV filtering. The only spectrophotometer we know of that has user-switchable UV filters is the Spectrolino. Other instruments, such as the X-Rite DTP-41, come in two versions, one with a (permanent) UV filter and one without.
We’d prefer to see profiling tools handle UV brighteners intelligently, rather than pretending that they weren’t there—GretagMacbeth’s ProfileMaker 5.0, for example, has an option to detect and compensate for optical brighteners—but thus far it’s the exception rather than the rule.
Polarizing filters are sometimes useful for measuring very glossy papers, particularly when the gloss has a directional component. We’ve found them more useful with dye-sublimation printers than with glossy inkjet papers. They’re also used in instruments designed to measure wet ink on press. (For process control when you’re profiling, you must let the ink dry before you measure it!)
Backing
The ISO standard recommendation is to measure targets on a black backing. While we hesitate to disagree with such an august body, we feel bound to point out that measuring over black can create problems when the stock you’re measuring is thin or translucent, because the black backing results in artificially low luminance readings. (Unless, that is, your final output will be viewed on a black backing, which is typically not the case with thin papers.)
Our recommendation for translucent papers is to measure over a stack of blank stock where possible, or, if you’re using a strip reader (which makes stacking paper impractical), to measure over white instead—strip readers such as the DTP-41 generally give you the choice. A white backing will still skew the measurements slightly, but much less so than a black one will.
Handheld Instruments
Handheld instruments are great for making spot color measurements—you position the measurement aperture on the sample and press the measure button. They’re handy for process control, where you need to take relatively few measurements, but most profiling tools require you to measure hundreds or even thousands of color patches.
With a handheld instrument, you position the measurement aperture on the first patch, press the measure button, move the aperture to the second patch, press the measure button, and so on, several hundred times. Handheld instruments are usually less expensive than the automated varieties and can produce very good results. They’re great if you’re on a tight budget, have plenty of time and strong wrists, and only need to make profiles occasionally—we’ve used them more often than we care to remember—but if you’re like us, you’ll find about halfway through measuring your first target that you’d really like an instrument that offers more automatic data collection.
Handheld reflective spectrophotometers include the Color Savvy ColorMouseToo! CM2S and the X-Rite Digital Swatchbook (DTP-22). Handheld reflective/emissive spectrophotometers, which can measure monitors as well as hard copy, include the various incarnations of the venerable Colortron series, which still receives some degree of support from X-Rite, Spectrostar’s Spectrocam, and GretagMacbeth’s Spectrolino and EyeOne Pro (see Figure 8-2).
Figure 8-2 Handheld spectrophotometers

The Spectrocam and EyeOne Pro offer a unique measuring capability that other handheld spectrophotometers lack. In addition to taking spot readings like other handhelds, you can also use them in a “scanning” mode by dragging them over a row of patches on an appropriately designed target (the instruments need targets where each patch is significantly different from its neighbors to figure out where one patch ends and another starts). These instruments offer a very quick way of collecting data at relatively low cost. The only real downside is that it’s relatively difficult to design your own targets, which is a fairly esoteric concern. (GretagMacbeth’s MeasureTool 5.0, part of the ProfileMaker Pro 5.0 package, can produce custom targets formatted for the EyeOne Pro as well as for various common strip-reading instruments, but it only lets you control the number of patches, not the content of the patches.)
XY Plotters
XY plotters are the most automated reflective spectrophotometers. They use a mechanism that moves the reading head in both dimensions across the face of the target, so you can program them to read an entire target automatically. XY plotters demand the least human interaction for reading patches, but many of them don’t make it easy to measure a single color or a custom set of colors. The two most commonly used XY instruments are GretagMacbeth’s Spectroscan (see Figure 8-3) and X-Rite’s Spectrofiler. But the two are very different and are suited to different tasks.
Figure 8-3 GretagMacbeth’s Spectroscan
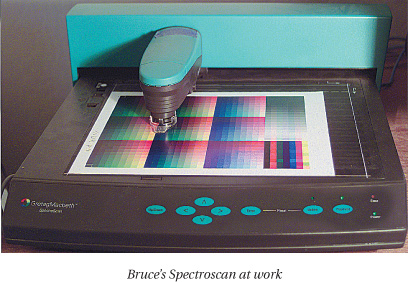
The Spectroscan is actually made up of two parts—the handheld Spectrolino previously mentioned and a mechanized table with a robot arm that moves the Spectrolino from patch to patch. The Spectroscan measures targets up to 31 by 24 cm (12.2 by 9.4 inches) on material up to 1.5 mm in thickness. It lets you specify measurement positions to within 0.25 mm and to average multiple measurements per patch, which makes it very useful for measuring “noisy” print processes such as inkjet on rag paper, where there may be substantial variation within each color patch. Measurement is automatic, but quite slow. On the plus side, once you’ve started the measurement process, you can simply walk away and come back when it’s done.
X-Rite’s Spectrofiler is more specialized—it’s designed to make fast measurements of targets printed in the trim area of a press sheet, either control bars for process control or specially formatted targets for profiling. The patches can be as small as 3.8×1.6 mm, with target widths up to 80 inches (less-expensive versions of the instrument handle 20-inch and 40-inch sheets, respectively). It measures an appropriately formatted extended IT8 target in under four minutes.
Printing the target in the trim area lets you piggyback target printing onto a money-making press run, so the Spectrofiler is great for profiling presses, but it’s less suited to dealing with smaller-format output devices.
Strip Readers
Strip readers are generally the fastest measurement instruments available, although a handheld scanning spectrophotometer like the EyeOne Pro or Spectrocam can come close. They need more human involvement than XY plotters—you need to load the strips into the instrument and keep them properly aligned—and they’re ill suited to making spot measurements for comparison or process control. But they’re quick and efficient for reading profiling targets.
The strip reader that’s most widely supported by profiling tools is the X-Rite Autoscan Spectrophotometer DTP-41. It’s a fast, efficient workhorse for making ICC profiles and is also directly supported by some Electronics for Imaging Fiery RIPs and the BestColor proofing RIP as a calibration instrument. Of late, the DTP-41 has been given a serious run for its money by GretagMacbeth’s ICColor strip reader, which is fully supported in GretagMacbeth’s software and is fast garnering third-party support.
Profiling Packages
All profiling packages work by comparing known reference data with measurement data. In the case of output profiles, they compare known RGB or CMYK values (the ones in the profiling target) with the LAB values we obtain by measuring the printed target. Profiling packages run the gamut (pun intended) from relatively inexpensive (<$100) scanner-based packages to industrial-strength solutions with price tags to match ($2500–$5000). Generally speaking, we find that you get what you pay for, though depending on your needs, you may find that you don’t always use everything you pay for! For example, if your profiling activities are focused on RGB inkjet printers, you don’t need sophisticated control over black generation and other CMYK separation parameters. Likewise, if you’re working with a handheld measuring instrument, the ability to define custom targets with thousands of patches probably isn’t of great interest.
All output profilers work in basically the same way—they provide a profiling target that you print on the device you’re profiling, you measure the target, feed the measurements to the profiler, and then it chews on the measurement data and spits out a profile. (For details on the chewing, see the sidebar, “Profile Creation.”) But within those broad confines, you’ll find plenty of differences. We can’t possibly review every profiling package in this book—it would get out of date very quickly if we did—so instead, we’ll give you a quick rundown of the kinds of features on which different packages compete.
Instrument Support
We don’t think there’s been any collusion between the vendors, but they all seem to have made a conscious decision to support as many of the instruments in common use as they possibly can—this is true even of vendors like GretagMacbeth, who make instruments in addition to profiling software.
Most profiling packages can support any instrument by importing measurements as text files, but it’s a lot more convenient if the package actually drives the instrument directly. With handheld instruments, direct support usually means that the target is displayed on the monitor with a cursor showing you which patch to measure—very helpful when you stop to answer the phone halfway through a target. With automated instruments, it’s perhaps less important but still a real convenience.
With instruments that require specially formatted targets, such as XRite’s DTP-41 and GretagMacbeth’s ICColor strip readers, or the handheld scanning EyeOne from GretagMacbeth and Spectrocam from Spectrostar, the profiler may limit you to a subset of all the available targets. We can’t say we’ve ever found this to be a real problem, but in some situations—for example, if you want to measure the industry-standard IT8.7/3 target to compare your press’s behavior with published standards—you may have to do some searching to find an IT8.7/3 formatted for the EyeOne or Spectrocam. (You can always measure it one patch at a time, but that’s quite tedious. See the following two tips.)
Tip: Download Targets from Different Vendors
Your profiling tool may not offer a target formatted for your instrument, but chances are that some other vendor does. Most profiling tools are available as downloads in demo mode—you need to buy a dongle or license key to actually save profiles, but you can download the package and use the targets and target reference files contained in the package without buying anything. The only tricky part is formatting the target reference file for your particular profiling tool (see the next tip).
Tip: Use a Spreadsheet to Format Target and Measurement Files
The one speed bump in using both measurement files and target reference files that weren’t created by, or designed for, your profiling tool is getting them into the format your profiling tool expects. We find that the best approach is to use a spreadsheet program like Microsoft Excel to reformat measurement and target reference files. They’re almost always tab-delimited text, so you can easily switch things around by simply moving the columns in the spreadsheet.
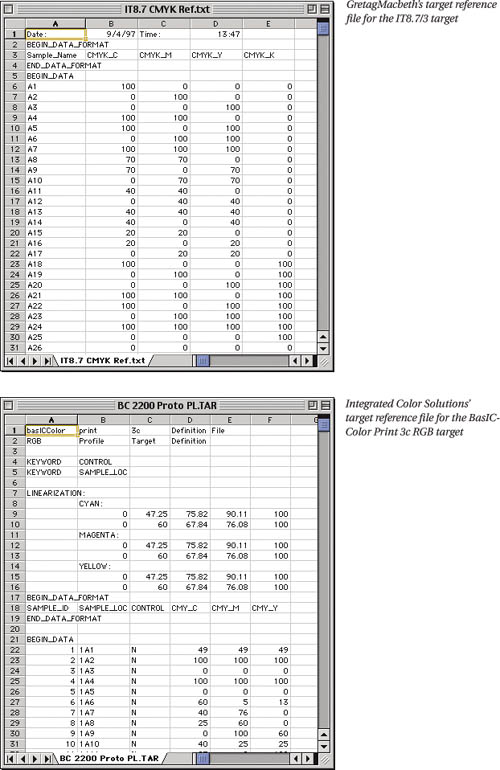
Profilers almost always include sample measurement files. Use one of these as a template to figure out the data format the profiling tool wants (see Figure 8-4). Likewise, profiling tools almost always include target reference files that record the RGB or CMYK values for each patch in the target. You need to take the target reference file for the “foreign” target and reformat it for your profiling tool.
Figure 8-4 Target data reference files
Targets
One of the biggest areas of difference between profiling packages is in the profiling targets they use. Most packages support the IT8.7/3 target for CMYK profiling, but the IT8.7/3 has some shortcomings—its main usefulness is as a standard for publishing reference data for print standards—so most packages also offer one or more proprietary CMYK targets. In addition, the ECI 2002 target, developed by the folks at the European Color Initiative (ECI) is starting to gain traction—it includes all the patches from the IT8.7/3 but adds additional patches to provide a more uniform sampling of device behavior. The almost-ratified IT8/7.4 is a superset of the aforementioned targets, but it’s simply too new to have gained support from profiling tools as we write this. There are no standard targets for RGB output profiling—each profiling package uses its own proprietary RGB target(s).
Besides any special requirements imposed by your instrument, the big difference between different packages’ targets is the number of patches they require you to measure. Most packages need at minimum two to three hundred measurements, some require closer to a thousand, and some give you the option of measuring several thousand patches. Don’t assume that more measurements always means a better profile in the end—in our experience, it depends very much on the profiling software and the device being profiled. A very general guideline is: the closer your device is to being linear and gray balanced, the fewer patches you need; and the more non-linear and/or color casted the device, the more patches you need. In some cases you can end up introducing noise when profiling very linear devices if you measure too many patches. But no matter what, your mileage will vary.
If you use a handheld instrument, you probably want to measure the smallest number of patches possible—the difference between three hundred and eight hundred patches translates to a lot of time and a lot of stress on your wrists! When you have to measure a large number of patches with a handheld instrument, you also run a greater risk of mismeasurement, which will produce a bad profile. With an automated instrument, the number of patches is obviously less of an issue, and it’s common for packages to provide feedback in the form of an error message if mismeasurement occurs.
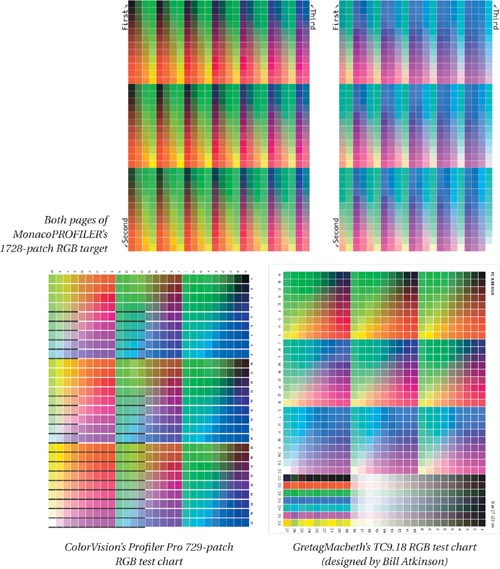
Some profiling tools also let you generate your own custom targets. In the past, we felt that this was strictly for the hardcore color geek, but GretagMacbeth’s ProfileMaker Pro 5.0 makes custom target generation relatively painless (though measuring a 10,482-patch target may be another story!) Figure 8-5 shows targets used by a variety of profiling packages.

If you’re profiling a stable but non-linear process such as an Epson inkjet profiled on top of the driver’s No Color Adjustment setting, using a target with a very large patch count can indeed produce a better profile, but it’s a great deal of work for a relatively modest improvement—don’t even think about it unless you have an automated measurement device!
Data Averaging
If you’re planning on profiling an inherently variable printing process such as a press or color copier, you’ll almost certainly need to measure multiple targets and average the results. Some profiling tools will do this for you. You can always open the measurement files in a spreadsheet program such as Microsoft Excel and average them there, but having the profiling tool do it for you is much more convenient.
Tip: Download GretagMacbeth’s MeasureTool 4.1.5
ProfilerPro 4.1.5 is still available as a demo download from GretagMacbeth’s Web site. You need to buy a license to unlock the ProfileMaker and ProfileEditor applications, but the MeasureTool application offers two very useful capabilities even when the package is running as a demo—it lets you compare measurement files, and it lets you average measurement files. So if your profiling package doesn’t offer data averaging, you can always use MeasureTool to average your measurements before feeding them to your profiler. (MeasureTool 5.0, part of the ProfileMaker 5.0 package, requires a dongle to allow comparisons and averaging—it was good of GretagMacbeth to keep the older version available.)
Linearization
Some profiling packages make profiling a two-step process, whereby you first print and measure a linearization target, like the one shown in Figure 8-6, to determine the linearity of the printer—the degree to which changes in the control signals produce proportional changes in the printed color. The profiler then uses the measurements to generate a profiling target that’s optimized for the specific device.
Figure 8-6 CMYK 50-step linearization target
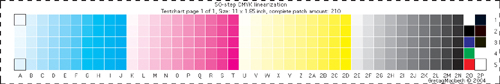
Other packages use linearization as a profile updating feature—you reprint and measure the linearization target (which has many fewer patches than the full-blown profiling target), and use these measurements to update an existing profile. In some cases, you need to build the original profile using the linearization step to be able to re-linearize and update the profile.
Do these packages work any better than those that don’t offer linearization? In extreme cases—for example, when a device starts to plug up, producing the same color at any value higher than 70%—they can. They work by changing the values in the profiling target (and its accompanying target reference file) to eliminate redundancy by lightening the patches so that they lie inside the usable range of the printer.
If you’re working with a CMYK RIP that supports linearization, it’s usually easier to linearize the device through the RIP prior to profiling—that way, you eliminate the need for linearizing the profiling target. However, some RIPs do a better job, or are easier to use, than others, so when in doubt, experiment. Bear in mind that if you linearize partway in the RIP and the rest of the way in the profiling tool, you’re mutiplying the number of variables you need to keep under control. You may get the best possible results that way, but at the cost of introducing more opportunities to screw up.
Parameter Controls
Most profiling tools offer explicit control over CMYK separation parameters such as total ink limit, black ink limit, and black generation, although a few entry-level packages simply offer presets for different CMYK processes. More advanced packages offer control over black start (the point, typically some considerable distance from the highlights, where black ink is first introduced), black shape (the rate at which black ink is introduced as the color gets darker), and black width (the strength of the Gray Component Replacement, or GCR, which dictates how far from the neutral axis black ink is introduced into color combinations). Figure 8-7 shows the separation parameters offered by some of the leading profiling packages.
Figure 8-7 Separation parameters
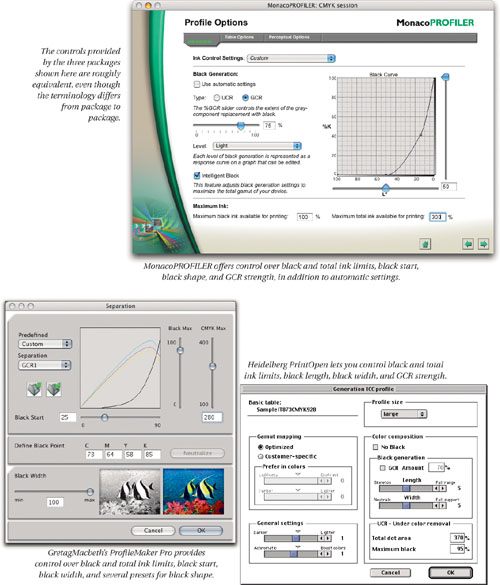
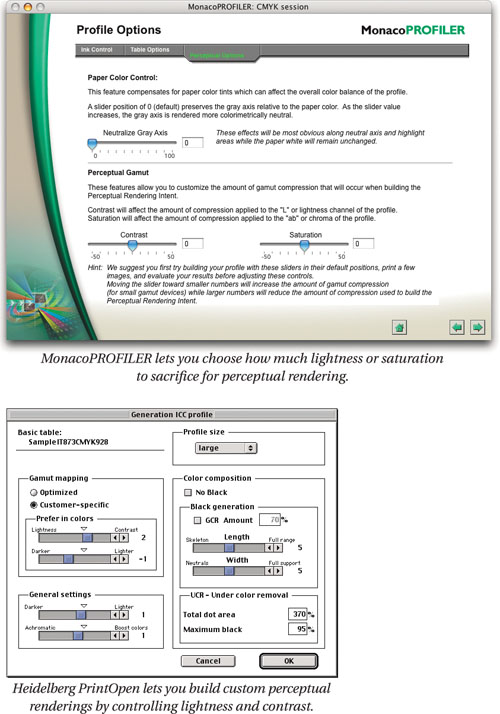
A few packages let you control the trade-offs that are made in rendering out-of-gamut colors using the perceptual rendering intent, letting you choose the compromises between maintaining hue, saturation, and lightness. Figure 8-8 shows the rendering controls offered by Heidelberg PrintOpen 4.5 and MonacoPROFILER 4.5.
Some profilers let you decide whether to aim for a neutral gray axis that’s dead-on neutral or one that’s neutral relative to the paper stock. In our experience, very blue-white papers can cause profiling packages to over-compensate and make true neutrals appear yellow, while the paper-relative neutrals appear much more neutral even if they don’t measure that way.
Profile Editing
Some packages not only generate profiles, but also let you edit them. Profile editing can be extremely valuable, with the important caveat that before you start editing a profile to address a problem, you need to be very sure that the problem does in fact lie in the profile, rather than in the measurement data or the device behavior. See Chapter 9, Evaluating and Editing Profiles, for an in-depth discussion of profile editing.
Getting Good Data
If you just print a profiling target, measure it, and feed the measurements to your profiling software, you may be lucky enough to get a good profile—but unless you take special care when printing the target and taking the measurements, it’s a lot more likely that you’ll get a bad one.
You want to make sure that the output device is working properly when you print the profiling target. Then you want to capture measurements that represent the good working state accurately. Lastly, after you’ve built the profile, you want to make sure that the device keeps working the way it did when you printed the target, and hence that the profile stays valid. Different device types present different challenges, each of which requires a different remedy, so we’ll break the discussion down by types of device, point out the issues you’re likely to run into with each type, and suggest remedies. So feel free to skip from here to the device types that interest you.
Opening and Printing the Target
Profiling targets are possibly the only case where we don’t care at all about color appearance—all that matters is the numbers in the target files. Therefore, it’s absolutely vital that you do nothing to change the numbers in the target files. We make a practice of never, ever, assigning or embedding a profile in a profiling target, both because they’re simply unapplicable, and because it’s all too easy to trigger an automatic conversion when a source profile is present. (It’s possible to trigger one even when there’s no source profile, but no workflow is absolutely bulletproof!)
We almost always print our profiling targets from Photoshop, because Photoshop has very explicit color management controls throughout the process. But whatever application you use, you must make sure that the target doesn’t get converted when you open it.
You can make life simpler by also making sure that nothing happens to the values in the target when you print it, and that the numbers in the target file simply get sent directly to the printing device. See Chapter 11, Color Management in the Operating System, for more information on printer driver color management.
Sometimes you may want to deviate from this strict rule—for example, when profiling an RGB inkjet printer, you may want to use one of the auto-correction features in the printer driver, or when profiling a proofer, you may want to profile on top of linearization curves, or curves set to make the proofer simulate another printing process.
If you do anything like this, be aware that the profile is only valid for that printing condition. When we make profiles in situations like this, we always document exactly what settings we used, and we put some clear indication in both the internal and external name of the profile that it’s a non-standard profile that applies to a particular set of printer settings.
Opening the Target
When we open the profiling target, we always make sure that Photoshop’s missing profile warning is turned on, and we always choose the Leave as is (don’t color manage) option, as shown in Figure 8-9.

That way, we don’t run the risk of inadvertently embedding a profile—it’s all too easy to close the file, get the prompt asking if you want to save, then click the save button. If you assigned a profile, it gets embedded when you save.
Printing the Target
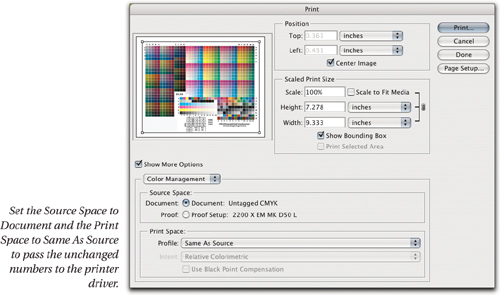
When we print, we always set the Source Space to Document (which, if we opened the target correctly, is always Untagged RGB or Untagged CMYK) and set the Print Space to Same As Source, as shown in Figure 8-10. That way, the numbers in the target are always passed along unchanged to the printer driver.
Figure 8-10 Printing the target
Profiling RGB Inkjet Printers
As we’ve previously pointed out, there’s really no such thing as an RGB inkjet printer—they all use cyan, magenta, and yellow inks, most also use black, and some also add “light” versions of the primaries to help improve highlight detail. We call them “RGB inkjets” because the vast majority require RGB signals as their input, forcing us to profile them as RGB devices.
The reason all non-PostScript inkjets function as RGB devices doesn’t have anything to do with the devices themselves; it’s simply that the data pipeline from the application to the printer driver offered by QuickDraw on the Macintosh or GDI (Graphics Device Interface) on Windows can only pass RGB (or grayscale) data, not CMYK. So even though some applications will let you send a CMYK file to the printer, they perform a hidden conversion back to RGB before handing off the data to the printer driver. (The Mac OS X display architecture doesn’t have this limitation—it can pass CMYK as well as RGB or grayscale—but we’ve yet to see an OS X driver that exploits this capability.)
In theory, inkjets driven by PostScript RIPs should function as CMYK devices, but in practice we’ve found that a good many PostScript RIPs also perform a hidden CMYK-to-RGB conversion. Sometimes the only way to find out which will give you the better results is to make both RGB and CMYK profiles for such devices, and use the one that performs better.
Before Profiling RGB Inkjets
Inkjet printers are typically very repeatable and stable. RGB inkjets don’t offer any calibration features, though they do usually have a plethora of software settings. To get a good RGB inkjet profile, there are three variables you need to worry about.
• Software settings in the driver have a huge impact on the printer’s behavior—see Figure 5-2 on page 118 for some dramatic examples.
• Inkjet prints take time to reach their final, stable color. Even “fast-drying” inks, which appear to be dry when the page comes out of the printer, continue to change color until they reach stability.
• Unannounced manufacturing changes in inks or paper can change the color that the printer produces.
The first two are things you need to take into consideration before you profile. The last one is simply something you need to watch out for when you change consumables.
Media settings
Most inkjets offer settings for different media types, generally those sold by the printer vendor. These settings control the amount of ink laid down, the black generation, and in some cases, the screening algorithm, so they have a huge effect on the print. If you’re using vendor-supplied paper, simply choose that paper type. If you’re using third-party papers, you’ll need to experiment to find out which settings produce the best gamut and the most linear tone scale (often, you’ll need to compromise one for the sake of the other). See Figure 8-11.

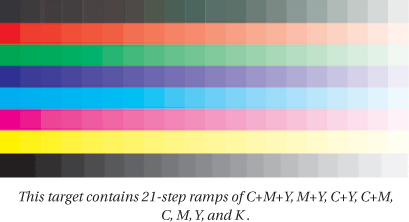
A target like the one shown in Figure 8-12 is useful for all sorts of tasks, including this one: the ramps let you judge the tonal behavior, while the solid colors let you evaluate the gamut.
Figure 8-12 RGB process control target

Don’t expect perfection. Our experience has been that if you achieve the maximum gamut, you’ll have a fairly non-linear tone scale with some blocking of the shadows. It’s often preferable to sacrifice some linearity in favor of a larger gamut—a profile can compensate for non-linearity to some extent, but it can’t do anything about the gamut size. Watch out for puddling, bronzing, or ink bleeding, all of which are signs that the printer is laying down too much ink for the paper to handle. If you encounter any of these problems, switch to a media setting that lays down less ink.
Color settings
Most inkjet drivers offer a variety of color-handling options. Epson inkjets, for example, offer options with names like Vivid and Photorealistic, along with some slider controls and a gamma setting. Fortunately, they also offer an option labeled, “No Color Adjustment.”
Wherever possible, look for a “raw” setting that just sends the numbers unchanged to the printer driver, like the aforementioned No Color Adjustment. It’s the simplest way to profile. In some cases, though, you may find that you get better linearity using some other setting.
Once you determine the settings that yield the best compromise, you can profile this condition, with the important caveat that when you use the profile, you’ll always have to have the software settings set the same way you did when you made the profile. This also means that you can’t use the profile inside the printer driver, because the place you choose the driver-level color settings is the same place you’d choose the profile—you can only have one or the other, but not both. This isn’t a problem when you’re dealing with color-managed applications, but it may be if you need to print from a non-color-managed application such as PowerPoint.
Resolution settings
Most of the inkjets we’ve tried seem to be fairly consistent between different resolution settings, but there’s no guarantee that your inkjet will work that way.
We find that a single profile works for all supported resolutions on a given paper stock, but if that doesn’t seem to be working for you, you can do a quick reality check by printing the RGB process control target shown in Figure 8-9 at the different resolutions, and then measuring each one and comparing the results. See the sidebar, “Comparing Colors,” earlier in this chapter. If the average delta-e in LAB between different resolutions is greater than 1, or if the peak delta-e is greater than 6, you’ll almost certainly want to build separate profiles for the different resolutions.
Curing time
One of the biggest gotchas that people overlook when profiling is that inkjet prints need time to cure. The ink may appear dry when the paper leaves the printer—it won’t smear or rub off—but it almost certainly hasn’t reached its final color appearance because the solvents take time to evaporate and the ink takes time to react with the paper coating. Every inkjet we’ve ever used takes some time for the color to stabilize. (The actual curing time depends on the specific inkset and paper.) If you start measuring the profiling target as soon it leaves the printer, you’ll go crazy trying to figure out what’s wrong with the resulting profile because you really are measuring a moving target.
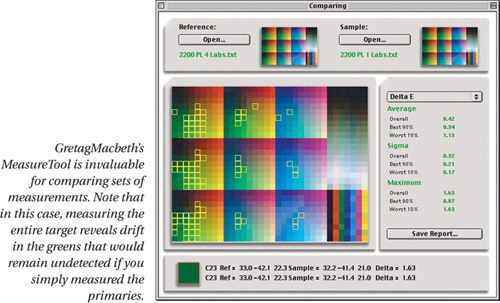
The easiest way to determine the length of time your prints need to attain final color is to keep measuring the profiling target with an automated measuring instrument until you see little or no difference between measurement passes. It’s time-consuming, but you only need to do it once for each paper and ink combination. It’s the combination of paper and ink that is the issue. The same paper will have different curing times with different brands (and sometimes models) of printer that use different inksets, and the same inkset may have radically different curing times on different papers (see Figure 8-13).
Figure 8-13 Comparing measurements
If you’re working with a handheld instrument, though, you probably don’t want to torture yourself measuring hundreds or thousands of patches over and over again. Instead, you can use the RGB Process Control target shown in Figure 8-12. Print the target, note the time it was printed—preferably on the target itself—and set it aside for a couple of hours. Then print the target again, noting the time the new one was printed, and make a visual comparison of the two prints.
If you can see visual differences, you know the print takes at least two hours to cure. Re-examine them periodically until they appear identical, and note how long it takes for the second print to look identical to the first one. This gives you a rough estimate of the drying time.
You need to refine this rough estimate with a few well-chosen measurements. Subtle differences between targets that aren’t obvious to the naked eye can be amplified during the profile calculation process, so measure at least the solid and midtone patches for R, G, B, C, M, Y, and RGB. When the prints have cured, you shouldn’t see any differences greater than 0.5 delta-e LAB between targets. See the sidebar, “Comparing Colors,” earlier in this chapter.
Creating RGB Inkjet Profiles
Profiling tools usually offer few or, sometimes, no parameters to set for RGB output profiles. A good rule of thumb is to start by building a profile at the default settings offered by the profiling tool and depart from them only when you’ve found a reason to do so.
Some profiling packages offer a two-step process in which you first print and measure a linearization chart. The profiler then uses the linearization measurements to generate a custom profiling target tailored to the specific printer at hand. Read the accompanying documentation carefully: some packages, such as Integrated Color Solutions’ BasICColor Print3c, recommend using the linearization step for inkjet printers, while others, such as Monaco Systems’ MonacoPROOF and MonacoPROFILER, recommend against doing so.
Some packages, including MonacoPROOF, MonacoPROFILER and GretagMacbeth’s ProfileMaker, offer a choice of gray rendering as either absolute or relative to the paper. We’ve noticed that with some very blue-white paper stocks, neutrals that measure dead-on neutral appear yellow to the eye because our eyes always adapt to the paper white. In those situations, rendering gray relative to the paper seems to work better. In the case of ProfileMaker, Preserve Gray Axis will produce neutrals that measure neutral yet look yellow, whereas the Paper Gray Axis will produce neutrals that visually appear neutral. These options apply only to the perceptual rendering intent. Other intents are always built using Paper Gray Axis.
A few packages offer some control over gamut mapping for the perceptual rendering intent. There’s no right way to do perceptual rendering: if you’re of a mind to experiment, by all means do so, but we suggest starting out with the default.
When you build the profile, it’s always a good idea to give it a name that’s as informative as possible—one that contains the printer model and the paper stock.
Profiling True RGB Printers
We use the term true RGB printers to refer to devices such as the Fuji Pictrography, Cymbolics LightJet, Durst Lambda series, and anything else that images directly onto photosensitive paper or film. These types of devices usually have robust built-in calibration features that make them highly repeatable. The photographic media they use tends to be very stable with no curing time.
The only real source of variability we find in these devices is that the profiling target may print slightly differently depending on its orientation. Color geeks refer to this problem as anisotropy—an obfuscatory way of saying that the printer produces slightly different color when printing the same image in portrait and landscape orientations. In our experience, the effect of anisotropy is usually quite subtle, and unless you’re picky, you may not even notice the effect it has on your images printed through the profile.
Before Profiling True RGB Printers
If you do notice anisotropy in the printing of the profiling target, we offer two ways to work around the problem—scrambling the patches on the target, or printing the target four times, rotated 90 degrees each time, and averaging the results. If your profiling package either offers to scramble the patches for you (MonacoPROFILER will do this), or uses a target with a randomized set of patches (such as the ones offered by Integrated Color Solutions’ BasICColor Print3c), use the randomized target.
Tip: Use GretagMacbeth EyeOne Targets
Many profiling packages that don’t offer random patch arrangements have targets formatted for the EyeOne. Since the EyeOne’s scanning mode requires big differences between each patch, the EyeOne targets are, in effect, randomized, which makes them ideal for dealing with anisotropy, even if you’re using some other instrument to measure them.
Randomizing the patches yourself might seem like less work than printing and measuring four targets. Trust us—it’s not! You not only have to move the patches in the target file itself; you also have to rearrange the numbers in the target description file that the profiler uses to relate the measured values to the control signals that produced them, and the chances are extremely high that you’ll screw something up in the process. Just bite the bullet and print the target four times at different rotations!
Creating True RGB Printer Profiles
The options offered by profiling packages for true RGB printers are the same as for RGB inkjets, but they may not always produce the same results.
Of those packages that offer linearization, the ones that don’t recommend it for RGB inkjets do recommend it for true RGB printers, and vice versa. Rendering gray relative to the paper tends to have a more pronounced effect on these types of printers than on inkjets—if it’s available, we recommend trying it as your first choice.
Profiling Three-Color Dye-Sub Printers
Non-PostScript dye-sublimation printers function as RGB devices even though they use CMY dyes. The main variables that plague dye-sublimation printers are anisotropy (though for quite different reasons than true RGB printers) and manufacturing variation in consumables.
Dye-sublimation printers vary in their color performance due to thermal latency: they make color by heating the dyes in the donor ribbon until they sublimate—turn into a gas—and get absorbed by the coating on the paper. The laws of physics limit the speed with which the print head can heat up and cool down, so the color can vary depending on what color was printed immediately before the current one.
As with true RGB printers, the remedies are either scrambling the patches or printing the target at multiple orientations and then averaging the results. We’ve generally had better results from printing multiple targets than we’ve had from patch-scrambling, but it means more measurement—so if you’re working with a handheld instrument, you may want to use scrambled patches on a single target to avoid excessive wear and tear on your wrists.
Some dye-sub printers also exhibit directional metamerism, where the color appearance (and the measurement) changes when you rotate the sample 90 degrees. If you average four targets at different orientations, the difference gets averaged out. If, however, you’re measuring a single target, a polarization filter can help (if your spectrophotometer has one).
Some dye-sub printers offer software settings that perform some kind of auto-enhancement on incoming images. Make sure that any such options are turned off before you print the profiling target.
If your profiling package offers a linearization step, it’s likely that your dye-sub printer will benefit from it. Other than that, the default settings for your profiler should work well.
Profiling Composite CMYK Printers
CMYK printers differ enormously in dynamic range, gamut, available paper stocks, and inksets. In this section, we’ll talk about color laser printers, color copiers, solid ink/wax printers, inkjets, and digital presses. (Printing presses have their own section later in this chapter.) In addition, we’ll assume the device is driven by a PostScript RIP.
As with RGB output devices, you first need to make sure that the printer is stable, linearized, and gray-balanced. The different printing technologies are prone to different sources of variability, so we’ll deal with each class’s typical problems and the strategies for dealing with them, separately.
Once you’ve stabilized the printing process (we provide guidelines for doing so below under each printer type), printed the target or targets, and collected the measurements, you’re ready to build the profile. Most profiling packages offer default settings for the different types of devices, and these are usually the best place to start. The most common options are total ink limit and UCR/GCR settings. More sophisticated packages allow finer control over black generation, including black start, the shape of the black curve, and the amount of GCR. See the sidebars, “Ink Limiting” and “Black Generation,” for a discussion of these terms.
In case your package doesn’t provide presets for categories of CMYK printers, we’ve provided starting points for common printer types. These are guidelines, not rules. If you have ink bleeding all over the page and you’re using 400% ink, lower the total ink limit! Likewise, if we suggest a medium black generation, but a lighter or heavier amount gives you better results, go with the settings that give you better results.
Before Profiling CMYK Color Laser Printers
Color laser printers, color copiers, and some digital presses form a class of devices generically called electrophotostatic devices. In these devices, a laser writes the image onto a light-sensitive drum that converts light into a static charge. The drum then rotates, transferring this invisible image made of patterns of positive and negative charge onto the paper. The paper passes by a toner cartridge containing the first colorant in the form of very small and charged particles, which attach themselves to the oppositely charged areas of the paper. Finally, the paper passes through a heated fusion roller that melts and fuses the toner onto the paper. In older color lasers the process is done separately for each colorant, and in the latest generation all four colorants are applied in a single pass.
We explain this technology because it helps you understand its inherently variable nature. The variability comes from two sources:
• Paper needs some humidity to hold a static charge—it can’t be completely dry. Variations in humidity translate directly to color variation.
• When a toner cartridge is new, there are lots of eager toner particles that are itching to jump on charged paper. Over time, the eager toner particles are gone, leaving behind the less eager toner particles, so there’s a steady decrease in the density you can achieve with each colorant.
If you used up the exact same amount of each colorant (extremely unlikely), you’d notice a steady decrease in saturation. More likely, you consume the colorants at different rates, so the relationship in density among the four colorants is constantly changing.
Electrophotostatic printers are a prime example of the moving target. The only solution is frequent calibration—twice a day is typical, and once an hour is not unheard of. The newer generations of machines tend to be more stable than the older ones. So first determine how often you need to calibrate to keep the device reasonably stable—periodically printing and measuring a CMYK process control target like the one in Figure 8-14 is the easiest way to do so.
Figure 8-14 CMYK process control target
We offer two strategies for printing the profiling target:
• Calibrate the printer and immediately print the profiling target.
• Calibrate the printer, print a series of targets (decide how many you’re prepared to measure) throughout the previously determined calibration interval, and average the results.
The first approach will produce a profile that’s accurate for the device’s optimal behavior. The second will give you a profile that’s accurate for the device’s average behavior. If you can enforce regular calibration, use the first approach. If you can’t guarantee that the device will always be calibrated when necessary, use the second.
Creating CMYK Color Laser Profiles
Color laser printers and copiers almost always have fixed built-in ink limiting, so you don’t want to limit it any further. These devices are usually designed to print business graphics, so the colorants aren’t particularly well gray balanced. You’ll usually get the best gray balance by forcing as much gray component as possible to print with black ink by selecting a maximum GCR separation. Here are our suggested separation parameters for color laser printers.
• Total Ink Limit: 400%
• Black Ink Limit: 100%
• Black Generation or GCR: Maximum setting
• Black Start/Onset: 5%-10%
If prints made through the resulting profile seem oversaturated or plugged in the shadows, it’s possible that the printer doesn’t have builtin ink limiting (the Xerox DocuColor series is one example). In that case, we suggest the following as a starting point:
• Total Ink Limit: 260%
• Black Ink Limit: 100%
• Black Generation or GCR: Maximum setting
• Black Start/Onset: 5%-10%
Before Profiling CMYK Inkjets
Most of the things that apply to profiling RGB inkjet printers apply to profiling CMYK inkjet printers as well. The main variable, apart from the software settings in the RIP, is the time the ink needs to stabilize on the paper (see “Curing time,” earlier in this chapter).
If your RIP allows it, it’s usually easier and more convenient to set ink limits and linearization in the RIP before profiling than it is to apply ink limits and linearization in the profile. You won’t get the best possible results by applying ink limits and linearization in both; all you’re doing is multiplying the number of variables you have to contend with. Pick one or the other.
Some RIPs apply ink limiting but don’t let you control it other than by selecting different paper types. If you want to use a paper that isn’t supported directly by the RIP, you’ll need to experiment, but you should begin by building a profile that assumes the ink limits have been set in the RIP.
We rarely find a reason to print multiple targets, though if the inkjet printer is very low resolution (such as a billboard printer) or is very noisy (such as when using uncoated watercolor paper), you may benefit from taking multiple measurements and averaging them—which, with a strip reader, may mean printing and reading two targets.
Creating CMYK Inkjet Profiles
Due to the wide array of inkjet printers, paper stocks, and RIP capabilities, the recommendations we give here are guidelines for a reasonable starting point, not hard and fast rules. Coated papers can generally handle more ink than uncoated ones. If your RIP applies ink limiting (whether you can control it or not), we suggest the following as a starting point:
• Total Ink Limit: 400%
• Black Ink Limit: 100%
• Black Generation: Medium to Heavy (not quite Maximum)
• Black Start/Onset: 30%
If your RIP doesn’t apply ink limits, we suggest as a starting point:
• Total Ink Limit: 260%
• Black Ink Limit: 100%
• Black Generation: Heavy (not quite Maximum)
• Black Start/Onset: 30%
Before Profiling Solid Ink Printers
Solid ink printers (aka crayola-jet or crayon-spitters) aren’t popular (perhaps because people don’t realize how inconsistent color laser printers can be and aren’t aware of solid ink as a viable option). Their main drawback is that the prints are quite delicate—an eraser removes the ink from the paper, heat melts the ink, and sunlight can drastically alter its color.
Solid ink printers work by maintaining a heated reservoir of melted ink. The liquid ink is squirted onto a rotating drum and is then cold-fused with pressure onto the paper. They’re very versatile when it comes to paper types—we’ve even seen one print on a tortilla—and the color is very consistent between different substrates as long as they’re white.
Older models of these printers had to be shut down each day, because the liquified ink cooked over time and changed color. Newer printers don’t have this problem.
Even though these printers have four inks, we usually profile them either as CMY, or as CMYK with no black generation. We’ve never found a reason to average multiple targets.
Creating CMYK Solid Ink Printer Profiles
You may need to experiment for the best results. But in the case of the Xerox Phaser 8200, here are the recommended settings. This effectively builds a CMYK profile that generates separations with no black channel—apparently the black channel is best computed by the printer itself:
• Total Ink Limit: 300%
• Black Ink Limit: 0%
• Black Generation: None
• Black Start/Onset: Not applicable
If you end up with disgusting results, fall back to the suggested settings for the color laser or copier.
Before Profiling CMYK Dye-Sublimation Printers
CMYK dye-sub printers operate identically to CMY dye-sub printers except that they have PostScript RIPs. Whether they have three or four colorants, they’re still considered CMYK devices. But since they operate identically to non-PostScript dye-sub printers, the same considerations before profiling apply, including printing and averaging of multiple targets in multiple orientations.
Most dye-sub RIPs have fixed, built-in ink limiting. If you should encounter the very rare one that doesn’t, don’t make the mistake of thinking that dye-sub can handle 400% coverage—you’ll typically get less density at 400% than at 320% or so, because the extra heat required to lay down 400% coverage sublimates some of the dye out of the paper and back into the donor ribbon!
Creating CMYK Dye-Sublimation Printer Profiles
If your dye-sub has built-in ink limiting, use the following settings:
• Total Ink Limit: 400%
• Black Ink Limit: 100%
• Black Generation: UCR
• Black Start/Onset: 60%
In the rare case that the dye-sub doesn’t have built-in limiting, try:
• Total Ink Limit: 320%
• Black Ink Limit: 100%
• Black Generation: UCR
• Black Start/Onset: 60%
Profiling Printing Presses
Be it lithography, flexography, or gravure, the printing press is The Beast when it comes to printers. On a desktop CMYK printer, you worry about one sheet at a time. On a press, you worry about five thousand sheets at a time. Because mistakes are extremely costly in terms of time and money, you need to take into account some special considerations prior to going down the road of profiling a press.
With other devices, you typically calibrate them to optimal behavior and then profile them. With presses, that’s just one option. You may decide on standardized press behavior rather than optimized press behavior. Or you may decide not to profile the press at all (see the sidebar, “Don’t Profile the Press?!”).
The key factor in deciding how you want your press to behave, and whether or not to profile it, should be your proofing methodology. The press must be able to match the proof. If it doesn’t, you’re in the situation we color geeks technically term hosed, and you must either do whatever’s necessary to force the press to match your proofs or change your proofing system so that it does a better job of predicting actual press behavior (see “Printing and Proofing” in Chapter 10, Color-Management Workflow).
There are essentially two approaches to running presses.
• Do whatever’s necessary in prepress to massage the data so that it produces the desired result on press.
• Treat the press as a $4000/hr. color correction station by adjusting the press to produce a sellable result from questionable separations.
In the latter case, you may as well forget about profiling the press unless you’re willing to spend a good deal of time finding a stable and reasonably optimal set of press conditions, and a somewhat larger amount of time retraining the press operators to hit that condition consistently instead of making artistic decisions based on the current job. You may, however, find it worthwhile to profile your proofing system (see the sidebar, “Don’t Profile the Press?!,” on the next page).
In the former situation, profiling the press is eminently practical, but even then you may decide that building a profile, or a family of profiles, for every paper stock is simply too big a headache. If your current proofing system takes the same CMYK data as your press—that is, it doesn’t rely on a color conversion between press space and proofer space—and you’re confident that you can match your proofs on press, it’s easier and cheaper to profile the proofer instead.
If you aren’t happy with your proofing system, or it’s one that uses profiles to convert from press to proofer space, you’ll need to profile the press, but you may only need to make one press profile (see the sidebar, “Profile the Press Once,” later in this chapter).
Before Profiling Presses
The first consideration is to get the press behaving in as stable a manner as possible—which means very different things for a brand-new sheet-fed press and a 50-year-old web. This isn’t a book about press process control—there are many good ones—so we won’t tell you how to do that; we simply point out the necessity of doing so.
A second consideration is whether you want to optimize your press to take full advantage of its capabilities, or whether you want to make your press conform to some kind of standard or reference behavior such as SWOP/TR001 for magazine publication, the nascent sheetfed TR004 standard from GRACol, ISO 12647-3 for newsprint, or a contract proofing device. See the sidebars “Optimized or Standardized Press Behavior,” and “Intentionally Non-Linear,” later in this chapter.
Printing a profiling target on press demands a significant commitment of time and money. Moreover, the measurement data you collect from the target run will likely be reused, because building the best possible press profile is almost always an iterative process. So no matter whether you opt for an optimized or standardized press condition, you should treat the target run as a critical job.
Choosing profiling targets
Most profiling packages offer proprietary targets as well as IT8.7/3, largely due to the latter’s shortcomings. However, a couple of new standard targets are worth considering:
• The 1,485-patch ECI 2002 target from the European Color Initiative performs better than the IT8.7/3.
• The brand-new IT8/7.4, which contains 1617 patches, is effectively a superset of the IT8.7/3 and the ECI 2002. At the time of writing, the IT8/7.4 was simply too new to be supported by any profiling tools, but we expect that to change during this book’s shelf-life.
Both targets come in randomized versions. GretagMacbeth already offers the ECI 2002 as their preferred target for profiling presses. We recommend using a randomized target if at all possible (such as the version GretagMacbeth offers for the EyeOne Pro). Otherwise, gang copies of the target in four different orientations and expect to do extra measuring.
When you print a run of targets, you’ll have hundreds if not thousands of press sheets from which to choose. We recommend selecting between 10 and 20 sheets to measure and average. There are two equally valid schools of thought on which sheets you want to measure:
• Measure targets representing the full range of the press output. Don’t measure 10 press sheets in the middle of the stack—get a sample of sheets representing the natural oscillation of press behavior, with some really good press sheets, some average press sheets, and some below-average press sheets that nevertheless wouldn’t be rejected.
• Measure targets representing the sweet spot of press output. Sample only those press sheets that represent the ideal press behavior you wish it always had from the beginning to the end of a press run.
In the first case, the intent is to ensure the profile represents the overall average sellable product from the press. Use this technique when press process control and consistency are acceptable, but not outstanding—you don’t have a whole lot of near-perfect sheets or below-average sheets, and most of them are average.
In the second case, the intent is to make sure that average or below-average press sheets don’t add noise to the profile. Use this technique when press process control and consistency are excellent. Most press sheets will hit the intended aimpoints; therefore, you want the profile to expect those aimpoints.
Creating Profiles for Presses
While most packages supply default ink limit and black generation settings for different press types, consider them starting points—each combination of press, ink, and paper has its own requirements.
The ink limits for a particular press are usually known (and if they aren’t, they should be determined as part of the exercise of stabilizing the press), but black generation is more of an open question. Entry-level packages may simply offer preset UCR and three or four strengths of GCR black curves. More sophisticated packages offer complete control over the black curve shape, start, and end points, and also let you decide how far to extend black away from the neutrals and into saturated colors—see Figure 8-15.
Figure 8-15 Black generation controls

When making press profiles, we rarely make a single profile. Instead, we build a family of profiles that differ only in their black generation to accommodate different image types (see the sidebar, “Black Generation,” earlier in this chapter). Often, after we’ve used the profiles, we’ll go back to the measurement data and generate new profiles with slightly refined black curves. Until you’ve used the profiles on live jobs, it’s pretty much impossible to tell if your profile would be improved by setting the black start value to 38% rather than 40%, for example. See Chapter 9, Evaluating and Editing Profiles, for profile evaluation techniques.
Profiling Multichannel Printers
You might think any printer that uses more than four inks qualifies as a multichannel (sometimes referred to as deviceN Color) printer. Nothing could be further from the truth. In an overwhelming majority of cases, printers that have six, seven, eight, 10, sometimes 18 inks are treated and profiled as either RGB or CMYK. The challenge is in knowing which one.
In most cases, you’ll need to make both an RGB and a CMYK profile to see which is better. The RIP or printer driver separates the RGB or CMYK data you send it into the control signals for the specific inks in the printer.
A few inkjet RIPs actually let you control each ink individually and offer support for six-, seven- and/or eight-color ICC profiles. In this case, making such a multichannel profile may be worthwhile. In the case of printing presses, it’s really the only way to go because you need multichannel separations to generate the film and plates for use on press. Be warned, however, that few profiling packages provide support for multichannel profiling, and those that do often do so only at extra cost.
Building multichannel profiles is the trivial part of the task. Printing the target optimally and collecting the measurement data are the tricky parts. No one has massive amounts of experience building multichannel profiles—you’re on the bleeding edge—so the best advice we can offer is to remember the guiding principles of profiling:
• Do what’s necessary to make the device behave the way you want it to.
• Print the profiling target while the device is behaving that way.
• Make sure that the measurements you collect truly represent the device’s behavior.
Checking the Map
If you’re careful about following the principles we’ve laid out in this chapter, you may get perfect profiles on the first try—maps that show exactly where your color will go. Our experience tells us that although a newly built profile may be very good indeed, it can almost always be improved. In the next chapter, we look at techniques for evaluating and editing profiles.