
Debugging Your Scratch Applications
No matter how carefully you plan out your Scratch scripts, somewhere along the line you are going to run into errors. As previously demonstrated, Scratch helps you locate and identify scripts that contain run-time errors, and while your Scratch applications are not subject to syntax errors, logical errors can be particularly difficult to track down and identify. Fortunately, there are a number of debugging techniques that you can employ to help you track down and eliminate problems within your application’s scripts.
Basic Debugging Techniques
One of the challenges in debugging a Scratch application is to identify when things are happening. Scratch helps simplify this challenge a bit by highlighting scripts when they execute. However, the exact activity occurring within a given script can be hard to identify. This makes it difficult to determine if things are occurring in both the order and manner that you intend for them to.
Making a Little Noise
Once way of figuring out what is happening within an application is to embed code blocks inside your scripts for the purpose of notifying you when things occur. For example, using a sound block you could play a note every time a particular variable is updated during the execution of your script. Using this sound as a means of keeping track of updates, you could verify that a variable’s value is being properly set when testing the application. If during testing you do not hear the sound played, then you know that something is wrong. If the variable that you are watching is modified in more than one place within a script, or if it can be modified by different scripts, you might want to play different notes at each location where variable modifications occur. Then by simply keeping your ears open when testing the execution of your application, you may be able to track down the script or area where the problem lies.
Display Informative Messages
Of course, you do not have to work with sound blocks. If you prefer to, you can work with looks blocks instead. Looks blocks provide the added benefit of being able to display text, which you can use as marker within script execution to let you identify exactly when certain parts of a script are executing. For example, you might begin each script with a looks block that displays a text message announcing that the script is executing and end each script by displaying a closing message. You might embed additional looks blocks at key locations within your script to notify when specific things happen. If, for example, when testing an application, a particular text message is not displayed when you expect it to be, then you will know where to begin looking for the source of the problem.
Tip
If you think that a variable is not being set correctly during script execution, you can enable the display of a monitor so that you can keep your eye on the variable’s assigned value when testing your application. However, if your application utilizes a larger number of variables, displaying lots of monitors can get in the way of things. As an alternative, you can keep an eye on the value of a variable by displaying it inside a looks blocks, as demonstrated in Figure 15.1.
Figure 15.1. Using a looks block to report on a variable’s assigned value.
![]()
Although not obvious because of the shape of some looks blocks’ input fields, you can use them as shown above to display a variable’s value.
Slowing Things Down
Because of the speed at which things tend to happen in many applications, it can be difficult to keep track of what is going on. If you are using looks blocks to display helpful text messages, you can slow things down by pausing script execution for a specified number of seconds. Alternatively, you can also slow things down by using the control block shown in Figure 15.2 to pause script execution.
Figure 15.2. You can use this code block to slow down script execution.
![]()
By temporarily halting a script, you can give yourself time to check on variable values to see if they have been correctly set and poke around and look at the activity of other scripts. This is especially helpful in applications made up of multiple scripts and scripts where broadcast messages and variables are used to coordinate the execution of script activity.
Testing Individual Scripts
When testing your Scratch applications, it is important that you make sure that every script gets executed. Otherwise, you may miss out on finding a potential problem. To make sure this happens, take time to test all of the functionality and features of your applications. One easy way to do this is to double-click on every script in your application and observe the effects of its execution.
Breaking Things Down into Smaller Pieces
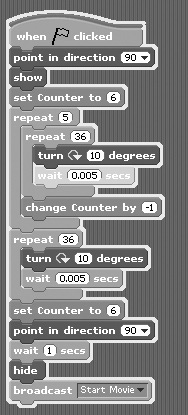
Really large scripts can be challenging to test because of their size and inherent complexity. One easy way of getting around this challenge is to break these scripts down into smaller parts when individually testing them. As an example of how you might do this, take a look at Figure 15.3.
Figure 15.3. Testing a script by breaking it down into smaller parts.
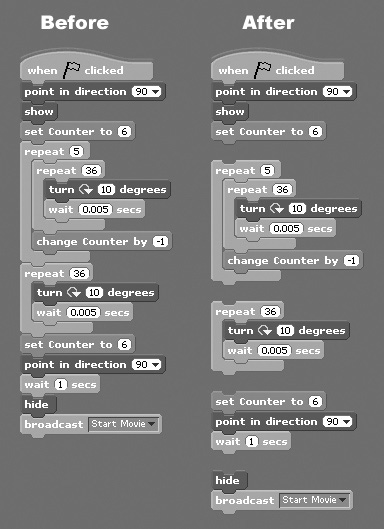
By breaking down a script like the one in Figure 15.3 into multiple parts, you can double-click on each part and examine its effects on your application. Should something unexpected occur, you will know exactly which part of your script to focus on to find the source of an application’s problem.
Making Liberal Use of Monitors
Another important source of information at your disposal that you can use when debugging your application is code block monitors. By temporarily enabling the display of monitors when testing your applications, you can keep track of key data used by your applications. Once you are done testing, you can disable the display of any monitors that you do not need to display as part of the normal operation of the application.
Running Your Application in Single Stepping Mode
In addition to all of the debugging techniques discussed above, Scratch provides one additional debugging tool, known as single stepping. When you run an application using single stepping mode, Scratch slows down the speed at which your application executes, making it easier for you to monitor execution flow.
Normally the Scratch IDE highlights an entire script with a white outline when it executes. But when run in single stepping mode, Scratch also highlights individual code blocks as they execute. As your applications execute in single stepping mode, you can monitor their execution flow to determine if things are executing in the proper order.
Note
You can control the speed at which your application executes by pressing the Shift key and left-clicking on the Extras button, then clicking on Set Single Stepping from the popup menu that appears. This displays a list of options to control single stepping execution speed. These choices include:
Turbo Speed
Normal
Flash blocks (fast)
Flash blocks (slow)
To develop a better understanding of how single stepping works, consider the following series of examples, which demonstrate what you can expect to see when running an application in single stepping mode.
To turn on single stepping mode, click on the Extras button located at the top of the IDE and then click on the Start Single Stepping option from the popup menu that appears. Once single stepping has been enabled, go ahead and start running your application. As the application executes, two things become immediately obvious: Things are occurring more slowly, and in addition to highlighting each script with a white outline as it executes, Scratch now highlights individual code blocks as they execute.
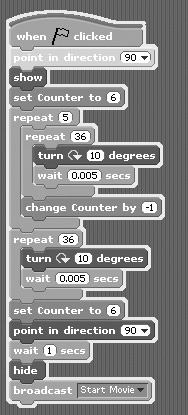
Below is an example of a script that has begun executing, as indicated by the white outline that surrounds the script. Within the script, you can see that the second code block is the code block that is currently executing because Scratch has highlighted it using a yellow color.
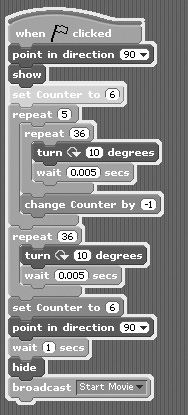
Normally, Scratch runs scripts so quickly that it would not be practical to try to monitor the execution of individual code blocks. However, single stepping slows things down enough to let you do so. For example, as shown below, you can clearly see that the fourth code block is now being executed. If you have a monitor for the Counter variable displayed on the stage, you would be able to confirm that the code block has correctly modified the variable value.
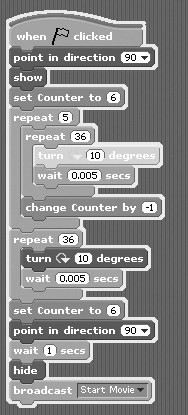
Within a few moments, the script enters into a loop and begins the repeated execution of two code blocks. Below you can see how the script looks when the first of these two code blocks is executed. As you can see, this code block rotates its sprite by 10 degrees. You should be able to observe this movement by watching the sprite on the stage.
After a brief pause, the second of the two code blocks in the loop executes, as shown here.
Scratch continues to highlight code blocks one at a time for as long as the script executes, giving you the opportunity to validate that the script is executing exactly as you expect it to and that variables are being modified as you want. If while monitoring script activity you see something happen that you do not expect, you can halt application execution, knowing exactly where the problem lies.
As your application executes in single stepping mode, you can also keep an eye on variable values, ensuring that they are being properly set and modified as you expect them to. You can also switch between sprites and observe other scripts, which will also be executing in single stepping mode.
Hint
Although single stepping is a very helpful debugging tool, it lacks many of the features that are usually included in debugging tools provided by most modern programming languages. For example, it lacks the ability to set breakpoints, which pause execution when certain code statements are reached, giving programmers the ability to access an application’s status before allowing the application to continue its execution. Still, single stepping serves its purpose well, and when combined with the debugging techniques covered in this chapter, it should be more than sufficient to help you track and fix any application bug.