
52 2. LOOKING OUTWARD
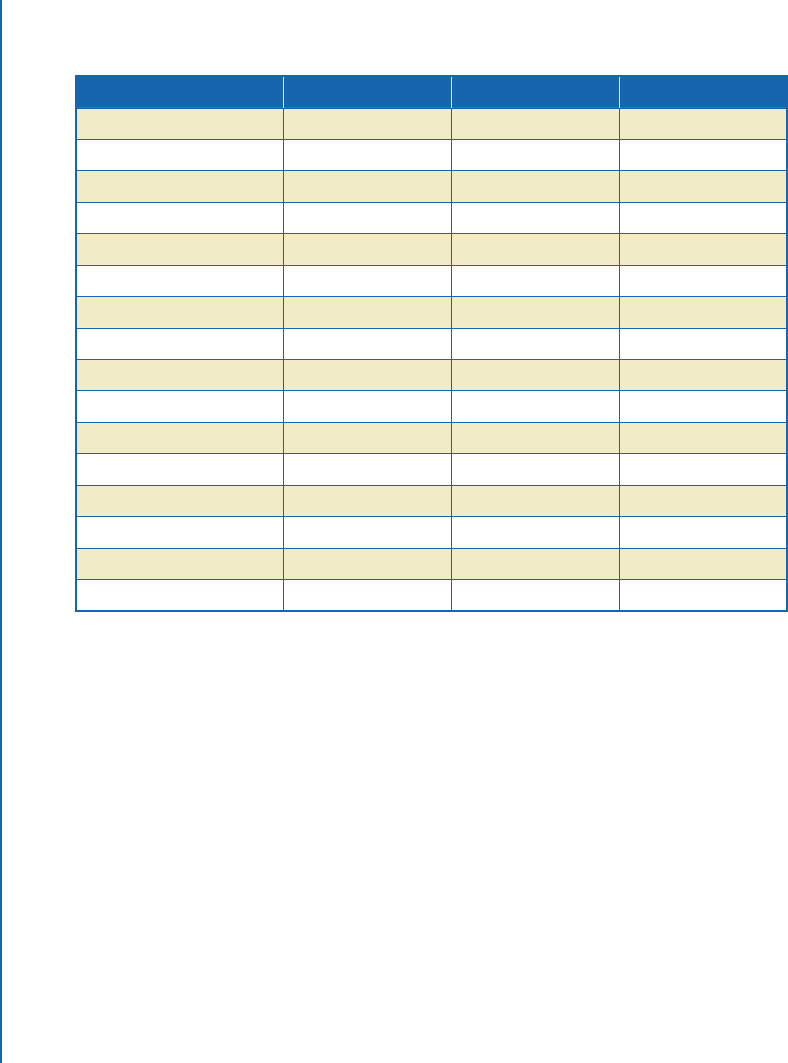
Table 2.5: Some representative galaxies between the Milky Way and the distant quasar 3C 273.
e last column gives the name of the galaxy cluster of which each is a member.
Galaxy Diameter (kpc) Distance (Mpc) Cluster
Milky Way 50 0 Local Group
Andromeda Galaxy 70 0.78 Local Group
M 33 20 0.81 Local Group
NGC 300 46 2.15 Local Group
NGC 55 20 2.17 Local Group
M 81 28 3.70 M81 Group
M82 11 3.59 M81 Group
M87 300 16.4 Virgo
NGC 1399 40 19 Fornax
ESO 137-001 30 68 Norma
NGC 4911 40 98 Coma
NGC 6041 67 145 Hercules
Hoag's Object 40 188
LEDA 20221 300 330 Gemini
LEDA 51975 300 570 Bootes
3C 273 60 750
vastly more distant from each other than are the individual stars within our Milky Way, the
enormous size of a typical galaxy more than makes up for this.
Let us draw our scale model on a typical 75-m long roll of 40-mm wide, cash register
receipt tape. If we pick our scale such that 300 kpc is equivalent to 30 mm on our tape, then a
drawing of our largest galaxy will fit with only a little room left over. e scale is then 1 mm on
our tape to represent 10 kpc in space. Since there are 1000 mm in a meter, and 1000 kpc in a
Mpc, it also means that one meter of our tape represents 10 Mpc of distance in space. And so
for this choice of scale we have the simple result that the numbers, divided by ten, in the second
column of Table 2.5 represent the diameter of each galaxy in millimeters on our tape. And the
numbers in the third column—also divided by ten—represent the scaled distance of each galaxy
from the Milky Way, in meters.
e smallest galaxy on this scale is only a little over 1 mm across—tiny but still easy to see
(or draw). e total distance can be easily walked. See Figure 2.20 for an example.
..................Content has been hidden....................
You can't read the all page of ebook, please click here login for view all page.