63
C H A P T E R 4
Tools for Understanding Time
4.1 TIMELINES
A history is a sequence of events that happen over time. e difficulty is that important things
happen over both very short and very long time intervals. One way to deal with this is to make
a timeline—we convert time into a convenient length scale that is easy to experience directly.
A 70-m long roll of cash register receipt paper makes for an excellent medium with which
to embody a timeline. As an example, let us imagine using such a roll of paper to make a timeline
of an entire human life of 100 years. If we use the full 70 m length of the roll to represent
100 years, then what is the shortest amount of time that we can record in practice? Assuming
that we could make marks on the paper as small as 1 mm apart, our full roll of paper is thus
70,000 such millimeters long. And so we could make marks to represent a time span as short as
.100=70;000/ yr D 0:00143 yr « 12:5 hr.
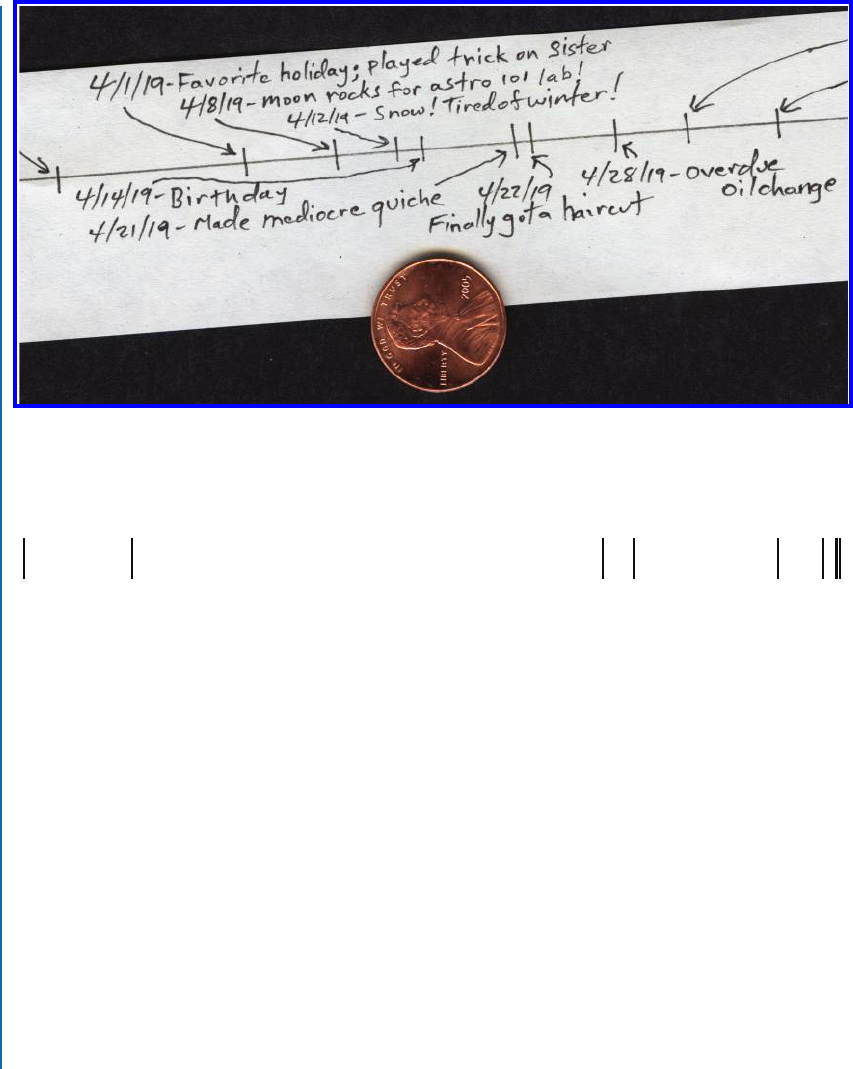
See Figure 4.1 for a tiny detail of the timeline of my life. And so at a scale of 1 mm for
every 12.5 hr, our timeline reaches an easily-walkable 70 m to represent the time span of 100
years.
But as is the case for a scale model, timelines are of limited use for conceptualizing time
scales that include important intervals that vary over many powers of ten. And so our 70-m roll
of paper can easily be used to encompass a century. But at such a scale, it is useless for portraying
events that happen on scales of minutes, seconds or fractions of a second.
4.1.1 LOGARITHMIC TIMELINES
We can easily walk the length of a paper tape that is, for example, 100 m long. And if laid out
in a large field, we could look over the entire length of the tape, and so directly “experience” its
length. e smallest detail we can directly experience, however, is on the order of 1 mm. is
would give us a factor of about 100,000—five powers of ten—between the largest and smallest
times we could record on our timeline.
As we shall see in Chapter 6, a history of the universe includes important events that
occur over time intervals that vary by sixty powers of ten. And so it would be pointless to make
proportional marks on a paper tape as a visual representation of key events in the history of the
universe. Nearly all of the marks would appear all bunched up on top of each other at the begin-
ning of the tape. We can, however, modify our visual timeline through use of the mathematical
tool of logarithms, discussed in Chapter 1.
64 4. TOOLS FOR UNDERSTANDING TIME
Figure 4.1: A small percentage of the timeline of my life. At the chosen scale, if I live to be 100
years old it will all fit on a single 70-m roll of register receipt paper.
Figure 4.2: A timeline of the events in Table 4.1 can easily be incorporated in a small space if a
logarithmic scale is used instead of a linear one. But it is more difficult to intuitively grasp the
result.
As an example, consider the list of times in the first column of Table 4.1. ese particular
times mark key events in the history of the universe, as we shall describe in more detail in Chap-
ter 6. e second column gives scaled distances for our timeline, such that the longest time just
fits on our 100-m long paper tape. Notice that the first four marks are all microscopically close
to zero, on our 100-m long tape. Indeed, that is an understatement; 4:2 ˆ 10
´14
is three orders
of magnitude smaller than a hydrogen atom, and 2:3 ˆ 10
´16
m is smaller than the dimensions
of an atomic nucleus! Even our fifth mark is only a mere 2.8 mm from our zero mark.
e third column is the base ten common logarithm of the time t, and the fourth column
represents an appropriately scaled timeline for these logarithms. e logarithmic scale does so
well at compressing many powers of ten that we clearly need not bother with a 100-m-long
paper tape. In fact the entire logarithmic time line will fit on the page of this book, although the
spacing between the last two time events is barely visible at this small scale. See Figure 4.2.
..................Content has been hidden....................
You can't read the all page of ebook, please click here login for view all page.