
9.4. THE MAIN SEQUENCE 125
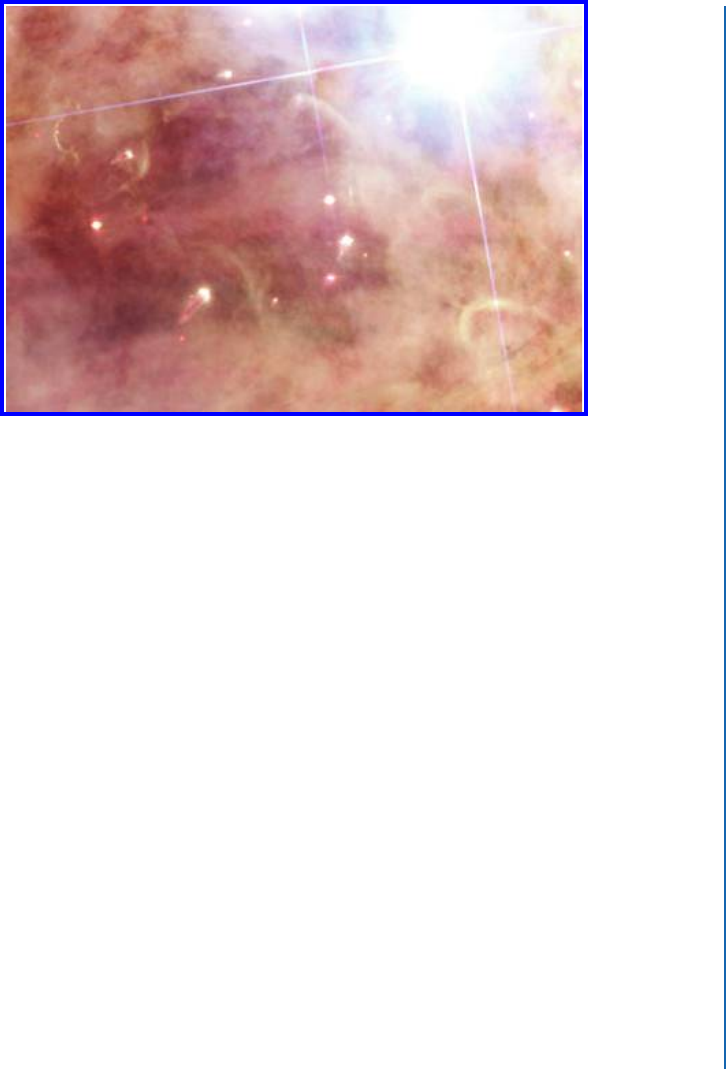
Figure 9.4: An enlarged detail of the Orion Nebula, near the Trapezium. EGGs, tiny comet-
shaped structures, can be seen. Small dense clumps containing proto-stars are being evapo-
rated by the intense light pressure of the Trapezium stars. (Image by NASA, ESA, M. Rob-
berto (Space Telescope Science Institute/ESA) and the Hubble Space Telescope Orion Treasury
Project Team, Public Domain.)
its own gravity. As it contracted, it fragmented into smaller contracting parts, some of which
formed individual stars. e brightest of these stars partly blew a hole in the near edge of the
nebula, allowing us to see inside. e ultraviolet light from these very hot stars excited the gas
in the nebula, causing it to glow.
9.4 THE MAIN SEQUENCE
ere is a physical reason that most stars, when their temperatures and luminosities are plotted
on the H-R diagram, tend to lie along the main sequence. For any given star, most of its visible
lifetime is spent with a luminosity and temperature that places it on the main sequence of the
H-R diagram. Since stars spend roughly 90% of their time in this stage, it follows that just by
chance, we are most likely to find them as main sequence stars.
A given star changes very little while it is on the main sequence. Most main sequence stars
increase their luminosities only very gradually and very slightly, while also becoming slightly
cooler. is causes them to gradually migrate roughly perpendicular to the main sequence band
(the exact path varies somewhat for different parts of the main sequence). And so the main
sequence is a band rather than a narrow line. Ten billion years are required for a star like the Sun
to undergoes those rather minor exterior changes.
..................Content has been hidden....................
You can't read the all page of ebook, please click here login for view all page.