Much like C++ code, UE allows us to debug our Blueprints. This is a very useful tool that Unreal has provided for us. Let's take our BH_BarrelKiller_Blueprint as an example. We have just created a node cluster that performs functionality based on a logical check. If we were developing in C++ code and our desired functionality was not taking place, we would place breakpoints throughout the areas of code we wish to investigate, so we can closer inspect our game state at runtime. We can perform the same debugging functionality with Blueprints. We have scripted some blueprint functionality that should only destroy actors when they are of type BH_Barrel. So, let's place a breakpoint on our Destroy Actor function node by right-clicking on the node and selecting Add breakpoint. Nodes with breakpoints can be denoted by a small red circle in the top left-hand corner of the node.
Now place an instance of our BH_BarrelKiller at the base of our first ramp and run the project! Eventually our breakpoint will be hit and you will be presented with something that looks like this:
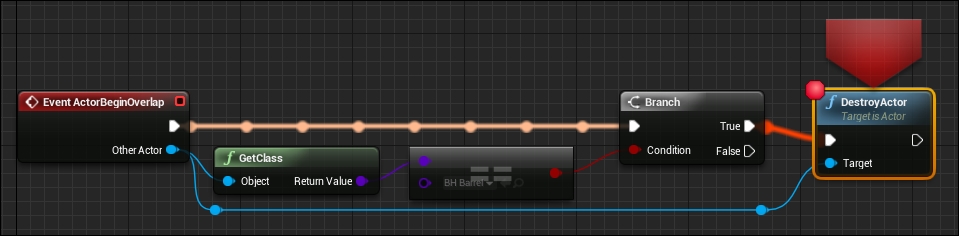
The giant red arrow denotes the node on which the breakpoint was hit. You will also notice that the execution path has been highlighted and features a series of nodules translating toward the node. This is used to show you which execution path is currently being taken! This is very important when working with blueprints as the number of execution paths that stem from one event can become quite numerous; this highlight shows you exactly what order your node set was executed in.
Another useful tool that is provided to us is the preservation of runtime debug values. In other words, the variable states and temporary variable states are preserved when a breakpoint is hit, and you can inspect each value to see if the correct values have been stored. Given our current breakpoint, we are interested in two variables. The first being the type that was returned from the Get Class function, and second being the Boolean result of our comparison node. If you hover your mouse over the purple class input pin on our comparison node, you will see runtime debug information about that value. As shown here:

As you can see, the value is currently set to BH_Barrel.BH_Barrel_C, which means the class type is of our BH_Barrel Blueprint, which is exactly what we are looking for. You can also see the result of our comparison node by hovering over the input pin on our branch node. You will see that it has been set to true, which is why our true execution path from the branch node has been hit.
The final debugging tool that will be covered this chapter is the Debug Filter, which can be found in the Toolbar panel at the top of the Blueprint window next to the Play button. This filter allows you to isolate one Blueprint object you wish to test for debugging. Perhaps, only one of your Blueprint instances is not working. If you know the name of the object in the world outlier, you can specify the name here and you will only receive debugging output relevant to the specified object, this includes breakpoints!