
One of the main debugging toolsets for a UE4 developer is the in-play console. We can do things like invoke game travel to different maps, flag various profiling and statistical captures and change render settings at run-time. In this chapter we will look at how we can connect to listen servers via the console, as well as some of the great rendering and profiling settings we can invoke. It is important to note that all of these commands are available in editor and can be very useful from within the editor as well.
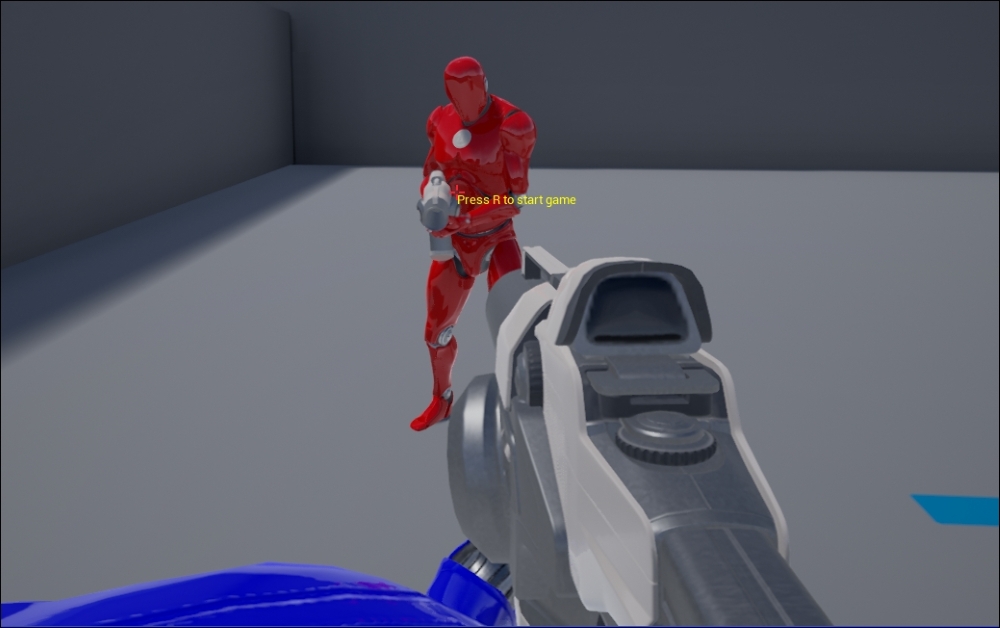
Right now your two game clients will both state "Press R to start game" as they are currently not part of an online session, therefore their net role will default to ROLE_Authority. With the NS.exe instance selected, press the tilde key; this will open the console as follows:

This console, much like every text-based search in UE4, does include an auto complete feature. It will suggest various actions that include some/all of the letters already typed. Now type Open into the console. You will be presented with the following list:
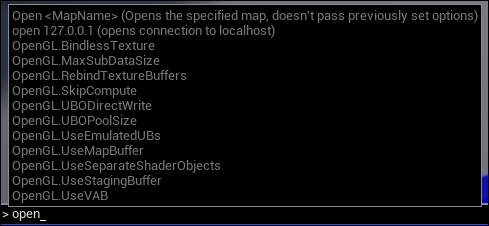
Here we can see that the generated list has suggested most of the commands available with open included in the command. The one we are concerned with is open 127.0.0.1. as we are attempting to connect to a server running on the same PC as the client we want to connect to the localhost. If you are attempting to connect to another PC over LAN you would need to replace 127.0.0.1. with the IP of that computer. With the open 127.0.0.1 command open in the console press enter to execute the command! The client will now connect to the server!
As you can see, we have connected to the server! You can do this for as many clients as you would like!
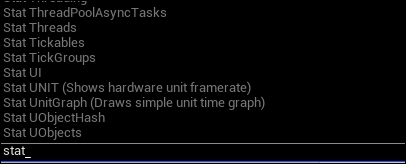
The console is exceptionally useful for getting runtime information about your game's performance. We can leverage some of the statistic capture commands and visual outputs to test the performance of our NS project! With either the client or the server selected type stat into the console, you will be presented with all of the available stat commands that can be used to get runtime information from the project:
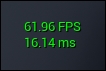
The entry point for any profiling is to know what your average frame per second is. We can achieve this by bringing up a simple FPS value by typing stat fps into the console.
The next thing we would probably like to know is where our frame cost is going. Thankfully, UE4 records the ms time for each of the major threads running: Game, Draw and GPU. Each thread can be described as follows:
- Game: This will be the total cost of all game-based processes; this includes physics calculations, blueprints, and anything else that would be considered on the CPU apart from draw instructions being sent to the GPU. You may find this has a high value when you are running inefficient code, running a scene with a high number of actors, or when the game world has not been optimized to work well with the garbage collection system in UE4.
- Draw: The draw thread is indicative of the runtime cost that is incurred by batching and sending instructions to the GPU. This value will be high when transferring information from the CPU to the GPU numerous times per frame.
- GPU: The GPU thread shows you the amount of time it takes for all of the drawing to take place within your scene. This value will increase as graphical fidelity increases, and can be directly controlled by reducing the visual quality of your project.
It is important to know where most of the processing time is taking place in your projects so you can direct your optimization efforts towards the right areas. It is important to note that the Game thread can be capped by the render thread so that, when Vsync or smooth frames is enabled, the Game thread will wait on the render thread. Therefore, when profiling, these two threads will appear to have the same frame time cost. It is important to disable both vsync and frame smoothing via the editor settings when making builds to be scrutinized for profiling.
We can get access to this thread information from our NS.exe by typing stat unit into the console. Do this now:
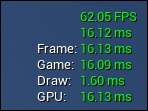
We can see here that our Draw thread is only taking 1.60 ms as we are not sending much information to the GPU every frame. I took this capture with Vsync enabled to demonstrate that our Game thread is bound to the GPU thread. They both read ~16.0ms where in reality, for this current project, they should be much smaller. As a comparison, here is the same capture made with smooth frames turned off and Vsync disabled:
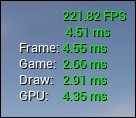
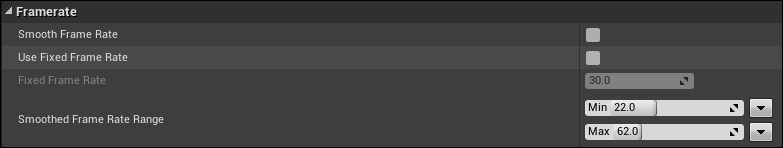
This will make your frame readings more erratic but also more accurate as well. Vsync can be disabled by typing r.Vsync 0 into the console and smooth frames can be found within the project settings at General Settings | FrameRate:
Another thing we can do is view a histogram of our frame rate over the last hundred frames or so. This is can be achieved by typing stat unit graph into the console. This will bring up the following graph:
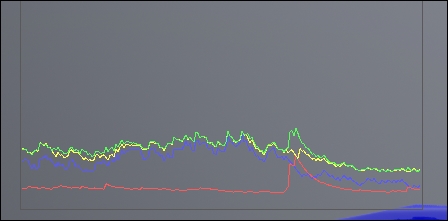
You will notice that once this graph is activated, the various thread stats on the right hand side of the screen will become color coded. This is so you can scrutinize those threads with the information in this graph. The green line will represent the total frame cost. The yellow is the GPU thread, the blue is the Draw thread, and the red is the Game thread.
Unfortunately, we do not have the time left in this book to go into profiling in depth, but this link is a great place to start at https://docs.unrealengine.com/latest/INT/Engine/Performance/.
The documentation details profiling the CPU via the front end session manager or GPU using the graphic profiler as well as some other stat commands that give you runtime information on the current memory cost of your scene!
There are various visualization modes you can activate via the console. These modes will provide you with visual information about the various rendering and game processes within the game scene. These visualizations are a great way to identify rendering costs within your scene or to identify how prominent a given effect is in your scene (such as SSR reflections, for example). If you are scrutinizing your project from within the editor, you will be able to utilize this great rendering debug feature.
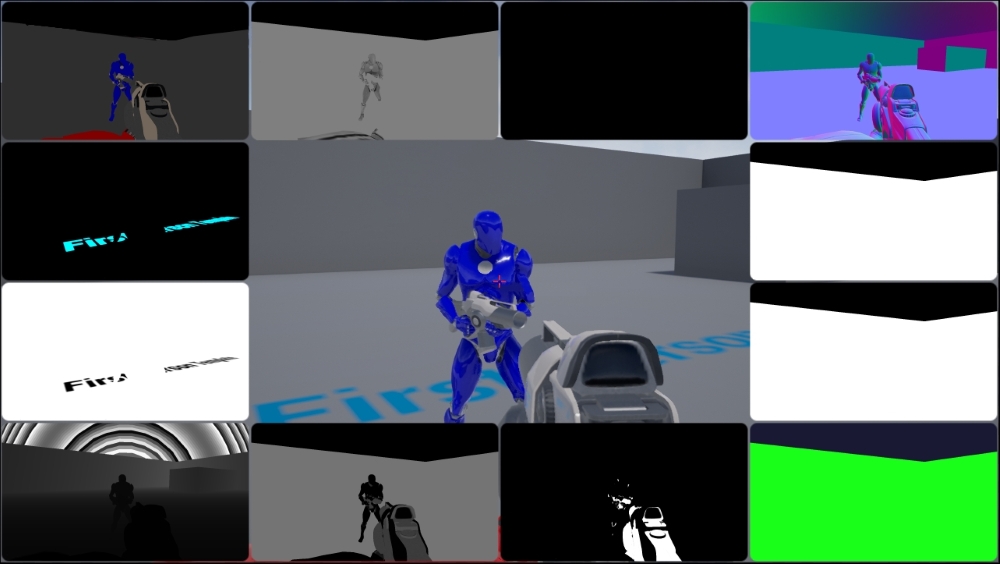
First off, run the project again from within the editor, then use the console command ShowFlag.VisualizeBuffer. This will add several new buffer views to your current viewport, each with their own name. This is a great way to dissect the rendering scene within your project.
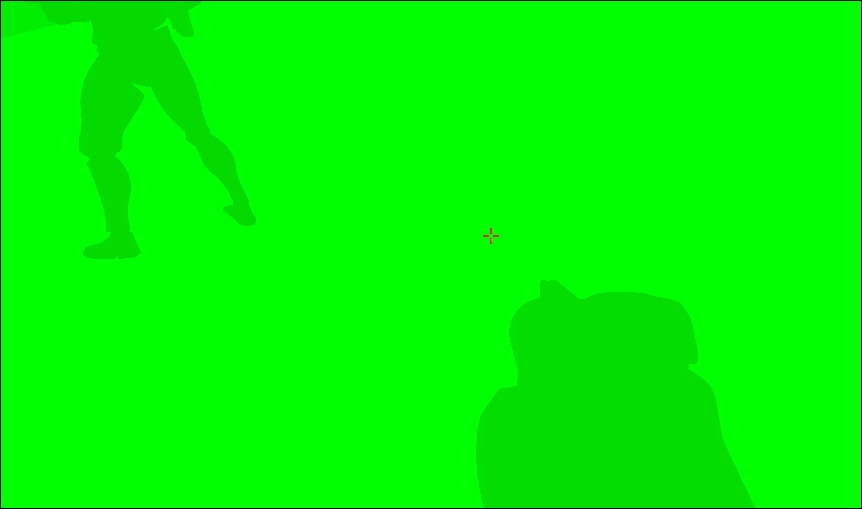
Another great command is ShowFlag.ShaderComplexity. To see if any particle effects or materials within the scene are costing too much. Each pixel will be colored from green to red (then to white), which will represent the cost of that particular pixel. Our current project has very cheap materials, so, when activated, we simply see the following:
I would strongly encourage you to explore each of these visualization options so you may learn what each do. The profiling link above also describes some of the uses of this visualization tool!
Ok, now we are done with this NS project! Great job on working through all of that networking code. This marks the last piece of learning in this book. Obviously all of the projects we have worked on are far from being commercial game titles, and could all be taken to greater heights! You could add different types of obstacles to Barrel Hopper, you could make different powerups and terrain types for Bounty Dash. For BossMode and NS you could expand on what we have already done and create fully fledged game prototypes. You could even combine the two for some co-op boss action! Now, let's have a quick look at what we have learnt!