
Chapter 2. Getting Started with the Visual Studio 2012 IDE
In This Chapter
• What’s New in Visual Studio 2012
• Working with Projects and Solutions
• Browsing the Visual Basic and .NET Documentation
You develop Visual Basic applications using the Visual Studio 2012 Integrated Development Environment (IDE), which is the place where you will spend most of your developer life. Before diving deep into the Visual Basic language, you need to know what instruments you need to develop applications. Although the Visual Studio IDE is a complex environment, this chapter provides you with an overview of the most common tasks you will perform from within Visual Studio 2012 and the most important tools you will utilize so that you can feel at home within the IDE. You get an introduction to some of the new features introduced by the new version of the development environment, which can provide the basis for the rest of the book. You also learn about other advanced IDE features in the last part of the book.
What’s New in Visual Studio 2012
The Visual Studio 2012 IDE retakes the infrastructure that was first introduced by its predecessor, which is written in managed code and in which several parts are based on the Windows Presentation Foundation framework, such as the code editor, menus, and floating windows. On the other hand, Visual Studio 2012 has a completely different look, which is now based on the Microsoft Design Style, with a simplified approach to commands and tools via a flattened user interface in which there are only a few colors.
What is the Microsoft Design Style?
The Microsoft Design Style is a design language for user interfaces that Microsoft started to introduce with the first version of Windows Phone; it is also one of the most important characteristics of Windows 8. This design language relies on the principles of abstraction, simplicity, and geometric shapes. Its goal is avoiding complex and overcolored user interfaces in favor of simple drawings. For example, it is common in the Microsoft Design Style to find monochromatic shapes rather than drawings with millions of colors that can be confusing. After its adoption in Windows Phone and Windows 8, Microsoft is bringing the new design style into a number of other programs. Visual Studio 2012 is an example of how the layout of a powerful and complex desktop application can be simplified by following some of the Microsoft Design Style principles. You can find a more detailed explanation of such principles at: http://goo.gl/uqA5V.
The goal is helping the developer focus on writing code or on designing the application, not on the development environment. So, the environment now has fewer colors than in the previous versions, but commands are still recognizable via familiar icons; parts of the IDE that you interact the most with (typically the code editor and designers) are still rich with helpful colorizations. Although this innovation is important, you will still feel at home with the new version. This is because the instrumentation is located and behaves the same as in the past. This chapter gives you an overview of the most common tools you need for developing your Visual Basic applications. (Deeper details on advanced IDE features are provided starting from Chapter 53, “Advanced IDE Features.”)
Status Bar and Start Page
When you first run Visual Studio 2012, you notice a new layout and the Start Page, as shown in Figure 2.1.
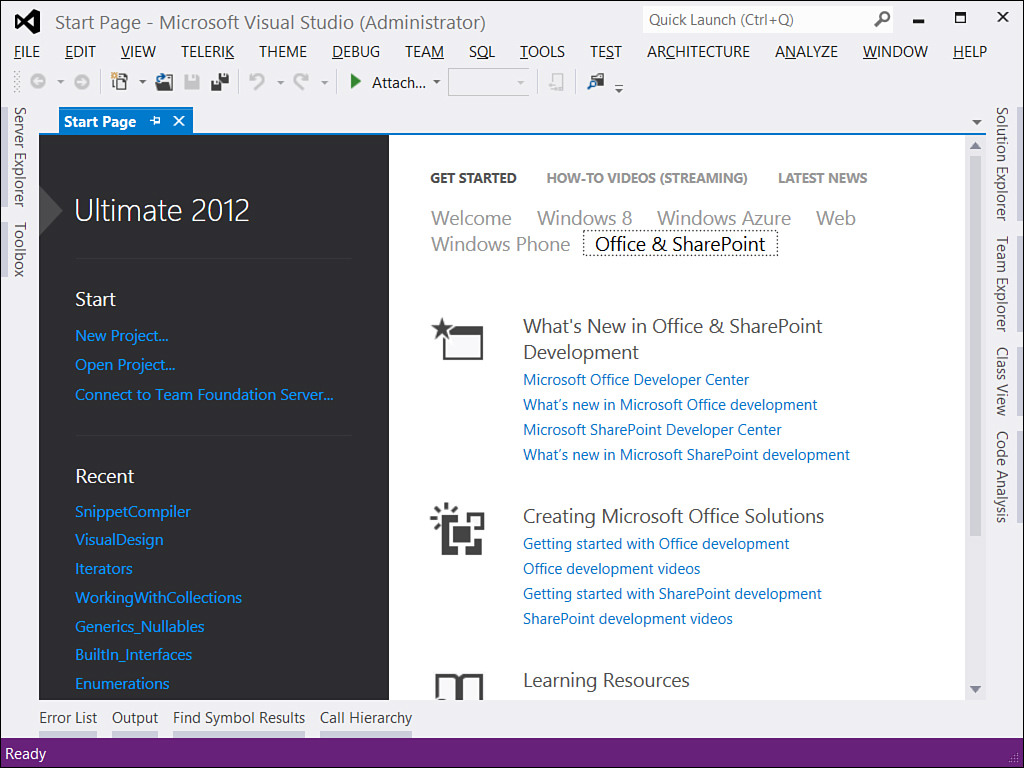
Figure 2.1. The Start Page in Visual Studio 2012 and the new look.
You can immediately notice the new look of Visual Studio 2012 based on Microsoft Design Style. The colored status bar is new in Visual Studio 2012, and its color changes according to the particular task Visual Studio is running. Following is a list of possible colors for the status bar (see Figure 2.2 for a graphical representation):
• Violet—This is the color for the status bar when Visual Studio is ready (for example, at startup).
• Light blue—This is the color for the status bar at development time, which means coding, designing the user interface, or any other task you run before compiling the code and running the application.
• Blue—This is the color for the status bar when Visual Studio 2012 is building the solution and compiling the code.
• Orange—This is the color for the status bar when you are running the application in debugging mode (that is, by pressing F5).
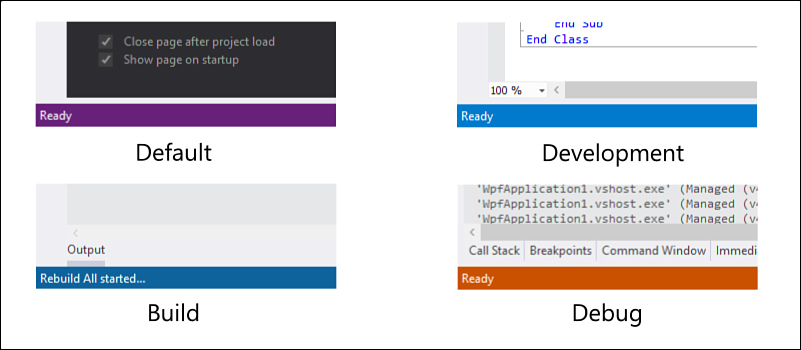
Figure 2.2. The status bar colors and related moments.
Themes for Visual Studio 2012
Visual Studio 2012 ships with two themes, Light and Dark. Light is the default setting and is also the one that is used in this book. The Dark theme reproduces the look of Microsoft Expression Blend and is based on the black color and dark tones. You can change the theme by going to Tools, Options and then selecting a different theme in the Color Theme drop-down box in the Environment tab. At the time this chapter is being written, there are no additional themes, but you can download a nice extension called Visual Studio 2012 Color Theme Editor, available at: http://visualstudiogallery.msdn.microsoft.com/366ad100-0003-4c9a-81a8-337d4e7ace05. This extension provides a number of ready-to-use themes and allows creating custom ones.
The Start Page is a central point in the IDE. First, it offers a better organization of the most common tasks, based on tabs. Tabs are located on the right side of the screen and enable access to specific contents. On the left side of the screen you can instead find links for creating new projects and opening existing projects, as well as the list of recently opened projects. You can easily remove recent projects by right-clicking the project name and then selecting the deletion command. It is worth mentioning that the Start Page relies on the Windows Presentation Foundation technology and is completely written in XAML code. This means that it can be customized according to your needs. Customizing the Start Page is beyond the scope of this chapter, whereas a deeper discussion on the default settings is absolutely necessary. The two default tabs are Get Started and Latest News. The following paragraphs discuss them in detail.
Get Started Tab
The Get Started tab (refer to Figure 2.1) offers links to important resources, such as MSDN Walkthroughs (which are step-by-step tutorials on specific topics related to Visual Studio 2012); community and learning resources, and extensions for the IDE; such as custom add-ins or third-party components. (This topic is discussed later in the book.) This tab is divided into subcategories, each related to a specific development area such as Windows 8, Web, and Windows Azure. When you click each subcategory, you access a number of links to resources for learning about the selected area. The Get Started tab’s purpose is to offer links to useful resources about the development environment and to new and existing .NET technologies.
The Latest News Tab
As in its predecessors, Visual Studio 2012 can also show a list of news based on RSS feeds so that you can stay up-to-date with your favorite news channels. Now the list appears in the Latest News tab, as shown in Figure 2.3.
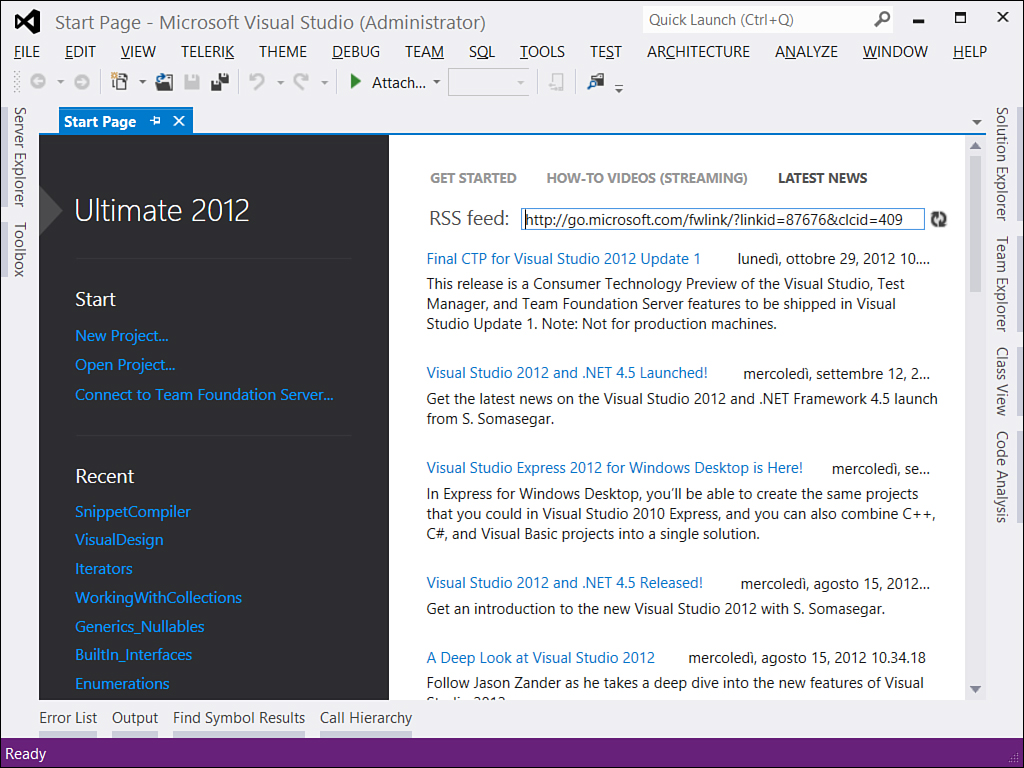
Figure 2.3. The Latest News tab shows updated news from the specified RSS channel.
By default, the news channel is an RSS feed pointing to the MSDN developer portal, but you can replace it with one of your favorites. To accomplish this, you have the following alternatives:
• Open the Latest News tab and replace the default link in the RSS feed field with a valid XML feed link (this is the easiest way).
• Open the Options window (for example, by clicking the Settings link in the Visual Studio tab), and then select the Startup item. In the text box named Start Page news channel (see Figure 2.4), you can insert your favorite link. Just be sure you are writing a valid XML feed link.
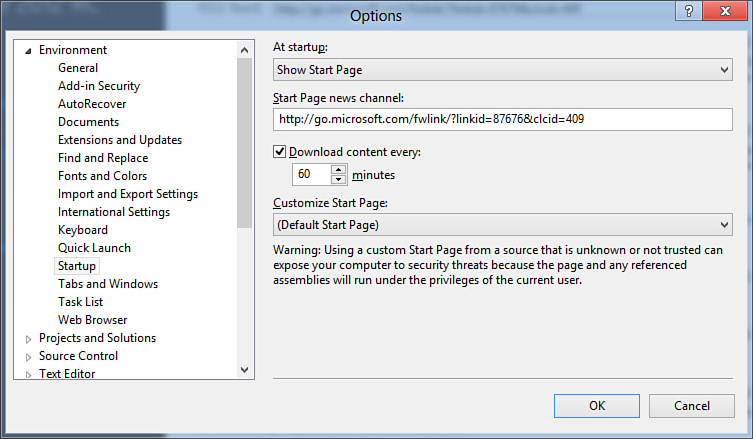
Figure 2.4. The Options window enables customizing the RSS Feeds news channel.
If you want to stay up-to-date with Visual Basic news, consider replacing the default news channel with the Visual Basic page of the Visual Studio Developer Center, which is at the following: http://sxp.microsoft.com/feeds/3.0/msdntn/VB_featured_resources. After this brief overview of the Start Page, we can begin discussing the tooling that you use for creating Visual Basic projects within Visual Studio 2012.
Working with Projects and Solutions
Each time you want to develop an application, you create a project. A project is a collection of files, such as code files, resources, data, and every kind of file you need to build your final assembly. A Visual Basic project is represented by a .Vbproj file, which is an Extensible Markup Language (XML) file containing all the information required by Visual Studio to manage files that constitute your project. Projects are organized into solutions. A solution is basically a container for projects. In fact, solutions can contain infinite projects of different kinds, such as Visual Basic projects, projects produced with programming languages other than Visual Basic, class libraries, projects for Windows client applications, Windows Communication Foundation services, and so on. In other words, a solution can include each kind of project you can create with Visual Studio 2012. Solutions also can contain external files, such as documents or help files, and are represented by a .Sln file that has an XML structure and stores information required to manage all the projects contained in the solution. Visual Studio 2012 can also open solutions created with previous versions of the IDE.
Project Upgrades and “Round-Tripping”
You can upgrade previous versions of your solutions by simply opening them in Visual Studio 2012. The new version of the IDE introduces the so-called project round-tripping, which means that solutions created with Visual Studio 2010 with Service Pack 1 can be opened in Visual Studio 2012 with no upgrades; then you can open the same solution back in Visual Studio 2010 with SP 1. For solutions created with other versions, the Upgrade Wizard can guide you through the upgrade process in a few steps. There are some exceptions to project round-tripping, which you can read in the specific MSDN page: http://msdn.microsoft.com/en-us/library/hh266747(v=vs.110).aspx.
Typically you manage your projects and solutions using the Solution Explorer window discussed later in this chapter. We now focus on the creation of Visual Basic 2012 projects.
Creating Visual Basic Projects
Creating a new Visual Basic project is a simple task. You can click either the File, New Project command or the New Project link from the Start Page. In both cases, Visual Studio shows the New Project window, which you can see in Figure 2.5.
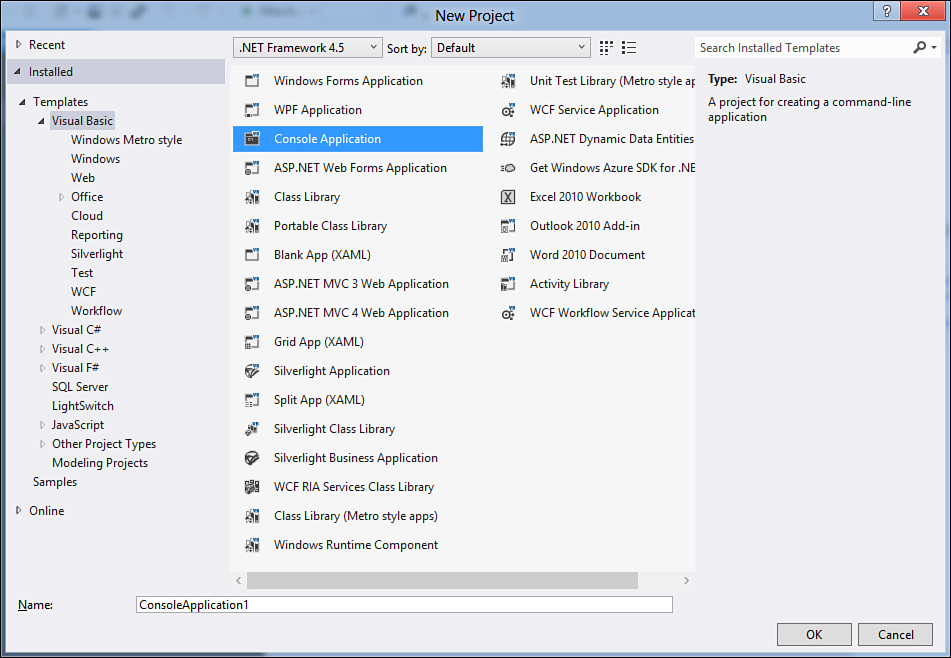
Figure 2.5. The New Project window for Visual Basic.
As you can see, the look of the New Project window is quite different from previous versions of Visual Studio and still retakes the Windows 8 style. To understand what kind of Visual Basic applications you can create, you simply need to select the Visual Basic node on the left side of the window. After you click the node, you see a lot of different kinds of applications you can create with Visual Basic 2012, such as Windows applications, web applications, Office System customizations, Silverlight applications, Windows Communication Foundation Services, the new Windows 8 Store Apps for Windows 8, and so on.
Note About Available Project Templates
The list of installed project templates can vary depending on either the Visual Studio 2012 edition or additional items installed later (for example, from the Visual Studio Gallery).
Each kind of application is represented by a specific project template, which provides a skeleton of a project for that particular kind of application, including all the references or the basic code files required. For example, the WPF Application project template provides a skeleton of a project for creating a Windows application using the Windows Presentation Foundation technology, therefore including references to the WindowsBase.dll assembly, specific Imports directives, and WPF objects represented by the appropriate code files. Moreover, Visual Studio will automatically enable the WPF designer. Notice the detailed description for each template on the right side of the window every time you select a particular template.
Note
In the second part of this book you find several kinds of applications you can build with Visual Basic 2012. For this reason, a full description of each project template will be provided in the proper chapters. At the moment, the description provided by Visual Studio for project templates is sufficient. Also consider that in this first part of the book the Console Application project template is used because it is the most appropriate for learning purposes.
When you create a new project, Visual Studio usually creates a solution containing that project. If you plan to add other projects to the solution, it can be a good idea to create a directory for the solution. This allows for a better organization of your projects, because one directory can contain the solution file and this directory can then contain subdirectories, each of them related to a specific project. To accomplish this, ensure that the Create Directory for Solution check box is selected. The New Project window also offers some interesting features: the .NET Framework multi-targeting, the ability of searching through templates, the ability of managing templates, and finding samples on the Internet. We now discuss each of these features.
Multi-targeting
Like in Visual Studio 2010, in Visual Studio 2012 you can choose which version of the .NET Framework your application targets. This can be useful if you plan to develop applications with high compatibility levels and without new language features but still want to take advantage of the new features of the IDE. You can choose one of the following:
• .NET Framework 4.5 (proposed by default)
• .NET Framework 4.0
• .NET Framework 3.5
• .NET Framework 3.0
• .NET Framework 2.0
To accomplish this, just select the appropriate version from the combo box at the top of the window, as shown in Figure 2.6.
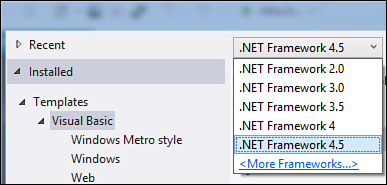
Figure 2.6. Choosing the .NET Framework version for your application.
Note
Remember that, depending on the version of the .NET Framework you choose, you might not be able to use some libraries or technologies. For example, if you choose .NET Framework 3.0 as the target version, you cannot use LINQ, which is instead exposed by .NET Framework 3.5 and higher. So keep in mind these limitations when developing your applications on previous Framework versions.
Accessing Recent and Online Templates
Visual Studio 2012 provides the capability to access the most recently used templates and install additional templates from the Internet. You can easily access the most recently used project templates by clicking the Recent Templates item on the left side of the New Project window. In this way, you get a list of the recently used project templates in case you still need them (see Figure 2.7). You can also find additional online templates and install them to the local system. To accomplish this, simply click the Online Templates item in the New Project window. Visual Studio checks for the availability of online templates and shows a list of all the available templates (see Figure 2.8).
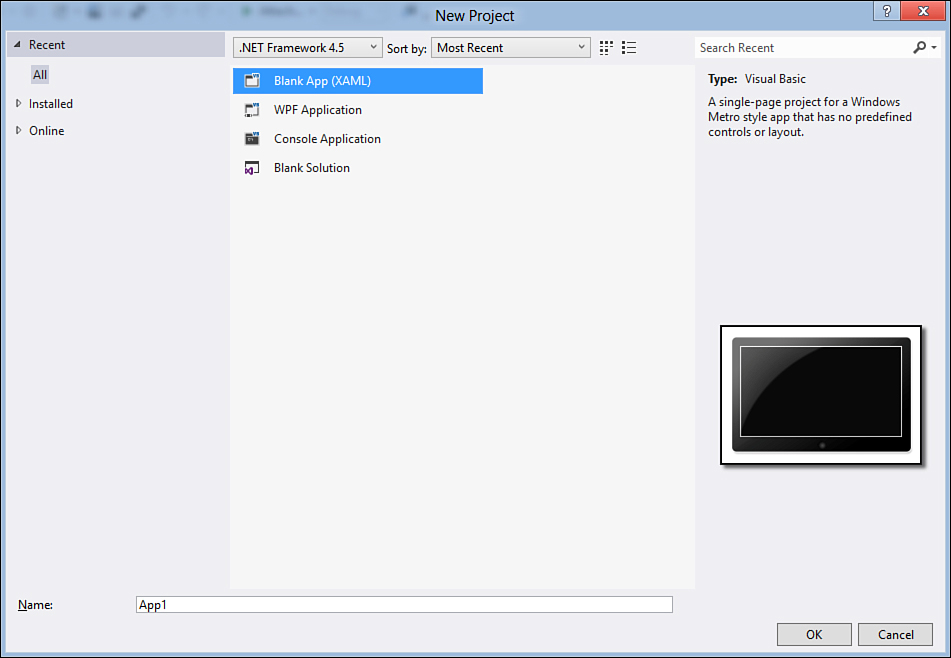
Figure 2.7. Accessing the most recently used projects templates.
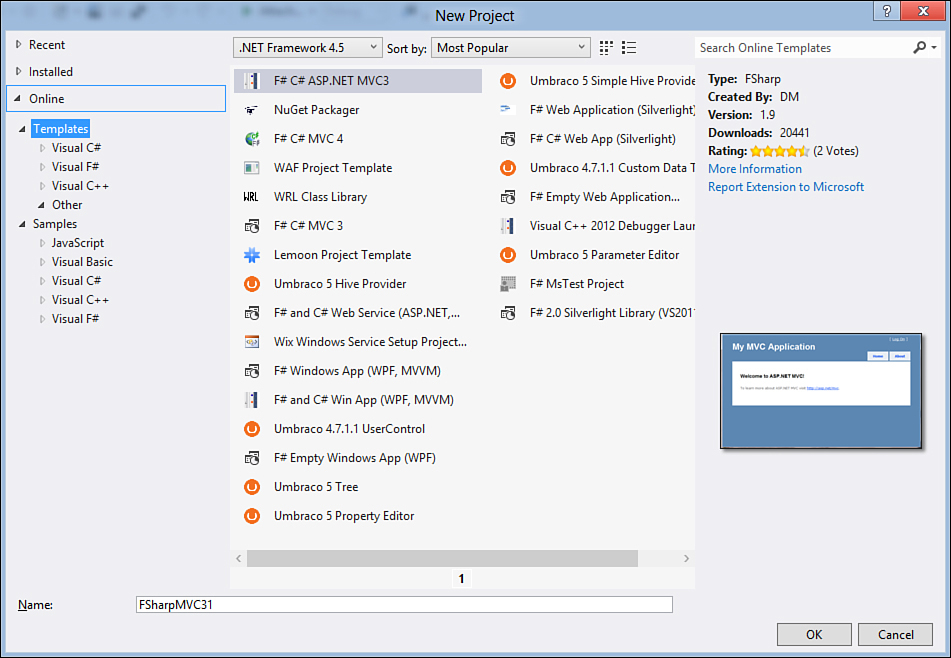
Figure 2.8. Additional online templates you can add to Visual Studio 2012.
As you can see, Visual Studio is listing all the online templates for both Visual Basic and Visual C#, showing a description of the template, information about the author, and a small picture with ratings when available. To download and install a template, simply double-click its name. After a few seconds you will be prompted to agree to the installation. You will be warned in the case that the new extension for Visual Studio does not contain a digital signature. If you trust the publisher and want to continue, click Install. After a few seconds, you will see the newly installed project templates available among the other ones.
As in the previous versions of Visual Studio, you can still export projects as reusable project templates. We discuss this feature later in Chapter 53, “Advanced IDE Features.”
Searching for Installed Templates
Visual Studio 2012 provides lots of default project templates, and as you saw before, you have the ability of adding your own custom ones. Therefore, finding the necessary template at a certain moment can be difficult. Because of this, the New Project window provides a search box that is located in the upper-right corner of the window (see Figure 2.9). Just begin typing the name of the project template you are looking for, and the New Project window shows all the project templates that match your choice. Each time you type a character, the window updates showing the results matching your search string. As you can see in Figure 2.9, Visual Studio is showing all the project templates whose names match the wor search string.
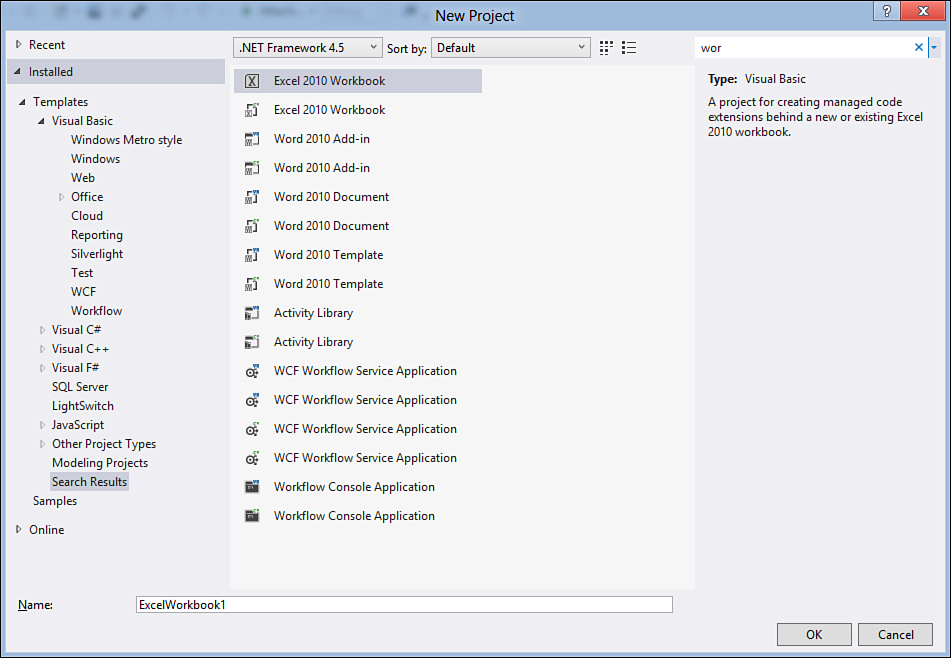
Figure 2.9. Searching for installed project templates using the new search feature.
Note
Remember that the search functionality can retrieve all project templates related to your search string. This means that the search result can contain not only Visual Basic projects but also every template name matching your criteria (for example, Visual C#, Visual F#, and so on).
Finding Code Samples on the Internet
One of the great new features of Visual Studio 2012 is the ability to search for sample code on the Internet directly from the New Project dialog box. Visual Studio performs this search inside the MSDN Code Gallery (http://code.msdn.microsoft.com), a website where developers can publish sample code they want to share with others. To find code samples, click the Samples item at the bottom of the list of templates in the New Project dialog box (see Figure 2.5). After you select this item, you will be able to browse the Code Gallery from within the dialog box. For example, if you search for a specified language, you will then be able to discover samples of each language based on technologies (such as Windows, Web, Cloud, Windows Phone, and so on). For each of these categories, you will find additional subcategories where samples are divided by framework; for instance, Windows development samples are divided into WPF, Windows Forms, Windows Runtime, and so on. Figure 2.10 shows how you can browse samples online from Visual Studio 2012.
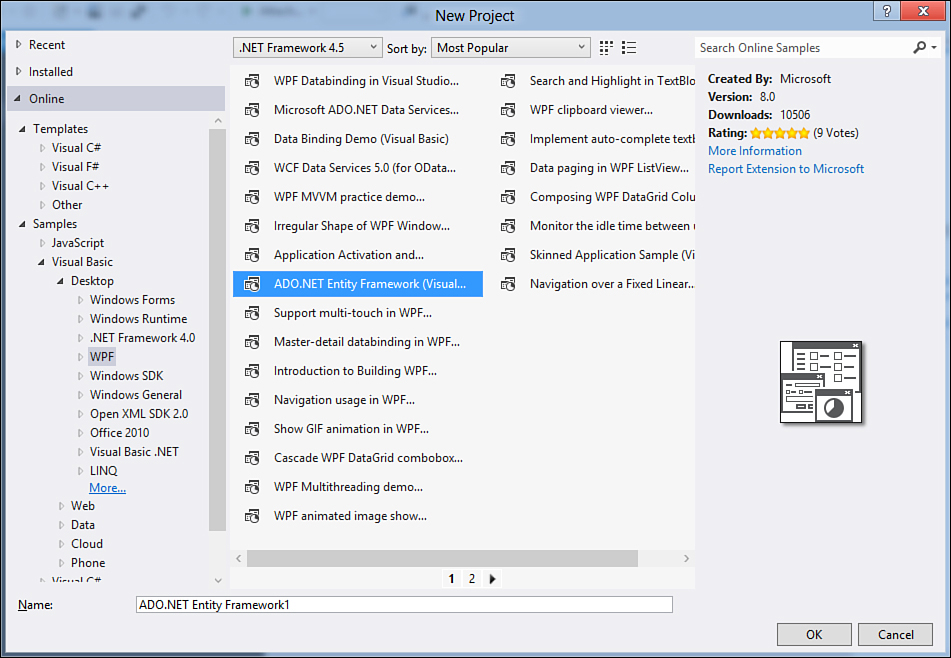
Figure 2.10. Browsing online code samples from Visual Studio 2012.
You select a sample from the list and then click OK or simply double-click the sample. Visual Studio 2012 will download the sample to your hard disk and will ask you to accept the license agreement that the developer who published the code added to the sample. After it’s downloaded, the sample is opened in Visual Studio 2012 under the form of a normal project. This is possible because, to upload a sample to the gallery, you must supply a full project (or an entire solution) to enable other developers to reuse your code with ease.
Creating Reusable Projects and Items Templates
As in the previous versions, in Visual Studio 2012 you can create your custom projects and items templates, exporting them to disk and making them available within the IDE. (This topic is discussed in Chapter 53.) Now that you have seen the main new features for project creation, you are ready to create your first Visual Basic project.
Creating Your First Visual Basic 2012 Project
This section shows how easily you can create a Visual Basic 2012 application. If you have experience with Visual Studio, you’ll notice the differences in the development environments between the new version and the previous ones. You can create a new project for the Console by first opening the New Project window and then selecting the Console Application project template.
Note
Until Part IV, “Data Access with ADO.NET and LINQ,” all code examples, listings, and code snippets are based on Console applications, so remember to create a Visual Basic project for the console when testing the code.
Name the new project MyFirst2012Program and then click OK (see Figure 2.11).
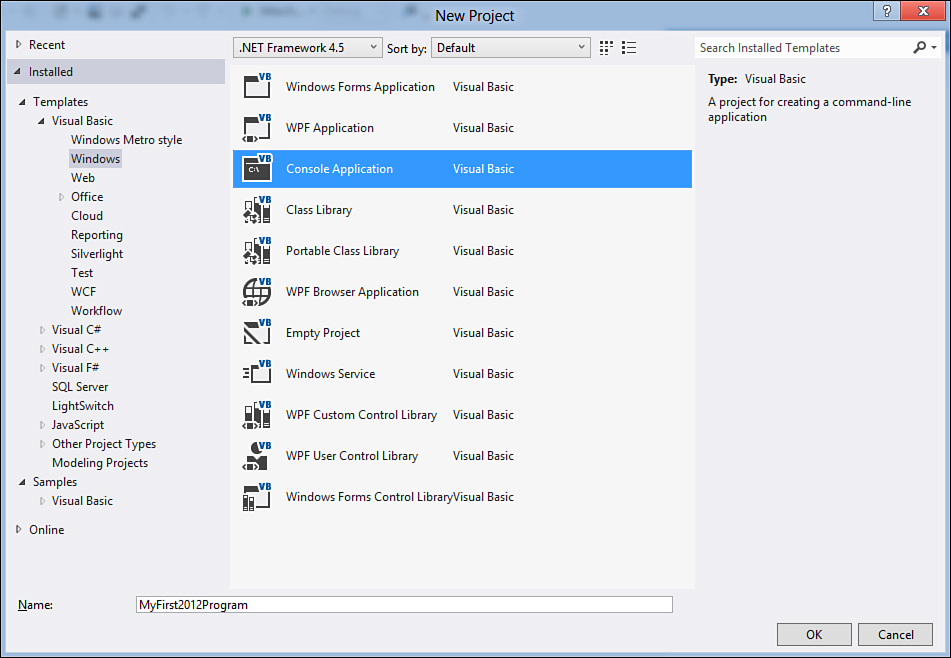
Figure 2.11. Creating your first VB 2012 application.
After a few seconds the new project is ready to be edited. Figure 2.12 shows the result of the project creation.
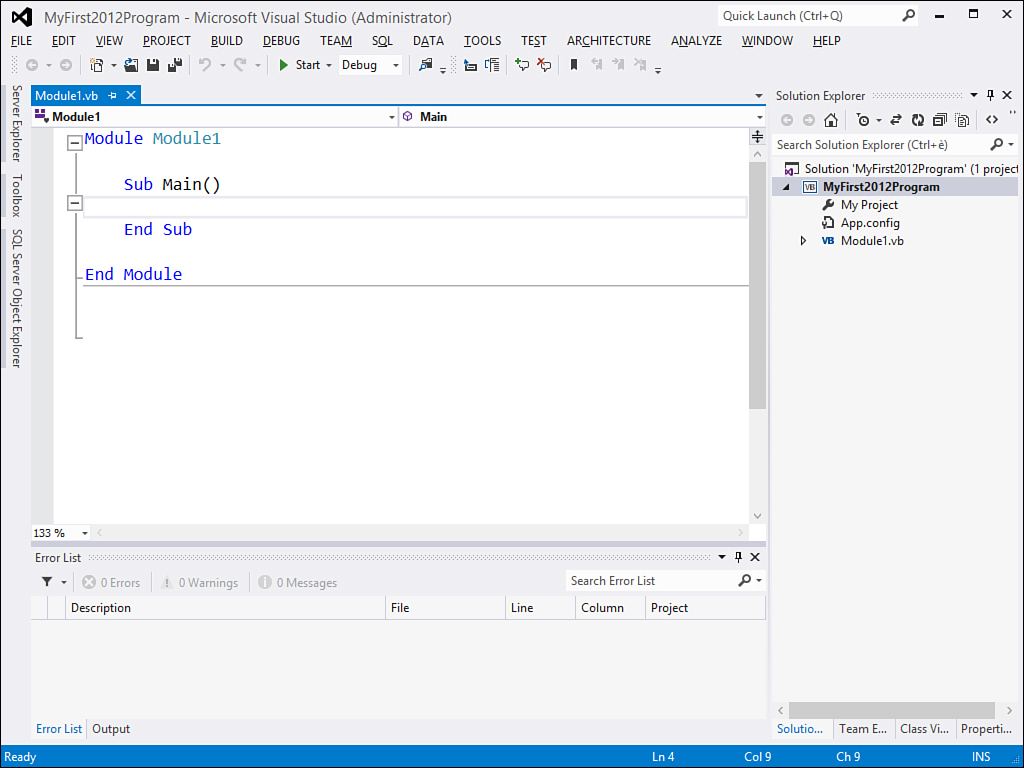
Figure 2.12. The creation of the first VB 2012 project.
As mentioned at the beginning of this chapter, the code editor and floating windows are based on Windows Presentation Foundation. You see the new Windows 8 look for the tooling, but this change does not modify your development experience. You should feel at home with the new version of the environment because you can still find tools as in the previous versions—maybe just with fewer colors. For example, you can access Solution Explorer, the Properties window, or the Error List exactly as you did before. An interesting feature in the code editor is that by pressing Ctrl and moving up and down the mouse wheel, you can zoom in and out with the code editor without the need to change the font settings each time the Visual Studio options changes. For our testing purposes, we could add a couple of lines of code to the Main method, which is the entry point for a Console application. Listing 2.1 shows the complete code for creating a VB 2012 application.
Listing 2.1. Creating the First VB 2012 Application
Module Module1
Sub Main()
Console.WriteLine("Hello Visual Basic 2012!")
Console.ReadLine()
End Sub
End Module
What is a Console?
In a Console application, the System.Console class is the main object for working with the Windows console. Such a class provides methods for reading and writing from and to the Console and for performing operations against the Console itself.
The code simply shows a message in the Console window and waits for the user to press a key. This is obviously a basic application, but you need it as the base for understanding other topics in this chapter.
Finding Visual Basic Projects
As in the previous versions, Visual Studio 2012 stores by default its information in a user-level folder called Visual Studio 2012 that resides inside the My Documents folder. Here you can find settings, add-ins, code snippets, and projects. For example, if you run Windows Vista, Windows 7, or Windows 8, your projects should be located in C:UsersUserNameDocumentsVisual Studio 2012Projects, in which UserName stands for the user logged in to Windows. Of course, you can change the default projects directory by opening the Options window (Tools, Options command), selecting the Projects and Solutions item on the left side, and replacing the value for the Projects location text box.
Working with the Code Editor
The code editor, together with designers, is the place where you spend most of your developer life in Visual Studio, so knowing how to get the best out of it is very important. This is what I explain throughout the whole book. In this chapter you see just a few of the code editor features because the other ones are related to specific topics discussed later. We now focus on the zoom functionality in the code editor and IntelliSense.
Zooming the Code
You can zoom the code editor in and out by simply pressing the Ctrl key and moving the mouse wheel up and down. This is a useful feature, particularly if you are a presenter of technical speeches because you can enlarge the code without modifying Visual Studio settings in the Options window. Figure 2.13 shows an example of this feature; notice how the font for the code is greater than the default settings and how the zoom percentage is visible at the bottom-left corner.
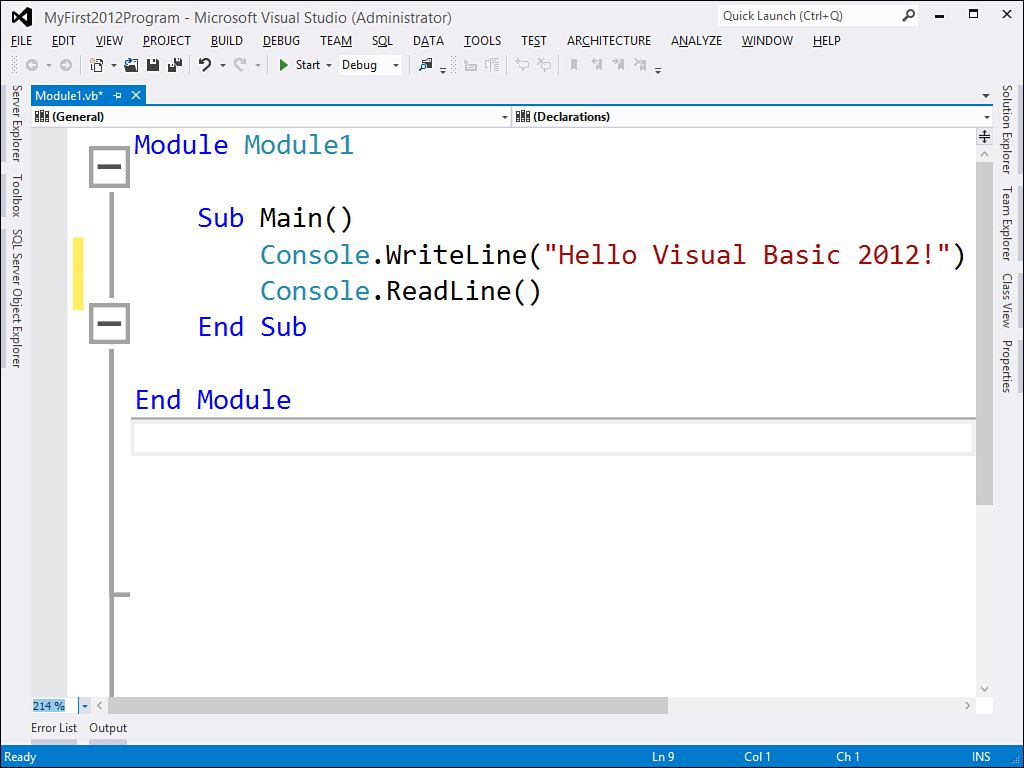
Figure 2.13. The code editor zoom feature enables real-time enlarging and reducing of the font size of the code without changing settings in Visual Studio.
If you already used this feature in Visual Studio 2010, you might remember how the scroll bar on the right also changed its size according to the zoom. This has been fixed in Visual Studio 2012; the bar size is always the same and independent from the zoom.
IntelliSense Technology
IntelliSense is one of the most important technologies in the coding experience with Visual Studio. IntelliSense is represented by a pop-up window that appears in the code editor each time you begin typing a keyword or an identifier and shows options for auto-completing words. Figure 2.14 shows IntelliSense in action when adding a new instruction in code.
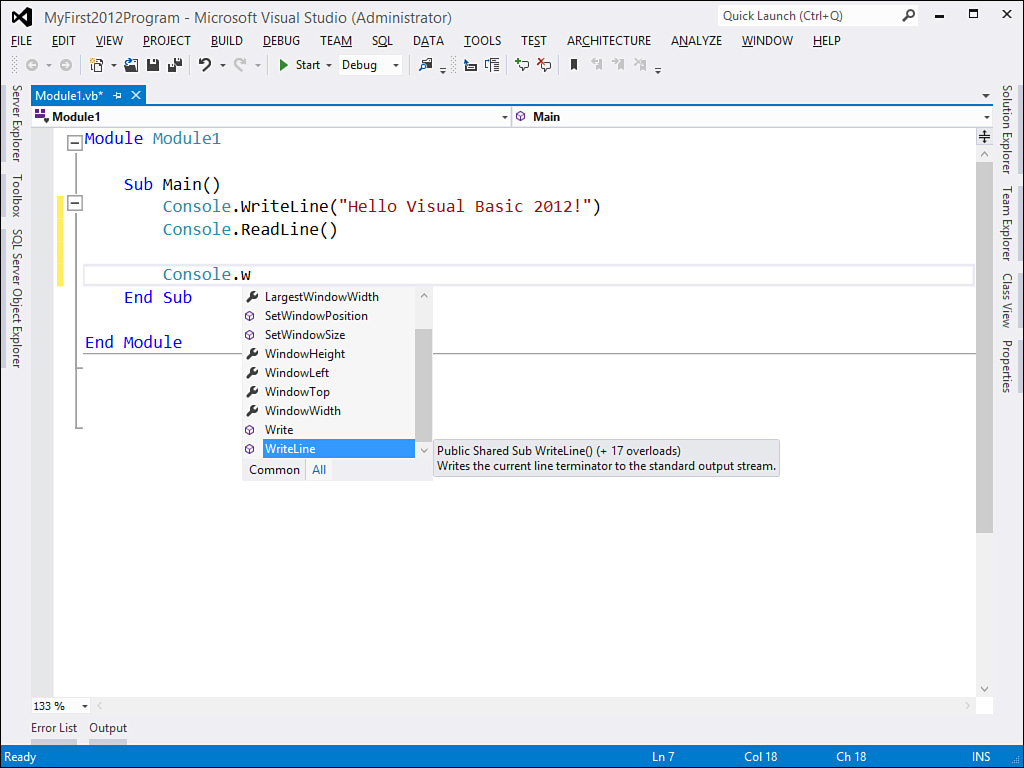
Figure 2.14. IntelliSense in action.
To auto-complete your code typing, you have the following alternatives:
• Tab—Pressing this auto-completes your words and enables you to write other code.
• Space—Pressing this auto-completes your words, adding a blank space at the end of the added identifier and enabling you to write other code.
• Enter—Pressing this auto-completes your words, adding a couple of parentheses at the end of the completed identifier and positioning the cursor on a new line. Use this technique when you need to invoke a method that does not require arguments.
• Left parenthesis—Pressing this auto-completes your words, adding a left parenthesis at the end of the completed identifier and waiting for you to supply arguments.
• Ctrl + Space—Pressing this brings up the full IntelliSense listing.
IntelliSense has been improved since Visual Studio 2008. In fact, it is activated just when typing one character and is also active versus Visual Basic reserved words. Moreover, it remembers the last member you supplied to an object if you invoke that particular object more than once. For example, if you use IntelliSense to provide the WriteLine method to the Console object as follows:
Console.WriteLine()
and then try to invoke IntelliSense on the Console object again, it proposes as the first alternative of the WriteLine method you supplied the first time. IntelliSense is important because it lets you write code more quickly and provides suggestions on which member to add to your code.
Working with Tool Windows
As in the previous versions, lots of the Visual Studio tools are provided via tool windows. Tool windows are floating windows that can be docked to the IDE interface and are responsible for a particular task. As a general rule, in the View menu you can find the tool windows provided by Visual Studio 2012. Exceptions to this rule are the Test tool windows and the analysis tool windows that can be invoked from the Test and Analyze menus, respectively, and tool windows specific for debugging, available in the Debug menu (see Chapter 5, “Debugging Visual Basic 2012 Applications”). In this book we utilize several tool windows, and in this chapter you get an overview of the most frequently used ones. In particular, we now focus on Solution Explorer, Error List, Properties, and Output windows. This is because these are the tool windows you will use in each of your projects. Other tool windows will be analyzed when applied to specific topics. To dock a tool window to the desired position in the IDE, just move the window onto the most appropriate arrow in the graphical cross that you see on the IDE and then release. Figure 2.15 represents this situation.
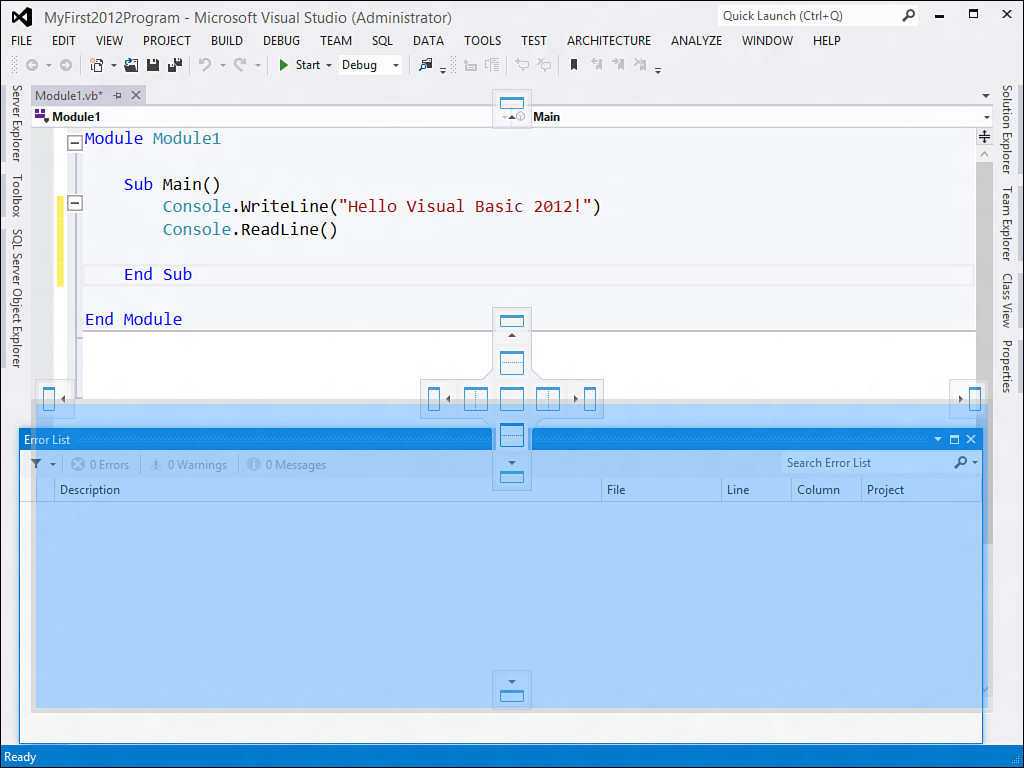
Figure 2.15. Docking a floating tool window to the IDE’s interface.
Visual Studio 2012 automatically positions some tool windows in specific places of the IDE, but you can rearrange tool windows as much as you like. We now discuss the previously mentioned tool windows.
The Solution Explorer Window
Solution Explorer is a special tool window that enables managing solutions, projects, and files in the projects or solution. It provides a complete view of which files compose your projects and enables adding or removing files and organizing files into subfolders. Figure 2.16 shows how a WPF project is represented inside Solution Explorer.
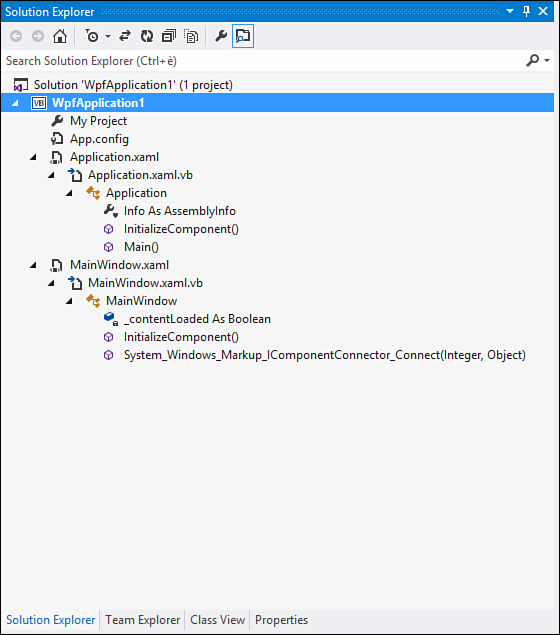
Figure 2.16. An example of the Solution Explorer tool window.
As you can see, at the root level there is the project. Nested are code files, subfolders containing pictures, data, and documents. You can also get a list of all the references in the project. You use Solution Explorer for adding and managing items in your projects as well as getting a representation of which files constitute the project itself. By default, Solution Explorer shows only the items that compose the project. If you need a complete view of references and auto-generated code files, you need to click the Show All Files button located on the upper-left portion of the window. Solution Explorer has been deeply revisited in Visual Studio 2012 and, if you had a chance of using the Power Tools extension for Visual Studio 2010, you might notice how it retakes most of the features of a tool window called Solution Navigator. Solution Explorer now shows the list of types and members that a code file defines, by expanding the name of a code file. For instance, you can see in Figure 2.16 how the MainWindow.xaml.vb code file defines a class called MainWindow, which exposes a field called _contentLoaded of type Boolean, and two methods, InitializeComponent and System_Windows_Markup_IComponentConnector_Connect. By double-clicking a member you will be automatically redirected to its definition in the code file. The window also shows arguments and their type. This is useful when you have hundreds of files and just need to know which types are defined within a file without searching inside all the others. Also, Solution Explorer has a useful search box in which you can type a search key and the IDE will search for all the items in the solution that contain the specified word(s). Another interesting feature of the new Solution Explorer is that you can discover the following behaviors for members defined in code:
• Calls that the member makes
• Members that are calling the selected member
• Members that are using the selected member
You can simply right-click a member defined inside a code file and then select the desired command. At that point, Solution Explorer will show the list of members that are invoked by, are calling, or are using the selected member. To go back to the full list you simply use the Back button in the toolbar (see Figure 2.16). The new Solution Explorer also provides interaction with Team Foundation Server and the possibility of generating visual representation of the object graph for the selected node. To manage your project’s items, you just need to right-click the project name and select the most appropriate command from the pop-up menu that appears. Figure 2.17 shows this pop-up menu.
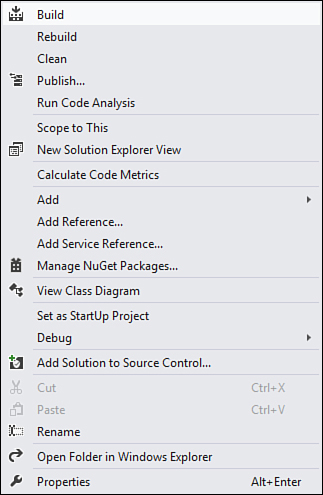
Figure 2.17. Solution items can be managed in Solution Explorer using the pop-up menu.
As you can see from Figure 2.17, the pop-up menu shows several tasks you can perform on your projects or solutions. You can easily add new items by selecting the Add command; you also can perform tasks against specific files if you right-click items in the solution instead of the project’s name.
Note About Adding Items to Projects
In this book you will be asked lots of times to add new items to a project or to a solution, so you should keep in mind that this can be accomplished by right-clicking the project name in Solution Explorer and then clicking the Add, New Item command from the pop-up menu.
You can easily find Solution Explorer by pressing Ctrl+Alt+L if it is not available yet in the IDE. The enhancements that Visual Studio 2012 brings to Solution Explorer make this tool window a very important productivity tool, rather than a simple project browser.
The Error List Window
The Error List tool window can show a list of all messages, including warnings and information, which are generated by Visual Studio during the development of your applications. Figure 2.18 shows the Error List tool window.
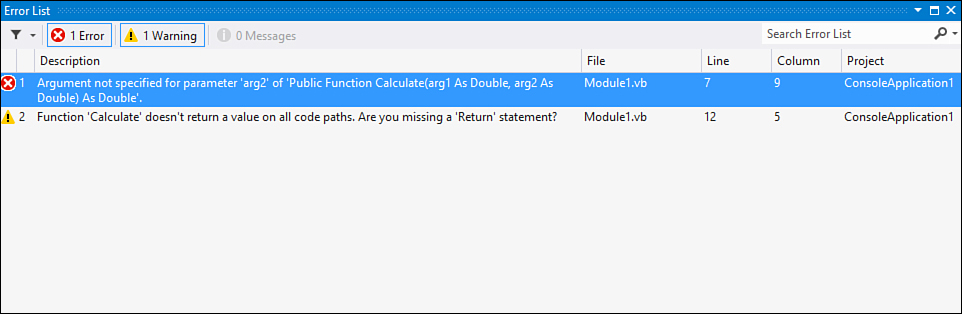
Figure 2.18. The Error List tool window.
Typically the Error List window can show three kinds of messages:
• Error messages
• Warning messages
• Information messages
Error messages are related to errors that prevent your application from running—for example, if your code cannot compile successfully. This can include any kind of problems that Visual Studio or the background compiler encounter during the development process, such as attempting to use an object that has not been declared, corrupted auto-generated Windows Presentation Foundation files that must be edited in the Visual Studio designer, or corrupted Visual Studio files in situations that throw error messages you can see in the Error List. Another kind of message is a warning. Warnings are related to situations that will not necessarily prevent your code from being successfully compiled or your application from running; in such cases warnings can be simply ignored. It’s good practice to try to solve the problems that caused these messages to be shown. For example, running the Code Analysis tool will throw warnings on code that is not compliant with Microsoft guidelines for writing code. This means that the application will probably work, but something in your code should be improved. In both error and warning messages, you can be redirected to the code that caused the message by double-clicking the message itself. You can also get some help about the message by right-clicking it and then selecting the Show Error Help command from the pop-up menu, or simply by pressing F1. Information messages are just to inform you about something. Usually information messages can be ignored with regard to the code, although they could be useful for understanding what the IDE wants to tell us. By default, the Error List shows the three kinds of messages together, but you could also choose to view only some of them—for example, error messages excluded and so on. To filter the Error List results, click the tab related to the kind of message you do not want to be shown. For instance, click the Messages tab if you want information messages to be excluded by the errors list. To include back information messages, click the same tab again. The Errors List can also be easily invoked by pressing Ctrl+, Ctrl+E.
The Properties Window
In the .NET development, everything has properties, which are the characteristics of a particular item. Classes can have properties; files can have properties; and so on. For example, the filename is a property of a file. You often need to set properties for your code, for .NET objects you use in your code, and for your files. To make things easier, Visual Studio provides a tool window named Properties window, which is a graphical tool for setting items’ properties. Figure 2.19 represents the Properties window showing properties for a button in Windows Presentation Foundation.
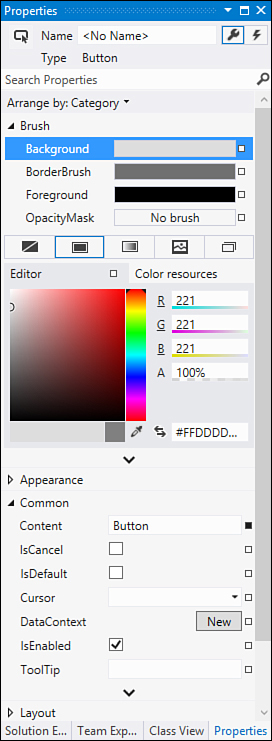
Figure 2.19. The Properties window.
We could define the Properties window’s structure as a two-column table, in which the left column specifies the property and the right column gets or sets the value for the property. Although you often need to set properties in code, the Properties window provides a graphical way to perform this assignment and can be particularly useful when designing the user interface or when you need to specify how a file must be packaged into the executable assembly. The Properties window can be easily invoked by pressing F4.
The Output Window
Visual Studio often recurs to external tools for performing some actions. For example, when compiling your projects, Visual Studio invokes the Visual Basic command-line compiler, so the IDE captures the output of the tools it utilizes and redirects the output to the Output window. The Output window’s purpose is to show results of actions that Visual Studio has to perform or that you require to be performed by Visual Studio. So, when you compile your projects, the Output window shows the results of the build process. Figure 2.20 shows the Output window containing the results of the build process of a Visual Basic project.
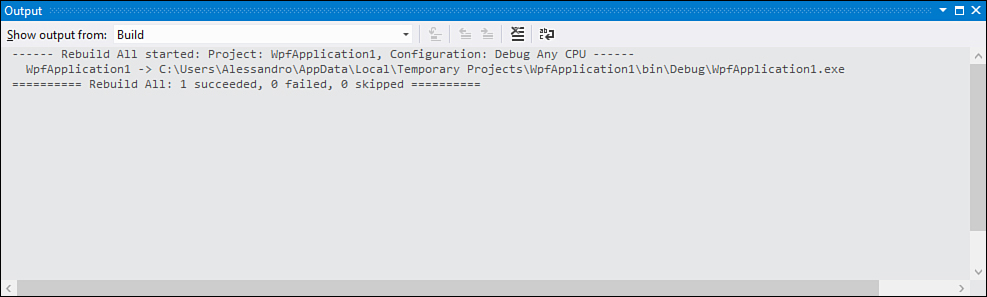
Figure 2.20. The Output window showing results of a build process.
The Output window is also interactive. To continue with the example of compiling a program, if the compiler throws any errors, these are shown in the Output window. You can click the Go to Next Message or Go to Previous Message button to navigate error messages. After you do this, the current error message is highlighted. Each time you move to another error message, you will be redirected to the code that caused the error. The Output window can capture the output not only of the compiler, but also of other tools Visual Studio needs to use, such as the debugger. By the way, you can get a list of the available outputs by clicking the Show Output From combo box. After this first look to the main tool windows, we can begin examining another important feature of the Visual Studio IDE for Visual Basic: the My Project window.
My Project
My Project is a special tool that enables developers to set project properties. My Project is a window that can be invoked by double-clicking the My Project item in Solution Explorer or by clicking the Project, Properties command (the menu item text also includes the current project name). Figure 2.21 shows how My Project looks regarding the sample application we previously created.
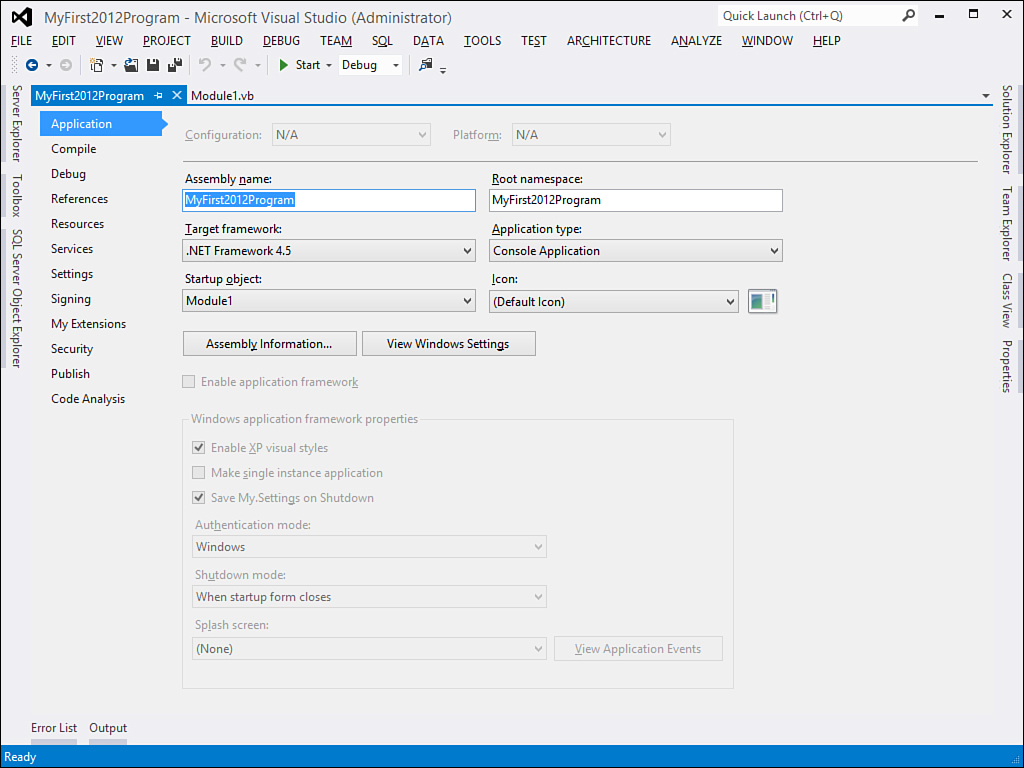
Figure 2.21. The My Project window.
My Project is organized in tabs; each tab represents a specific area of the project, such as application-level properties, external references, deployment options, compile options, debugging options, and many more. At the moment you don’t need to learn each tab of My Project because during the rest of the book we use it a lot, learning the meaning and purpose of each tab when appropriate. What you instead need now is to
• Understand what My Project is.
• Remember how you can open it.
• Learn the usage of the Application tab, which we will discuss first.
Understanding My Project is also important for another reason: It provides most of the infrastructure for the My namespace that will be discussed in Chapter 19, “The My Namespace.” Most of settings you can specify in My Project are then accessible by invoking My. In Chapter 3, “The Anatomy of a Visual Basic Project,” we describe the structure of My Project, so carefully read how it is composed.
Application Tab
Each application has some settings. Application settings can be the executable’s name, icon, or metadata that will be grabbed by the operating system, such as the program version, copyright information, and so on. The purpose of the Application tab in My Project is to provide the ability to edit these kinds of settings. The Application tab is shown by default when you first open My Project. Figure 2.21 shows the Application tab. Some settings are common to every kind of Visual Basic project, whereas other ones are related to specific project types. In this chapter you get an overview of the common settings, whereas specific ones will be discussed when required in the next chapters.
Assembly Name
The Assembly name field sets the name of the compiled assembly—that is, your executable. By default, Visual Studio assigns this setting based on the project name, but you can replace it as needed.
Root Namespace
This particular field sets the root-level namespace identifier. Namespaces will be discussed later in this book. You can think of the root namespace as the object that stores all that is implemented by your project. According to Microsoft specifications, the root namespace should be formed as follows: CompanyName.ProductName.Version. This convention is optimal when developing class libraries or components but might not be necessary when developing standalone executables. By default, Visual Studio sets the root namespace based on the project name.
Application Type
This represents the application type (for example, Console application, Class Library, Windows Forms application) and is automatically set by Visual Studio on the appropriate choice. To ensure you will avoid any problems, you should not change the default setting.
Icon
This field allows setting an icon for the executable file. You can browse the disk and select an existing .ico file as the executable icon.
Assigning an icon to the executable file will not automatically assign icons to Windows Forms windows or WPF windows when developing client applications. In such scenarios you need to explicitly assign icons for each window because the Icon item in the Application tab will just set the icon for the executable.
Startup Object
By setting the Startup Object field, you can specify which object will be executed first when running your application. For example, imagine you have a Windows Presentation Foundation application with more than one window. You might want to decide which window must be the application’s main window. With the Startup Object field, you can make this decision. Notice that the startup object changes based on the project type. For example, in a WPF application the startup object is a Window object, whereas in a Console Application the default startup object is a Module in which the Sub Main method is located. The name of the field also changes based on the project type. In a WPF application it is called Startup URI, whereas in a Console Application it is called Startup Object.
Changing the Startup Object
Please be careful when changing the Startup Object. A wrong choice could cause errors on your application and prevent it from running.
Assembly Information
By clicking the Assembly Information button, you get access to a new window called Assembly Information, as shown in Figure 2.22.
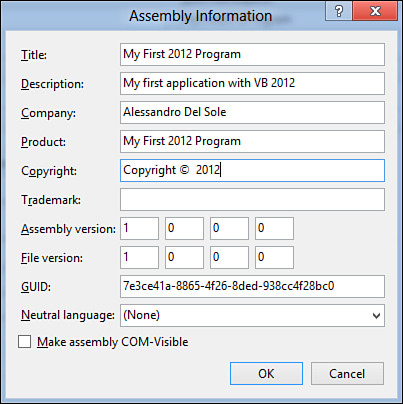
Figure 2.22. The Assembly Information window.
From this window you can specify several properties for your executable that will be visible both to the .NET Framework and to the Windows operating system. Table 2.1 explains each property.
Table 2.1. Assembly Information Explained

The Assembly Information tool is important because it enables you to specify settings that you want to be visible to your customers and other settings needed by the .NET Framework. Behind the scenes, all this information is translated into Visual Basic code, which is discussed more in Chapter 3.
View Windows Settings
Starting from Windows Vista, Microsoft introduced to the Windows operating system an important component, known as User Account Control (UAC). When enabled, this mechanism requires the user to explicitly grant elevated permissions to applications being run. Because of this and starting from Visual Studio 2008, you have the ability of specifying the permissions level your application will require for the UAC. For example, if your application needs to write to the Program Files folder (this is just an example and rarely a good idea), you need to ask for elevated permissions to the UAC. You can specify UAC settings for your application by clicking the View Windows Settings button. At this point Visual Studio generates a new XML manifest that will be packaged into your executable and that you can edit within the IDE. This file contains information for UAC settings and for specifying the operating systems that the application is designed to work for (see the supportedOS node). Listing 2.2 shows an excerpt of the default content of the manifest, related to the UAC settings.
Listing 2.2. The UAC Manifest Content
<?xml version="1.0" encoding="utf-8"?>
<asmv1:assembly manifestVersion="1.0" xmlns="urn:schemas-microsoft-com:asm.v1"
xmlns:asmv1="urn:schemas-microsoft-com:asm.v1" xmlns:asmv2="urn:schemas-microsoft-
com:asm.v2" xmlns:xsi="http://www.w3.org/2001/XMLSchema-instance">
<assemblyIdentity version="1.0.0.0" name="MyApplication.app"/>
<trustInfo xmlns="urn:schemas-microsoft-com:asm.v2">
<security>
<requestedPrivileges xmlns="urn:schemas-microsoft-com:asm.v3">
<!-- UAC Manifest Options
If you want to change the Windows User Account Control level replace the
requestedExecutionLevel node with one of the following.
<requestedExecutionLevel level="asInvoker" uiAccess="false" />
<requestedExecutionLevel level="requireAdministrator" uiAccess="false" />
<requestedExecutionLevel level="highestAvailable" uiAccess="false" />
Specifying requestedExecutionLevel node will
disable file and registry virtualization.
If you want to utilize File and Registry Virtualization for backward
compatibility then delete the requestedExecutionLevel node.
-->
<requestedExecutionLevel level="asInvoker" uiAccess="false" />
</requestedPrivileges>
</security>
</trustInfo>
<compatibility xmlns="urn:schemas-microsoft-com:compatibility.v1">
<application>
<!-- A list of all Windows versions that this application is designed
to work with.
Windows will automatically select the most compatible environment.-->
<!-- If your application is designed to work with Windows Vista, uncomment the
following supportedOS node-->
<!--<supportedOS Id="{e2011457-1546-43c5-a5fe-008deee3d3f0}"></supportedOS>-->
<!-- If your application is designed to work with Windows 7, uncomment the
following supportedOS node-->
<!--<supportedOS Id="{35138b9a-5d96-4fbd-8e2d-a2440225f93a}"/>-->
<!-- If your application is designed to work with Windows 8, uncomment the
following supportedOS node-->
<!--<supportedOS Id="{4a2f28e3-53b9-4441-ba9c-d69d4a4a6e38}"></supportedOS>-->
</application>
</compatibility>
<!-- Enable themes for Windows common controls and dialogs (Windows XP and later)
-->
<!-- <dependency>
<dependentAssembly>
<assemblyIdentity
type="win32"
name="Microsoft.Windows.Common-Controls"
version="6.0.0.0"
processorArchitecture="*"
publicKeyToken="6595b64144ccf1df"
language="*"
/>
</dependentAssembly>
</dependency>-->
</asmv1:assembly>
Notice how a huge number of comments help you understand the file content and how you should manage the behavior of your application according to the Windows version that your application is going to target. The requestedExecutionLevel element enables you to specify which permission level must be requested to the UAC. You have three possibilities, explained in Table 2.2.
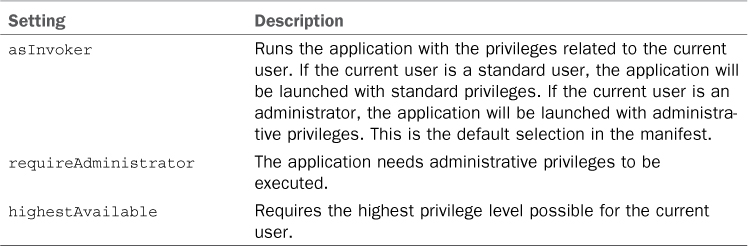
To specify a privilege level, just uncomment the line of XML code corresponding to the desired level. You can also delete the requestedExecutionLevel node in case you want to use file and registry virtualization for backward compatibility with older versions of the Windows operating system.
Pay Attention to UAC Requirements
Be careful of the combination of activities that you need to execute on the target machine and the user privileges because bad UAC settings could cause big problems. A good practice is selecting the asInvoker level and architecting your application in a way that it will work on user-level folders and resources. In some situations, you will need deeper control of the target machine and administrator privileges, but these should be considered exceptions to the rule.
The Application Framework
In the lower part of the screen is the Enable Application Framework group, a feature that allows executing special tasks at the beginning and at the end of the application lifetime. For Console applications it is not available, but it is relevant to other kinds of applications; for instance, in the Windows Forms application it enables the setting of a splash screen or establishing which form is the main application form. The application framework is discussed in Chapter 19.
Target Framework
From the Target Framework combo box, you can select the version of the .NET Framework that your application will target. The main difference with the same selection that you can do when creating a new project is that here you can target the .NET Framework Client Profile for versions 4.0, 3.5 Service Pack 1, and 3.5 Server Core. The .NET Framework Client Profile is a subset of the .NET Framework that provides the infrastructure for client applications and that can be included in your deployments instead of the full version. Microsoft removed the .NET Framework Client Profile in version 4.5.
Note for Visual Studio 2010 Users
Until Visual Studio 2010, the Target Framework option was available in the Advanced Compile Options dialog box. In Visual Studio 2012 it has been moved to the Application tab of My Project.
Compiling Projects
Compiling a project (or building according to the Visual Studio terminology) is the process that produces a .NET assembly starting from your project and source code (according to the .NET architecture described in Chapter 1, “Introducing the .NET Framework 4.5”). An assembly can be a standalone application (.exe assembly) or a .NET class library (.dll assembly). To compile your project into an assembly, you need to click the Build command in the Build menu. Notice that the Build command is followed by the name of your project. When invoking this command, Visual Studio launches, behind the scenes, the Visual Basic command-line compiler (Vbc.exe) and provides this tool all the necessary command-line options. For solutions containing different kinds of projects, Visual Studio launches MSBuild.exe, a command-line utility that can compile entire solutions containing several projects written in different languages and of different types. At the end of the build process, Visual Studio shows a log inside the Output window. Figure 2.23 shows the output log of the build process for the MyFirst2012Program sample application.
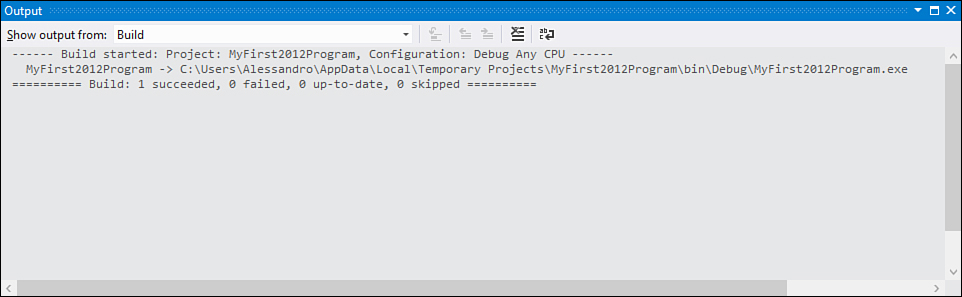
Figure 2.23. The Output window shows the compilation process results.
The compilation log shows useful messages that help you understand what happened. In this case there were no errors, but in situations in which the compilation process fails because of some errors in the code, you will be notified of the errors found by the compiler. The Error List window shows a complete list of error messages and warnings and enables you to easily understand where the errors happened by double-clicking the error message. This operation redirects you to the code that generated the error. The executable (or the executables, in the case of more than one project in the solution) will be put in a subfolder within the project’s directory, called BinDebug or BinRelease, depending on the output configuration you chose. Configurations are discussed next.
Debug and Release Configurations
Visual Studio provides two default possibilities for compiling your projects. The first one is related to the debugging phase in the development process and includes debug symbols that are necessary for debugging applications. The second one is related to the end of the development process and is the one you will use when releasing the application to your customers. Both ways are represented by configurations. By default, Visual Studio offers two built-in configurations: Debug and Release. When the Debug configuration is active, the Visual Basic compiler generates debug symbols that the Visual Studio debugger can process. Without these symbols, you cannot debug your applications with the Visual Studio debugger. The Release configuration basically excludes debug symbols from the build process. It is the configuration you will use when building the final version of your application—that is, the executable you will release to your customers. To set the current configuration, you have two possibilities:
• Use the combo box located on the Visual Studio toolbar.
• Access the Compile options inside the My Project window.
Figure 2.24 shows the Compile tab in My Project.
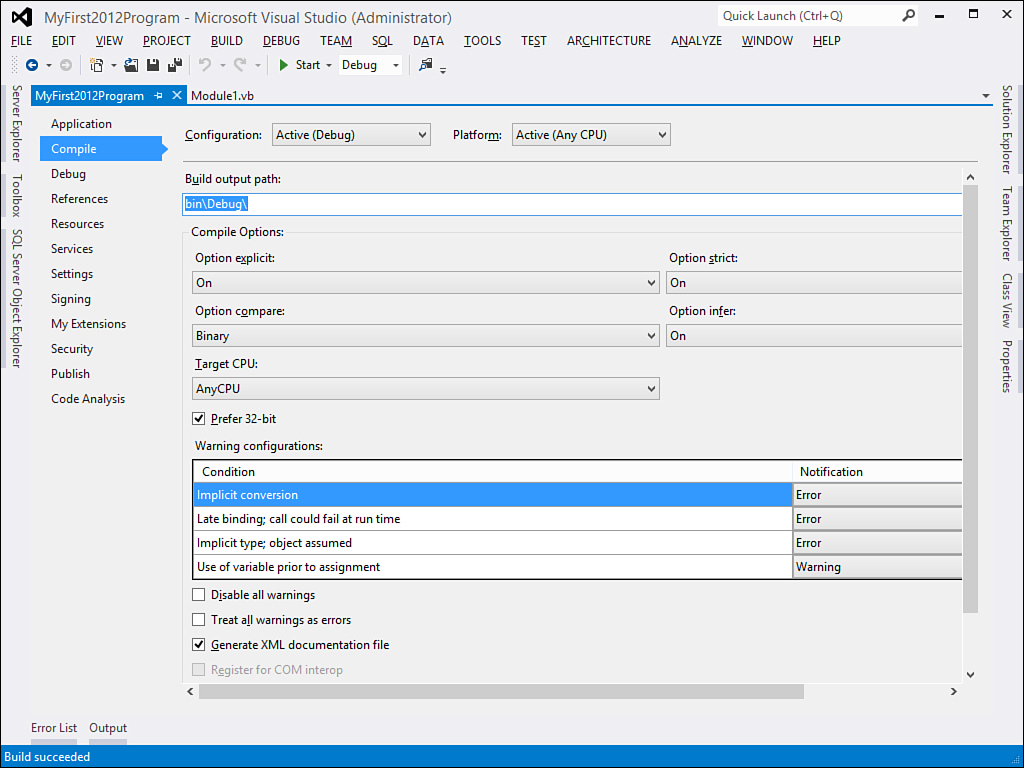
Figure 2.24. Compile options in the My Project window.
At the top of the window is a combo box called Configuration. There you can select the most appropriate configuration for you. By default, Visual Studio 2012 is set up on the Debug configuration. You could also consider building a custom configuration (although both Debug and Release can be customized instead of making new ones), which will be discussed next. For our purposes, it’s suitable to leave unchanged the selection of the Debug configuration as the default because we will study the Visual Studio debugging features in depth.
Creating Custom Configurations with Configuration Manager
You might have situations in which both the Debug and Release configurations are not enough for your needs. As mentioned in the previous paragraph, with Visual Studio 2012 you can also create your custom configuration. To accomplish this, you need to access the Configuration Manager tool (see Figure 2.25), which is reachable using the Configuration Manager command in the Build menu. There you can edit an existing configuration or create a new one.
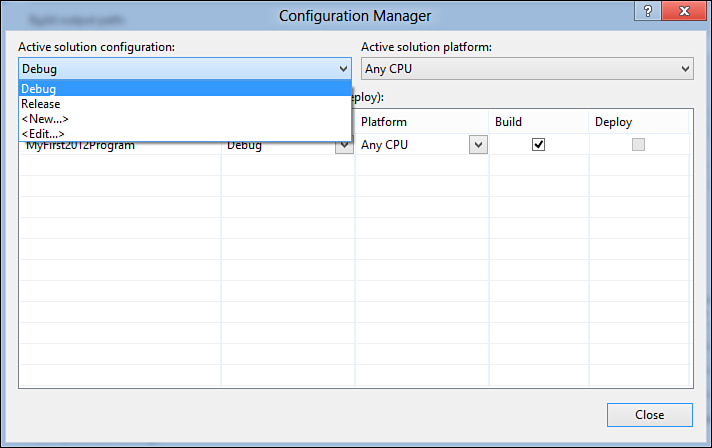
Figure 2.25. The Configuration Manager.
To create a new custom configuration, perform the following steps:
1. Click the Active Solution Configuration combo box and select the New option.
2. In the New Solution Configuration window, specify a name for the new configuration and select an existing configuration (such as Debug) from which settings will be copied. Figure 2.26 shows an example.
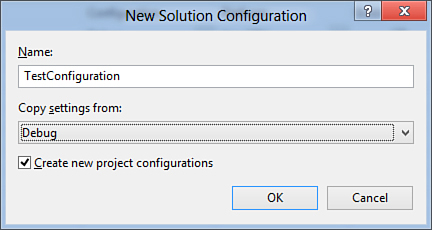
Figure 2.26. Creating a custom configuration that imports settings from an existing one.
3. When done, click Close.
4. Click the Advanced Compiler Options button in the Compile tab and specify which compile options must affect the new configuration. For example, you could decide to affect just compilations against 64-bit processors, so you would need to change the value in the Target CPU combo box. This is the point at which you can modify your real configuration settings and how your project should be built.
Such modification influences just the new configuration. Moreover, if you decide to use the new configuration, you will have a new subfolder under the Bin subfolder in your project’s main folder, which takes the name of your custom configuration and contains the output of the build process made with that configuration. For our MyFirst2012Program sample, the project folder is named MyFirst2012Program and contains the Bin subfolder, which also contains the default Debug and Release subfolders. With your custom configuration, a new TestConfiguration subfolder will be available under Bin.
Background Compiler
Visual Basic 2012 offers a great feature: the background compiler. While you write your code, the IDE invokes the Visual Basic compiler that will immediately compile the code and notify you about errors that occur, writing messages in the Error List window. This is possible because the Visual Basic compiler can compile your code on-the-fly while you type. As you can imagine, this feature is important because you will not necessarily need to build your project each time to understand whether your code can be successfully compiled. Typical examples of the background compiler in action are error messages shown in the Error List window when typing code. Refer to Figure 2.19 to get an idea of this feature. You can double-click the error message to be redirected to the line of code that caused the error. Also, the IDE underlines code containing errors with squiggly lines so that it is easier to understand where the problem is.
Other Compile Options
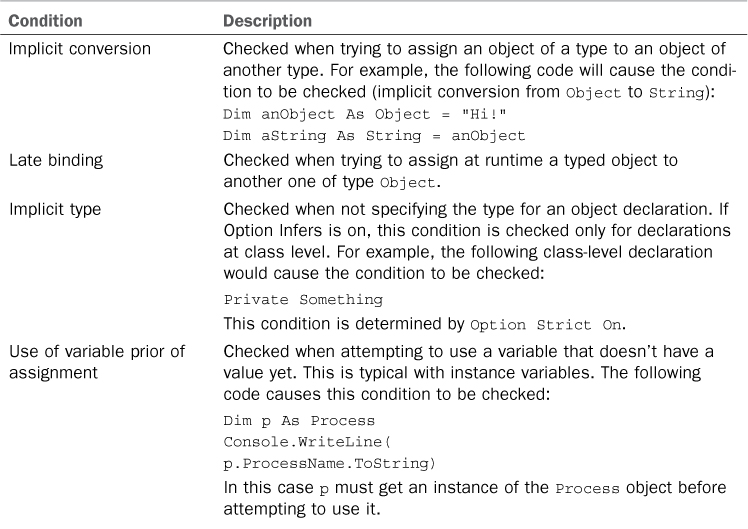
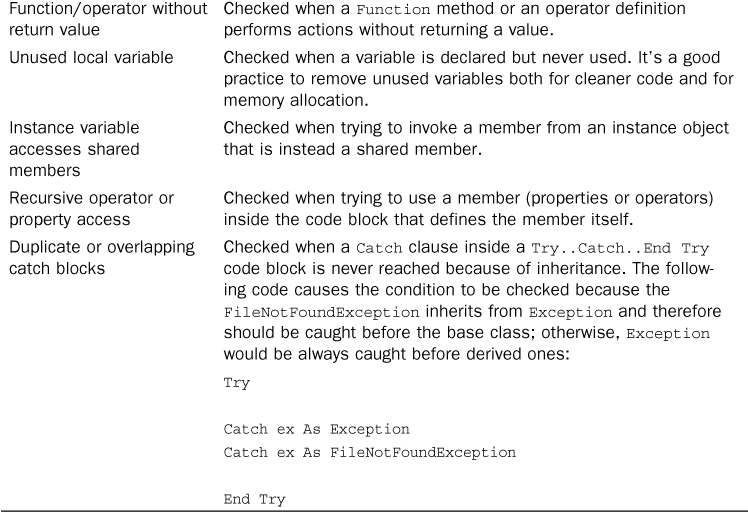
Visual Studio 2012 enables developers to get deep control over the build process. With particular regard to Visual Basic, you can control other compile options that are specific to the language. Table 2.3 lists them in detail.
Table 2.3. Visual Basic Compile Options
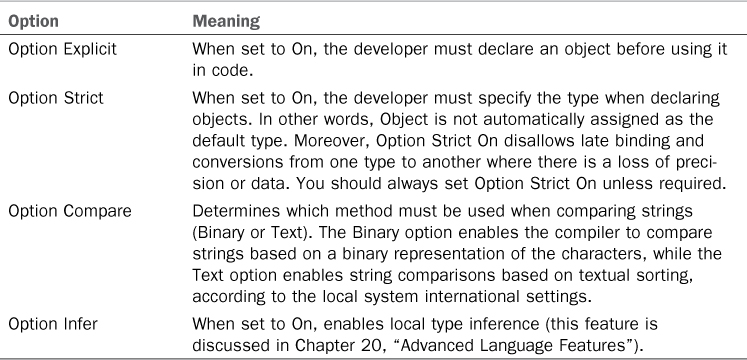
By default, Option Strict is Off. You can set it to On each time you create a new project, but you can also change the default setting by clicking Tools, Options. Then in the Options dialog box expand the Projects and Solutions node; finally select the VB Defaults element and change the default setting.
Options shown in Table 2.3 are also considered by the background compiler, so you will be immediately notified when your code does not match these requirements. You can also specify how the Visual Basic compiler has to treat some kind of errors. This is what you see next.
Target CPU
You can specify the CPU architecture your applications will target. You can choose among 32-bit architectures (x86), 64-bit architectures (x64), Itanium processors, ARM (in the case of Windows Store Apps) or any architecture (AnyCPU). Until Visual Studio 2010 this setting was available in the Advanced Compile Options dialog box.
Warning Configurations
Warning configurations state how the Visual Basic compiler should notify the developer of some particular errors, if just sending warning messages (which will not prevent from compiling the project) or error messages (which will instead prevent from completing the build process).
Do Not Ignore Warning Messages
Even if warning messages will not prevent the completion of the build process, they should never be blindly ignored. They could be suggestions of potential exceptions at runtime. You should always accurately check why a warning message is thrown and, possibly, solve the issue that caused the warning. A typical example of when warnings could be ignored is when running code analysis on code that does not need to be compliant with Microsoft specifications (for example, the user interface side of a WPF application). In all other situations, you should be careful about warnings.
Depending on how you set the Visual Basic compile options discussed in the previous paragraph, Visual Studio will propose some default scenarios for sending notifications (and, consequently, influencing the build process). Table 2.4 lists the available warning conditions.
Table 2.4. Warning Condition Details
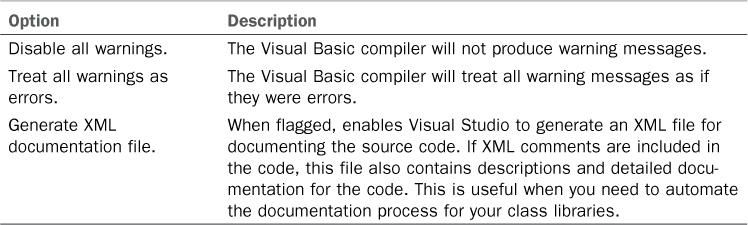
You also have the ability to change single notifications; just select the most appropriate notification mode for your needs. Based on the explanations provided in Table 2.4, be careful about the consequences that this operation could cause. If you are not sure about consequences, the best thing is leaving default options unchanged. Three other compile options are listed at the bottom of the Compile tab and described in Table 2.5.
Table 2.5. Additional Compile Options
Advanced Compile Options
You can specify advanced settings for the build process. To accomplish this, you need to click the Advanced Compile Options button.
Compiler Settings and Configurations
Advanced compiler settings are at the configuration level. This means that the Debug configuration has its own advanced settings, the Release configuration has its own settings, and your custom configurations will have their own settings. Please remember this when providing advanced settings.
Figure 2.27 shows the Advanced Compiler Settings window.
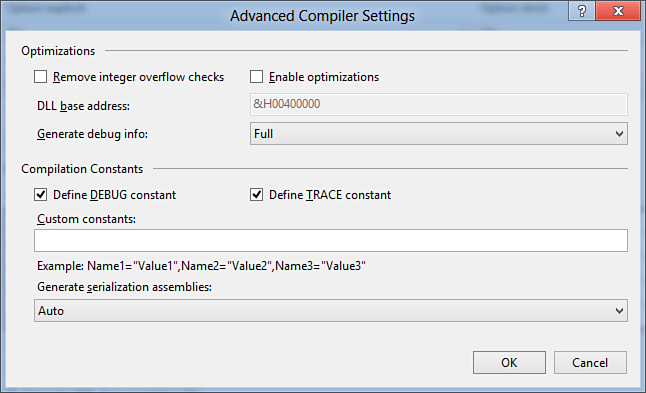
Figure 2.27. The Advanced Compiler Settings window.
Here you can set compiler options to drive the build process. Next we discuss options in detail.
Optimizations
The Optimization tab offers options that would potentially lead to building a smaller and faster executable. This tab is composed of four options that we discuss.
Remove Integer Overflow Checks
When you make calculations in your code against Integer or Integer-style data types, the Visual Basic compiler checks that the result of the calculation falls within the range of that particular data type. By default, this option is turned off so that the compiler can do this kind of check. If you flag this check box, the compiler will not check for such overflows, and the application execution might result faster. Be careful about this choice, especially if your code implements calculations.
Enable Optimizations
When this check box is flagged, the compiler basically removes some opcodes that are required for interacting with the debugger. Moreover, the Just-In-Time compilation is optimized because the runtime knows that a debugger will not be attached. On the other hand, this can result in major difficulties when debugging applications. For example, you might not use breakpoints at specific lines of code and, consequently, perform debugging tasks although the optimization process could produce a smaller and faster executable.
DLL Base Address
This option is available when developing class libraries and user controls and provides the ability to specify the Base Address for the assembly. As you might know, the base address is the location in memory where a .dll file is loaded. By default, Visual Studio assigns a base address and represents it in hexadecimal format. If you need to provide a custom base address, this is the place where you can do it.
Generate Debug Information
Generating debug information when building your project allows you to use the debugger against your application. By default, this option is set to Full, which means that full debug information is generated so that the debugger can be fully used to debug an application. (This is the case of the Debug configuration.) If you set this option to None, no debug information will be generated; if you set this option to pdb-only, the compiler will produce just a .pdb file containing debug symbols and project state information.
Compilation Constants
You can use compilation constants to conditionally compile blocks of code. Conditional compilation relies on the evaluation to True of constants that will be included in the final assembly. The Visual Basic compiler defines some default constants you can evaluate within your code; you also have the ability to declare custom constants. In the Advanced Compiler Settings window, you can specify whether the compiler needs to include the DEBUG and TRACE constants. The first one enables you to understand if the application is running in debug mode; in other words, if the application has been compiled using the Debug configuration. The second one is also related to debugging tasks; particularly, the .NET Framework exposes a class called Trace that is used in debugging and that can send the tracing output to the Output window when the TRACE constant is defined. If not, no output is generated because invocations versus the Trace class are ignored. A full list of built-in constants can be found at MSDN Library at http://msdn.microsoft.com/en-us/library/dy7yth1w(VS.110).aspx. Evaluating constants in code is simple. You can use the #If, #Else, #ElseIf, and #EndIf directives. For example, if you want to evaluate whenever an application has been compiled with the Debug configuration, you could write the following code:
#If DEBUG Then
Console.WriteLine("You are in Debug configuration")
#Else
Console.WriteLine("You are not in Debug configuration")
#End If
which essentially verifies if the constant is defined and takes some action at that point. In our example, if the DEBUG constant is defined in the assembly, this means that it has been built via the Debug configuration.
Custom Constants
You can also define custom constants. This can be basically accomplished in two ways. The first is adding custom constants in the appropriate field of the Advanced compiler settings window. Each constant must have the form of Name="Value", and constants are separated by commas. The second way for providing custom constants is adding a #Const directive in your code. For example, the following line of code
#Const TestConstant = True
defines a constant named TestConstant whose value is set to True. The big difference in using a #Const directive is that it defines just private constants that have visibility within the code file that defines them.
Generate Serialization Assemblies
As we discuss in Chapter 41, “Serialization,” serialization in .NET development is a technique that allows persisting the state of an object. Among several alternatives, this can be accomplished using a class called XmlSerializer. In such situations, the Visual Basic compiler can optimize applications that use the XmlSerializer class, generating additional assemblies for better performances. By default, this option is set to Auto so that Visual Studio generates serialization assemblies only if you are effectively using XML serialization in your code. Other options are On and Off.
Debugging Overview
In this section you get an overview of the debugging features in Visual Studio 2012 for Visual Basic applications. Although the debugger and debugging techniques are detailed in Chapter 5, “Debugging Visual Basic 2012 Applications,” here we provide information on the most common debugging tasks, which is something that you need to know in this first part of your journey through the Visual Basic programming language.
Debugging an Application
To debug a Visual Basic application, you basically need to perform two steps:
• Enable the Debug configuration in the compile options.
• Press F5 to start debugging.
By pressing F5, Visual Studio runs your application and attaches an instance of the debugger to the application. Because the Visual Studio debugger needs the debug symbols to proceed, if you do not choose the Debug configuration, you cannot debug your applications. The instance of the debugger detaches when you shut down your application.
Tip
As an alternative you can click the Start button on the Visual Studio standard toolbar. If the Debug configuration is selected, this action will be the equivalent of pressing F5. If the Release configuration is selected, this is the equivalent of launching the application with CTRL + F5.
The debugger monitors your application’s execution and notifies for runtime errors; it allows you to take control over the execution flow as well. Figure 2.28 shows our sample application running with the Visual Studio debugger attached.
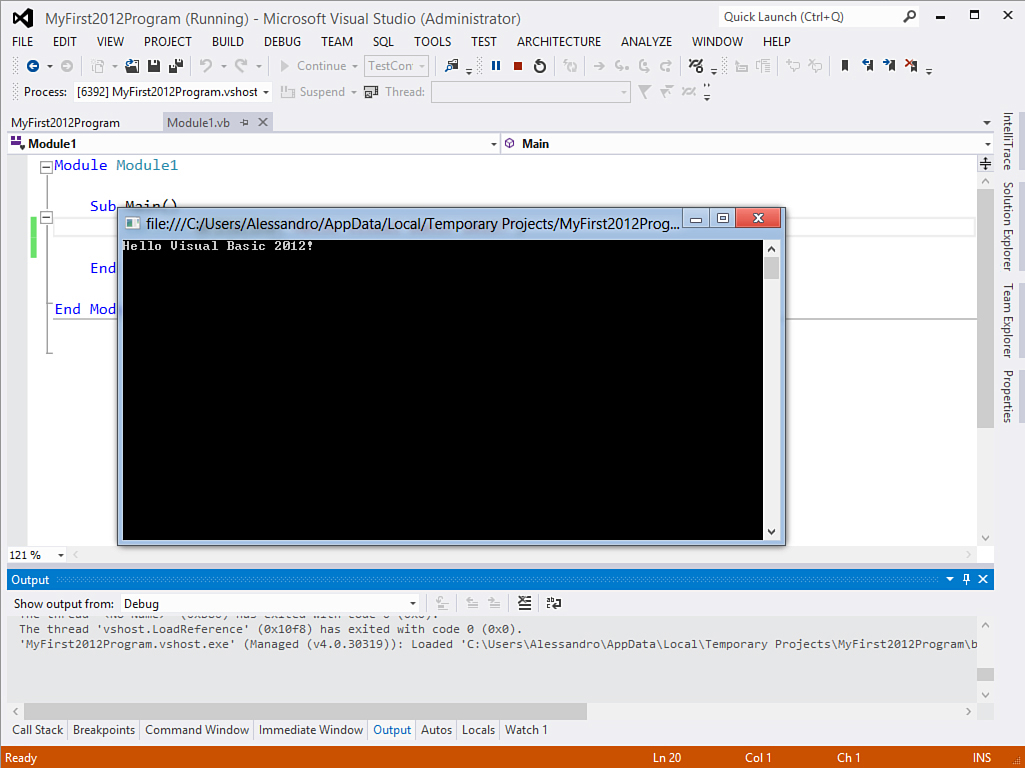
Figure 2.28. Our sample application running with an attached instance of the Visual Studio debugger.
In the bottom area of the IDE, you can notice the availability of some tabs, such as Locals, Watch 1, Watch 2, Call Stack, Breakpoints, Command Window, Immediate Window, and Output. Each tab represents a tool window that has specific debugging purposes. Also, notice how the status bar becomes orange and an orange border is placed around the IDE, to remind the developer that the IDE is running in debugging mode. The Visual Studio debugger is a powerful tool; next you learn the most important tasks in debugging applications. Before explaining the tooling, it is a good idea to modify the source code of our test application so that we can cause some errors and see the debugger in action. We could rewrite the Sub Main method’s code, as shown in Listing 2.3.
Listing 2.3. Modifying the Sub Main for Debugging Purposes
Sub Main()
'A text message
Dim message As String = "Hello Visual Basic 2012!"
Console.WriteLine(message)
'Attempt to read a file that does not exist
Dim getSomeText As String =
My.Computer.FileSystem.ReadAllText("FakeFile.txt")
Console.WriteLine(getSomeText)
Console.ReadLine()
End Sub
New to Visual Basic .NET?
If you are not an existing Visual Basic .NET developer, you may not know some of the objects and keywords shown in the code listings of this chapter. The code is the simplest possible, so it should be easy to understand; comments are also provided. The next chapters guide you to the details of the programming language, so everything used here will be explained. At the moment, it is important for you to focus on the instrumentation more than on the code.
The code simply declares a message object of type String, containing a text message. This message is then shown in the Console window. This is useful for understanding breakpoints and other features in the code editor. The second part of the code will try to open a text file, which effectively does not exist and store its content into a variable called getSomeText of type String. We need this to understand how the debugger catches errors at runtime, together with the edit and continue feature.
Breakpoints and Data Tips
Breakpoints enable you to control the execution flow of your application. A breakpoint breaks the execution of the application at the point where the breakpoint itself is placed so that you can take required actions (a situation known as break mode). You can then resume the application execution. To place a breakpoint on a specific line of code, just place the cursor on the line of code you want to debug and then press F9.
To add a breakpoint, you can also right-click the line of code you want to debug and select the Breakpoint, Insert breakpoint command from the pop-up menu or just click the leftmost column in the code window.
A breakpoint is easily recognizable because it highlights in red the selected line of code (see Figure 2.29).
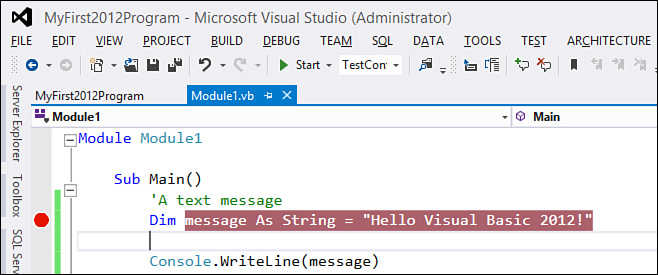
Figure 2.29. Placing a breakpoint in the code editor.
To see how breakpoints work, we can run the sample application by pressing F5. When the debugger encounters a breakpoint, it breaks the execution and highlights in yellow the line of code that is being debugged, as shown in Figure 2.30, before the code is executed.
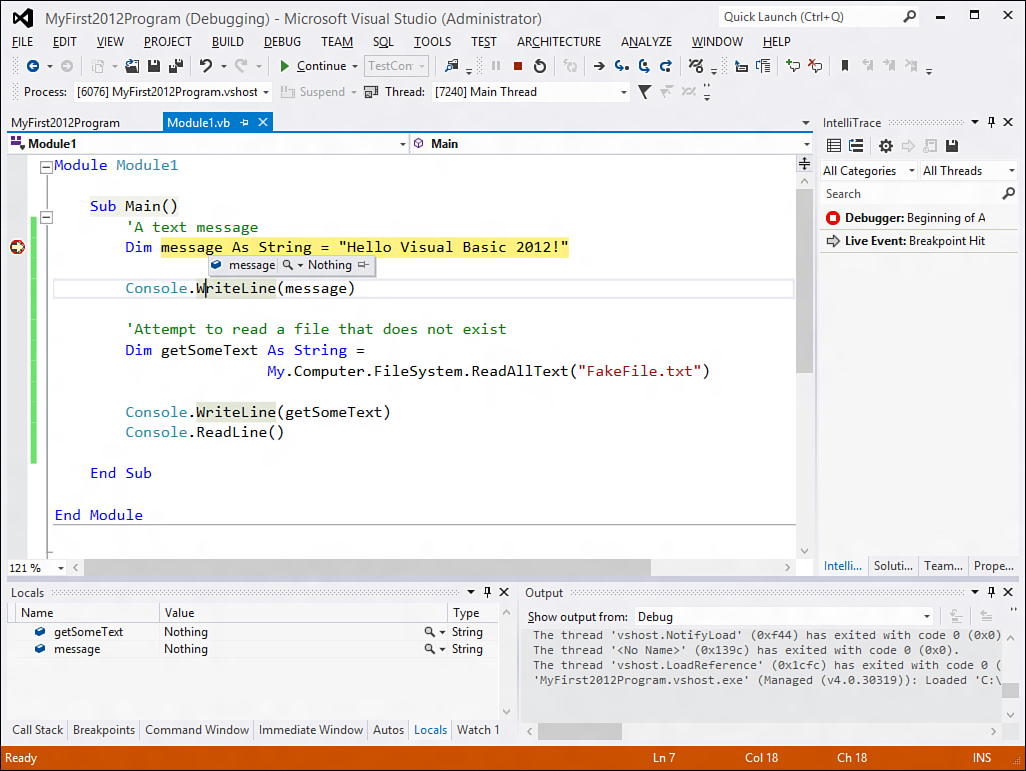
Figure 2.30. When encountering a breakpoint, Visual Studio highlights the line of code that is currently debugged.
If you take a look at Figure 2.30, you notice that, if you pass with the mouse pointer over the message variable, IntelliSense shows the content of the variable itself, which at the moment contains no value (in fact, it is set to Nothing). This feature is known as Data Tips and is useful if you need to know the content of a variable or of another object in a particular moment of the application execution.
The Visual Studio Historical Debugger
If you run the Microsoft Visual Studio 2012 Ultimate edition, you also notice another window called IntelliTrace. This window is also known as the Visual Studio Historical Debugger and is specific to the Visual Studio Ultimate instrumentation. It is discussed in Chapter 55, “Advanced Analysis Tools.”
You can then execute just one line of code at a time, by pressing F11. For example, supposing we want to check if the message variable is correctly initialized at runtime. We could press F11 (which is a shortcut for the Step Into command in the Debug menu). The line of code where the breakpoint is placed will now be executed, and Visual Studio will highlight the next line of code. At that point, you can still pass the mouse pointer over the variable to see the assignment result, as shown in Figure 2.31.
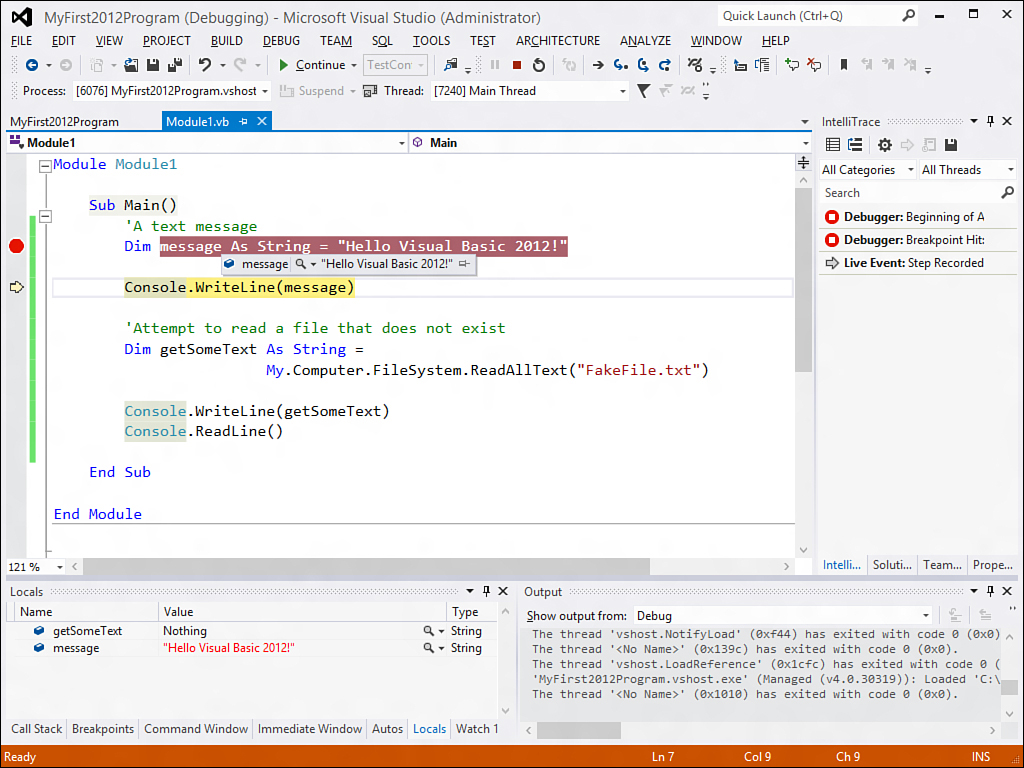
Figure 2.31. Using the Step Into command lets us check whether the variable has been assigned correctly.
When you finish checking the assignments, you can resume the execution by pressing F5. The execution of the application continues until another breakpoint or a runtime error is encountered. We discuss this second scenario next.
Runtime Errors
Runtime errors are particular situations in which an error occurs during the application execution. These are not predictable and occur due to programming errors that are not visible at compile time. Typical examples of runtime errors are when you create an application and you give users the ability to specify a filename, but the file is not found on disk, or when you need to access a database and pass an incorrect SQL query string. Obviously, in real-life applications you should predict such possibilities and implement the appropriate error handling routines (discussed in Chapter 6, “Handling Errors and Exceptions”), but for our learning purposes about the debugger, we need some code that voluntarily causes an error. Continuing the debugging we began in the previous paragraph, the application’s execution resumption causes a runtime error because our code is searching for a file that does not exist. When the error is raised, Visual Studio breaks the execution as shown in Figure 2.32.
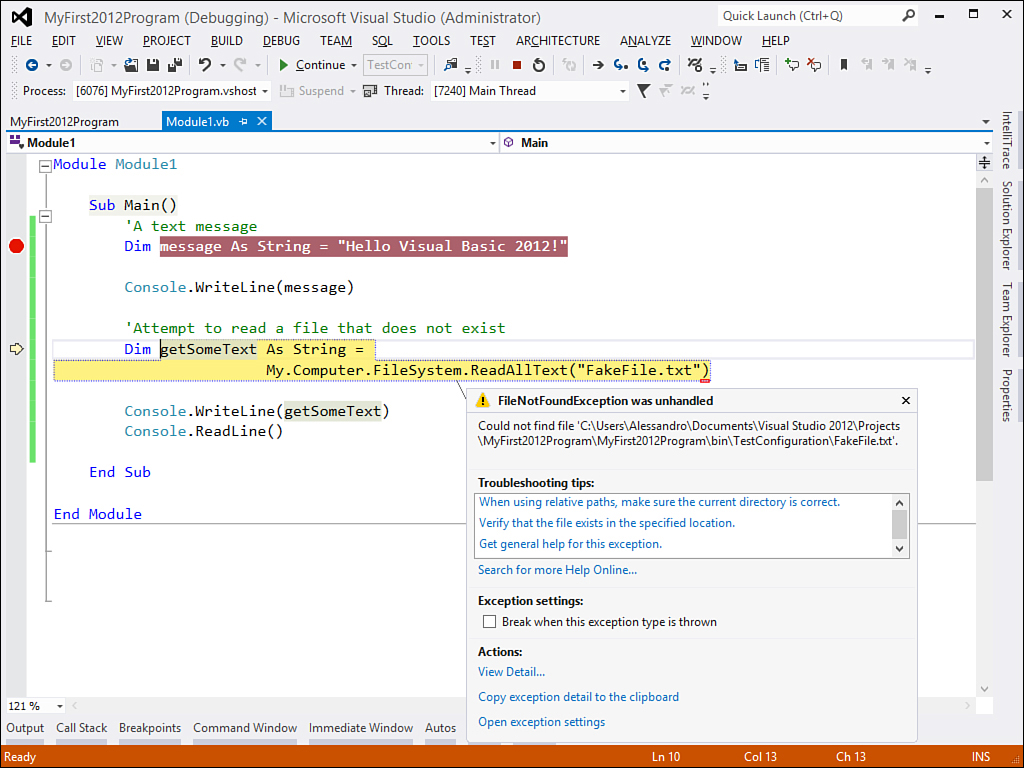
Figure 2.32. The Visual Studio debugger encounters a runtime error.
As you can see, the line of code that caused the error appears highlighted. You also can see a pop-up window that shows some information about the error. In our example, the code searched for a file that does not exist, so a FileNotFoundException was thrown and was not handled by error handling routines; therefore, the execution of the application was broken. Visual Studio also shows a description of the error message. (In our example it communicates that the code could not find the FakeFile.txt file.) Visual Studio also shows some suggestions. For example, the Troubleshooting tips suggest some tasks you could perform at this point, such as verifying that the file exists in the specified location, checking the pathname, or getting general help about the error. By clicking a tip, you are redirected to the MSDN documentation about the error. This can be useful when you don’t exactly know what an error message means. There are other options within the Actions group. The most important is View Detail. This enables you to open the View Detail window, which is represented in Figure 2.33. Notice how the StackTrace item shows the hierarchy of calls to classes and methods that effectively produced the error. Another interesting item is the InnerException. In our example it is set to Nothing, but it’s not unusual for this item to show a kind of exceptions tree that enables you to better understand what actually caused an error. For example, think of working with data. You might want to connect to SQL Server and fetch data from a database. You could not have sufficient rights to access the database, and the runtime might return a data access exception that does not allow you to immediately understand what the problem is. Browsing the InnerException can help you understand that the problem was caused by insufficient rights. Going back to the code, this is the point where you can fix it and where the Edit and Continue features comes in.
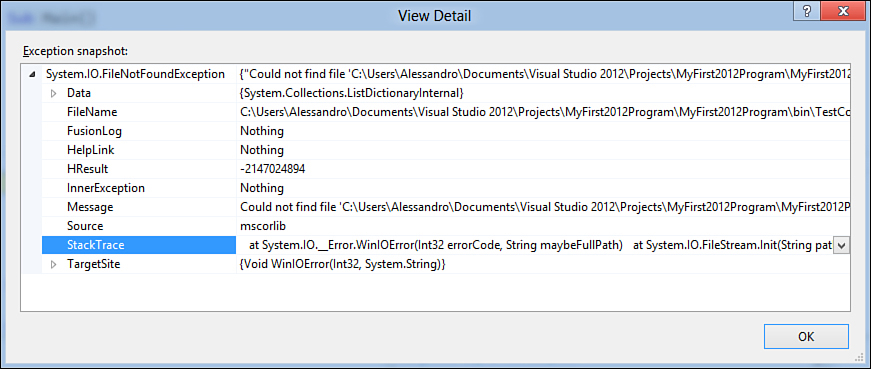
Figure 2.33. The View Detail window enables developers to examine what caused an exception.
Edit and Continue
The Edit and Continue features enable you to fix bad code and resume the application execution from the point where it was broken, without having to restart the application. You just need to run the application by pressing F5; then you can break its execution by pressing Ctrl+Alt+Break or either selecting the Break All command in the Debug menu or pressing Pause on the Debug toolbar.
Availability of Edit and Continue
Generally, you can use the Edit and Continue features, but there are situations in which you will not. For example, if fixing your code might influence the general application behavior, you need to restart the application. Also, Edit and Continue is not available when running configurations that target 64-bit CPUs nor in Silverlight applications.
In our example we need to fix the code that searches for a not existing file. We can replace the line of code with this one:
Dim getSomeText As String = "Fixed code"
This replaces the search of a file with a text message. At this point we can press F5 (or F11 if we want to just execute the line of code and debug the next one) to resume the execution. Figure 2.34 shows how the application now runs correctly. The Edit and Continue feature completes the overview of the debugging features in Visual Studio. As we mentioned before, this topic is covered in detail in Chapter 6.
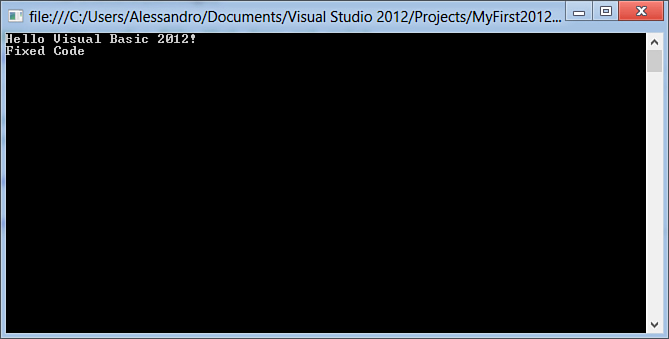
Figure 2.34. The sample application running correctly after fixing errors.
After this brief overview of the debugging features in Visual Studio 2012, it’s time to talk about another important topic for letting you feel at home within the Visual Studio 2012 IDE when developing applications: getting help and documentation.
Browsing the Visual Basic and .NET Documentation
The .NET Framework Base Class Library is very large, and remembering all the objects that you can use in your applications (or the ones that .NET Framework relies on) is not possible. What is instead important is to know where to search for information. You have different tools available to browse the .NET Framework and its documentation, for Visual Basic, too. Because the goal of this chapter is to provide information on the primary tools you need for developing Visual Basic applications, getting help with the language and with the tooling is absolutely one of the primary necessities, as discussed next.
Online Help and the MSDN Library
Visual Studio 2012 ships with the MSDN Library, which is the place where you can find documentation for Visual Basic 2012 and the .NET Framework 4.5. There are basically two ways to access the MSDN Library: offline and online. To access the MSDN Library offline, you have the following alternatives:
• Click the View Help command from the Help menu in Visual Studio.
• Press F1 from wherever you are.
• Open the Microsoft Help Viewer shortcut in Windows’s Start, All Programs, Microsoft Visual Studio 2012 menu; this launches the local help viewer.
If you are writing code or performing a particular task on a tool within the IDE, pressing F1 is the best choice because you will be redirected to the help page related to that instruction, code statement, or tool. If you are instead searching for information about a particular technology or framework, such as WPF or the Visual Studio Tools for Office, you could consider one of the other choices. To access the MSDN Library online, you just need an Internet connection. Then you can specify to always use the online help by selecting Help, Set Help Preference and then clicking Launch in Browser or Launch Help Viewer, or you can manually open one of the following websites, which are the main points of interest for a Visual Basic developer:
• The MSDN Library portal at http://msdn.microsoft.com/en-us/library/default.aspx
• The .NET Framework reference at http://msdn.microsoft.com/en-us/library/w0x726c2(VS.110).aspx
• The Visual Basic page on the Visual Studio Developer Center at http://msdn.com/vbasic
You can also quickly find information on particular objects using built-in tools, such as the Object Browser.
Managing Help Contents
You can download additional documentation or remove documentation that is already on your system by selecting Help, Add or Remove Help Content.
Object Browser Window
The Object Browser is a special tool window that enables you to browse the .NET Framework class library as well as any referenced libraries and types defined in your projects. You can get a hierarchical view of the Base Class Library and of all the types defined in your solution, including types defined in referenced external assemblies. The Object Browser can be activated by pressing CTRL+ALT+J; it is useful because you can understand how a type is defined, which members it exposes, which interfaces it implements, and which other classes it derives from. If the types are documented, you can get a description for each object or member.
Figure 2.35 represents, as an example, the Object Browser showing members of the System.Windows.ContentElement class.
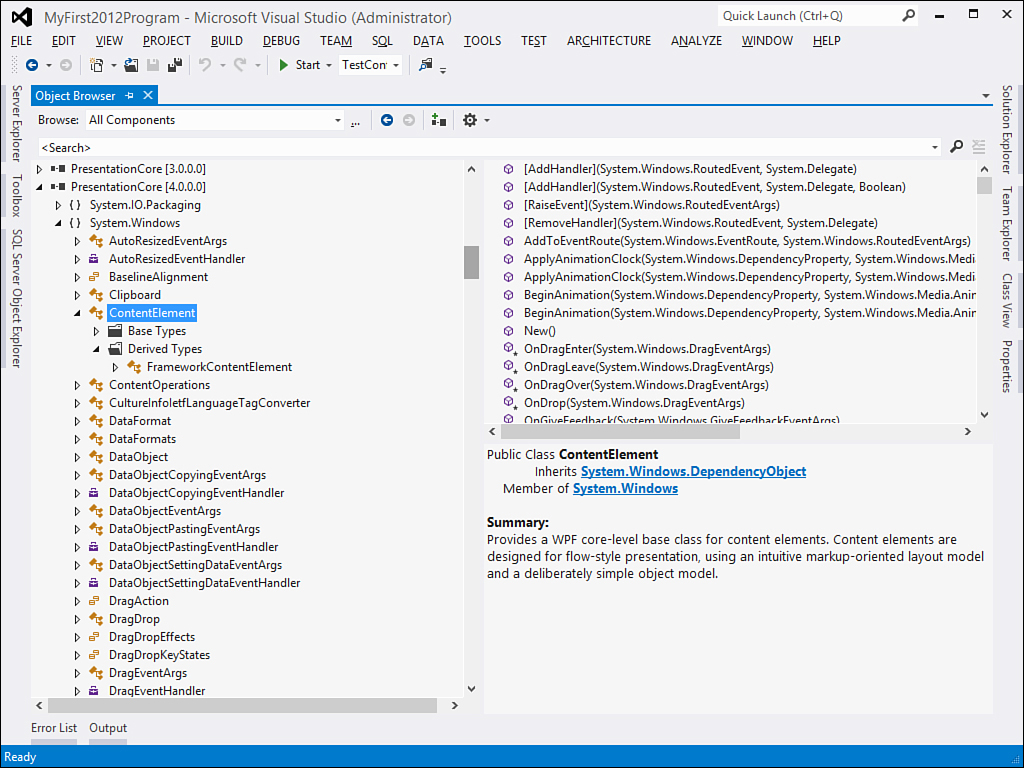
Figure 2.35. The Object Browser enables exploring .NET objects showing information.
The right side of the window lists methods and properties exposed by the selected object. When you click on a method or on a member of the object in the left side of the window, a short description of the object should appear in the bottom-right side of the Object Browser. If the description is not useful enough to understand the meaning of an object or of one of its members, you can press F1, and Visual Studio shows the online help (if available) for the object or member. The Object Browser also provides links to objects used by the one you are exploring. Considering the example shown in Figure 2.35, you not only can see the description of a method, but also can also click the parameters’ identifiers to be redirected to the definition of the parameter. The Object Browser can also be invoked when writing code, as discussed next.
Invoking the Object Browser from the Code Editor
Often you need to know how particular .NET objects or members are structured or how they work. Visual Studio 2012 provides the ability of invoking the Object Browser directly from the code editor by right-clicking the object you want to browse and selecting the Go to Definition command from the pop-up menu. For example, imagine you want to know how the Console class is defined. To accomplish this, you can revisit the MyFirst2012Program example. When in the code editor, right-click the Console object and select Go To Definition. By doing this, Visual Studio opens the Object Browser that automatically selects the Console class, showing its methods on the right side of the screen (see Figure 2.36).
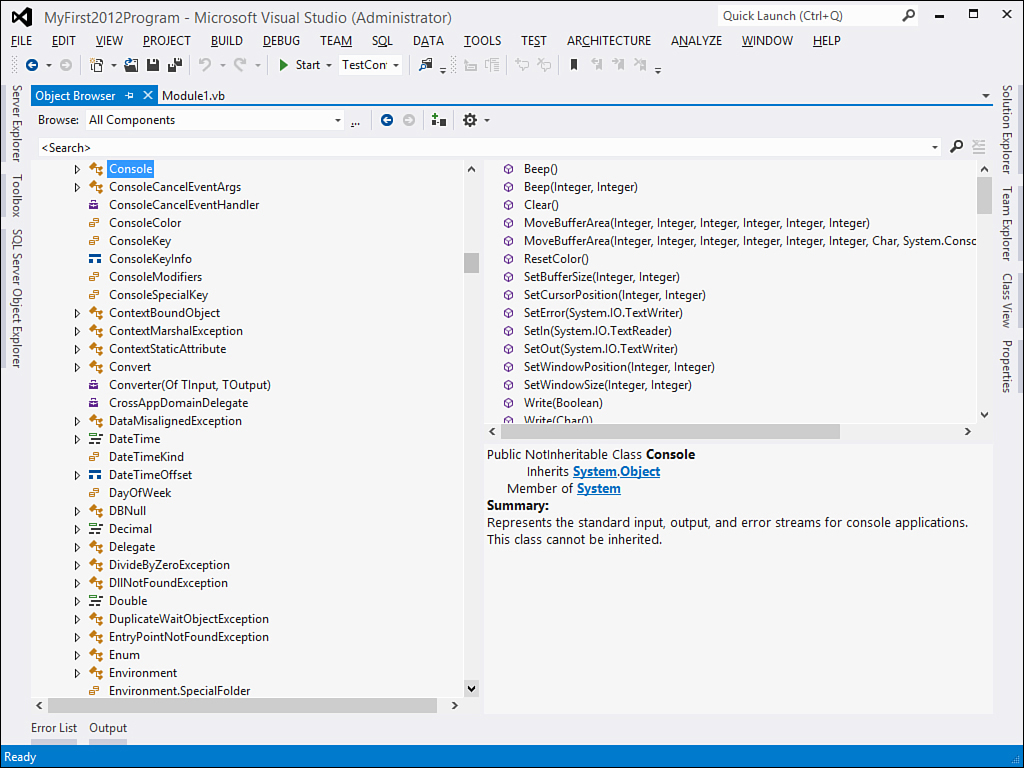
Figure 2.36. The Object Browser can be invoked from the code editor by clicking the Go to Definition command.
This technique works with shared classes or, more generally, with declarations of noninstance classes; however, in some situations you might want to learn about data types or instance members’ definitions. For example, consider the following code:
Dim text As String
text = "Hi!"
If you try to run the Go to Definition command for the text identifier, you will be redirected to the first line of code, which effectively defines the text object. But what if you want to browse the String object? Fortunately there is another command you can choose in such situations—Go to Type Definition. It is still available in the pop-up menu. Invoking Go to Type Definition redirects to the definition of the type that characterizes the object you declared (in our example, String). The result will be the same as in Figure 2.36, of course referring to the selected type.
Although the Object Browser’s purpose is not typically to provide help, it is a good place for learning about .NET objects, both if you need information on their structure and if you need descriptions on their usage.
Quick Launch Tool
Visual Studio 2012 introduces a new tool called Quick Launch. The purpose of this tool is making it easy to find commands, options, and recently opened files. The tool is available through a search box located at the upper right corner of the IDE. For example, imagine you need to launch the SQL Server Object Explorer window but do not remember where the command for launching such a window is and do not want to waste time browsing every menu. If you type “SQL” in the Quick Launch search box, Visual Studio will show all menu commands, options, and recently opened files (if any) containing the “SQL” word. As you can see from Figure 2.37 the SQL Server Object Explorer is the first search result, so you can simply click it to open the desired tool.
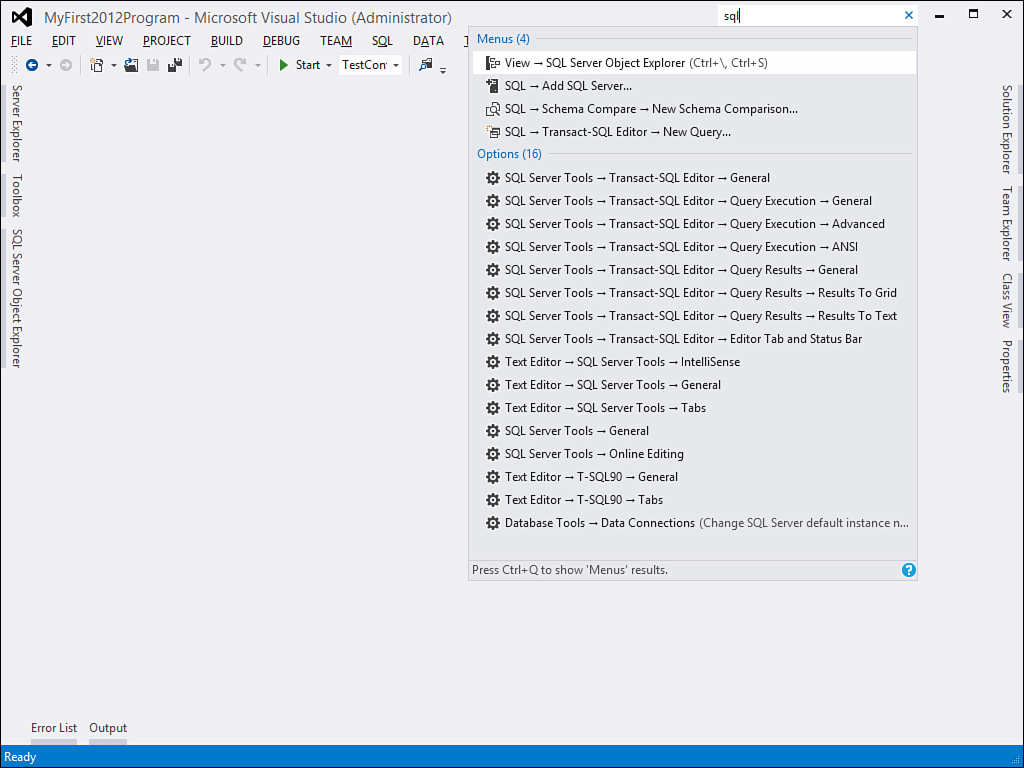
Figure 2.37. Finding commands and options with Quick Launch.
To understand how it works, repeat the search and select the SQL Server Tools -> General option from the list. You will see how Visual Studio will open the Options dialog box pointing to the requested setting. This is a useful tool that can save a lot of time in finding the necessary tools.
Showing the Hierarchy of Method Calls
Visual Studio 2012 brings to Visual Basic a tool window named Call Hierarchy, which was already introduced for Visual C# in Visual Studio 2010. As its name implies, Call Hierarchy enables the showing of the hierarchy of calls to and from one or more methods. To understand how it works, let’s consider the following code:
Module Module1
Sub Main()
DoSomething()
End Sub
Sub DoSomething()
DoSomethingElse()
End Sub
Sub DoSomethingElse()
DoNothing()
End Sub
Sub DoNothing()
'
End Sub
End Module
The code defines some method, without performing any particular tasks, but it demonstrates a nested hierarchy of method calls. If you right-click one of the method’s names and then select View Call Hierarchy from the pop-up menu, you will be able to see the method call hierarchy as demonstrated in Figure 2.38.
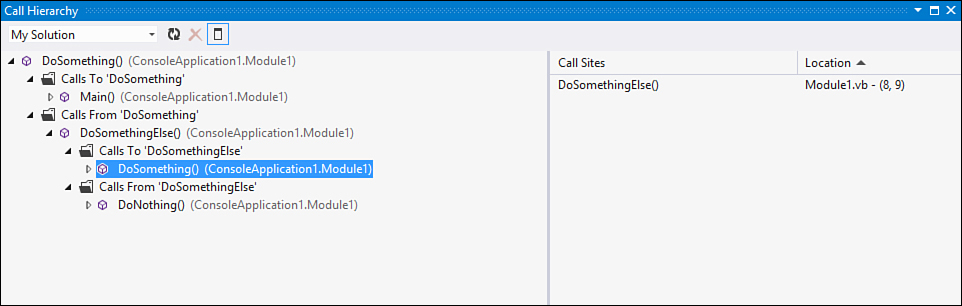
Figure 2.38. Analyzing method calls with Call Hierarchy.
As you can see from Figure 2.38, the tool shows the first level hierarchy, but you can also expand method names to show the full hierarchy, including nested method calls. On the right side of the window is the line number in the code file where the selected method is defined. Also, if you double-click a method name in Call Hierarchy, the code editor will automatically focus on the method definition.
Summary
In this chapter we discussed basic things you need to know as a Visual Basic developer to feel at home within the Visual Studio 2012 Integrated Development Environment. Tasks such as creating projects, compiling projects, debugging applications, and searching for documentation and tools are the most common in a developer’s life, and this chapter offers a fast way to understand all the primary tools you need for building applications with Visual Basic 2012. You also saw some new tools introduced by Visual Studio 2012, such as Quick Launch and Call Hierarchy. Now that you know how you can move inside the IDE, it’s time to begin working with the Visual Basic programming language.