
Chapter 5. Debugging Visual Basic 2012 Applications
In This Chapter
Debugging is one of the most important tasks in your developer life. Debugging enables you to investigate for errors and analyze the application’s execution flow over an object’s state. Visual Studio 2012 offers powerful tools for making debugging an easier task. In this chapter you get details about the Visual Studio instrumentation and learn how to make your code interact better with the debugger. Microsoft introduced some specific enhancements to the debugger in Visual Studio 2012 for parallel debugging and the Task Parallel Library; these enhancements will eventually be described in the appropriate chapters. In this chapter you find information regarding the generality of Visual Basic applications. Chapter 2, “Getting Started with the Visual Studio 2012 IDE,” provides an overview of the most common debugging tasks, but in this chapter you learn about more advanced debugging tools and techniques available in the IDE. Be sure you read Chapter 2 before continuing on with this one.
Preparing an Example
Most debugging features illustrated in this chapter require some code before you can use them. At the moment we are more interested in the Visual Studio 2012 instrumentation than in complex code, so we start with a simple code example that is a good base for understanding how the debugger works. You can create a new Visual Basic project for the Console and then type the code, as shown in Listing 5.1.
Listing 5.1. Preparing the Base for the Debugger
Module Module1
Sub Main()
Console.WriteLine("Enter a valid string:")
Dim lineRead As String = Console.ReadLine()
Dim result As Boolean = Test(lineRead)
Console.WriteLine("Is a valid string: " & result.ToString)
Console.ReadLine()
End Sub
Function Test(ByVal name As String) As Boolean
If String.IsNullOrEmpty(name) = False Then
Return True
Else
Return False
End If
End Function
End Module
The code is quite simple. The application just asks the user to enter a string and then returns False if the string is null or is empty; it returns True if the string is valid. With such simple code, you can now begin learning the advanced debugging instrumentation available in Visual Studio 2012.
Debugging Instrumentation
The Visual Studio 2012 IDE offers several powerful tools for deeply debugging applications. These tools are part of the development environment instrumentation and are discussed in this section. Remember that when you debug an application, the status bar and the border of Visual Studio 2012 become orange.
Debugging in Steps
When the application execution breaks—for example, when the debugger finds a breakpoint—you can usually continue to execute the application running just one line of code per time or a small set of lines of code per time. In Chapter 2, you learned about the Step Into command; in this section we discuss other similar commands that cause different debugger behaviors.
How Can I Execute Such Techniques?
The debugging techniques described in this section can be accomplished by invoking commands available in the Debug menu of Visual Studio 2012. In the meantime, shortcuts are available for invoking the same commands using the keyboard. These are provided when discussing each command.
Step Into
The Step Into command executes one instruction per time. It is similar to Step Over, but if the instruction to be executed is a method, the method is executed one instruction per time and, when finished, the execution goes back to the caller. You can invoke Step Into by pressing F11.
Note on Keyboard Shortcuts
The keyboard shortcuts in this chapter assume that you are using the Visual Studio default keyboard layout and can vary depending on the IDE configuration settings. The Debug menu shows the appropriate keyboard shortcuts for your active configuration.
Step Over
Similarly to Step Into, Step Over executes one instruction per time. The difference is that if the instruction to be executed is a method, the debugger does not enter the method and completes its execution before going back to the caller. You can invoke Step Over by pressing F10. This can be useful when you need to debug a portion of code that invokes several methods you already tested and that you do not need to delve into each time.
Step Out
Step Out works only within methods and enables executing all lines of code next to the current one, until the method completes. If you consider the code shown in Listing 5.1 and place a breakpoint on the If statement inside the Test method definition, invoking Step Out can cause the debugger to execute all the lines of code next to the If, completing the execution of the method. In this example, after Step Out completes, the control is returned to the second Console.Writeline statement in Sub Main. You can invoke Step Out by pressing Shift+F11.
Run to Cursor
You can place the cursor on a line of code, right-click the line of code, and tell the debugger to execute all the code until the selected line. This can be accomplished by selecting the Run to Cursor command on the pop-up menu.
Set Next Statement
Within a code block, you can set the next statement to be executed when resuming the application execution after a breakpoint or stop. Continuing the previous code example, if you place a breakpoint on the first Console.Writeline statement, inside the Main method, the application stops the execution at that point. Now imagine you want the debugger to resume debugging from the second Console.Writeline statement (therefore skipping the debugging of the Test method invocation) and execute the lines of code before. You can right-click the Console.Writeline statement and select Set Next Statement from the pop-up menu, and this line will be the first that you can step through. As an alternative, you can drag the yellow arrow in the IDE to the desired line.
Show Next Statement
This command moves the cursor to the next executable statement. This can be useful if you have long code files and breakpoints are not immediately visible. You can invoke it simply by right-clicking the code editor and selecting the Show Next Statement command from the pop-up menu.
Mixed Mode Debugging
You can debug Visual Basic applications built on both managed and native code with the Mixed Mode feature, which is available for both 32-bit and 64-bit applications. To enable mixed-mode debugging, follow these steps:
1. In Solution Explorer, select the project you want to debug.
2. Open My Project and select the Debug tab.
3. Select the Enable Native Code Debugging check box.
“Just My Code” Debugging
You might remember from Chapter 2 and Chapter 3, “The Anatomy of a Visual Basic Project,” that every time you create a Visual Basic application the IDE generates some background code. Moreover, your code often invokes system code that you do not necessarily need to investigate. In Visual Basic the IDE offers the capability of debugging just your own code, excluding system and auto-generated code. This feature is also known as Just My Code debugging. This is useful because you can focus on your code. Just My Code is enabled by default in Visual Studio 2012. To disable it or enable it, open the Options window, select the Debugging node on the left, and then flag or unflag the Enable Just My Code (Managed Only) check box, as shown in Figure 5.1.
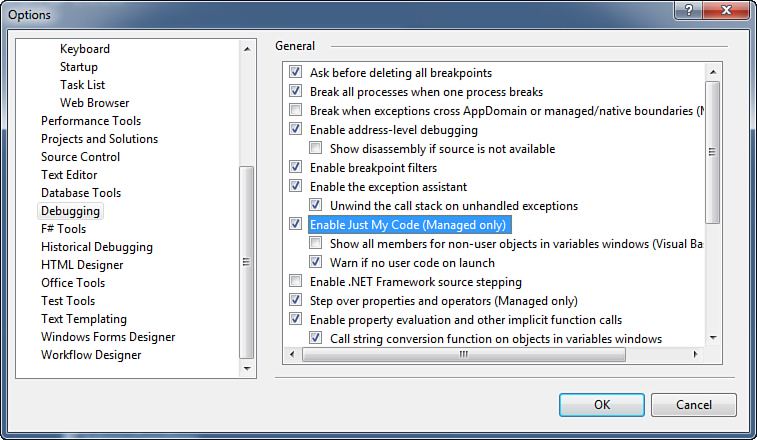
Figure 5.1. Enabling/disabling Just My Code debugging.
Behind the scenes, Just My Code adds (or removes) some .NET attributes to auto-generated code that can influence the debugger behavior. To see a simple example, open or create a project and then click the Show All Files button in Solution Explorer. After doing this, go to the Settings.designer.vb code file. Listing 5.2 shows the content of the My namespace definition inside the file.
Listing 5.2. Understanding Just My Code Behind the Scenes
Namespace My
<Global.Microsoft.VisualBasic.HideModuleNameAttribute(), _
Global.System.Diagnostics.DebuggerNonUserCodeAttribute(), _
Global.System.Runtime.CompilerServices.CompilerGeneratedAttribute()> _
Friend Module MySettingsProperty
<Global.System.ComponentModel.Design.HelpKeywordAttribute("My.Settings")> _
Friend ReadOnly Property Settings() As
Global.DebuggingFeatures.My.MySettings
Get
Return Global.DebuggingFeatures.My.MySettings.Default
End Get
End Property
End Module
End Namespace
You can notice that the module MySettingsProperty is decorated with a particular attribute named System.Diagnostics.DebuggerNonUserCodeAttribute. This attribute indicates to the debugger that the code is not your code (user code) and that it will not be debugged when Just My Code is on. Three attributes influence the debugger’s behavior in this feature. Table 5.1 shows the complete list.
Table 5.1. Just My Code Attributes

Of course, you can use attributes of your own so that you can influence the behavior of the debugger when Just My Code is disabled.
Working with Breakpoints and Trace Points
In Chapter 2, we introduced breakpoints and saw how we can break the application execution before some statements are executed. We now discuss some interesting features of breakpoints when debugging Visual Basic applications.
The Breakpoints Window
Using the Breakpoints window, you can manage all breakpoints in your solution. You can open such a window by pressing Ctrl+Alt+B. Supposing we placed three breakpoints in our sample application, Figure 5.2 shows how the Breakpoints window would look.
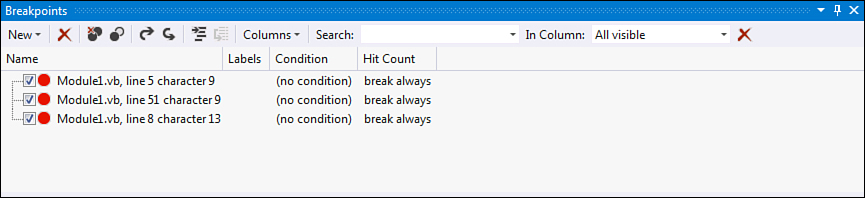
Figure 5.2. The Breakpoints window.
In the Breakpoints window, you can easily manage your breakpoints. For example, you could delete, temporarily disable, or enable again the breakpoints. You can also specify the behavior for each breakpoint, such as Hit count, Filter, and other functionalities that we describe next. Also, you can easily switch to the source code in which the breakpoint is located or to the disassembly view. (See Figure 5.9 in the “Call Stack Window” section later in this chapter.) An important opportunity is exporting and importing breakpoints; Visual Studio 2012, as well as its predecessor, can export to XML files the list of breakpoints or import a list from an XML file. If you have lots of breakpoints, you can search breakpoints according to specific criteria using the Label feature, which we focus on next. The Breakpoints window provides a graphical unified instrument for performing operations on breakpoints.
Editing Breakpoints Labels
You can add labels to breakpoints. Labels are a kind of identifier that can identify more than one breakpoint, and their purpose is categorizing breakpoints so that you can easily find and manage them within the Edit Breakpoint Label window. You can add a label to a breakpoint from the Edit Breakpoint Label window or by right-clicking the red ball on the left of the desired breakpoint in the code editor and then selecting the Edit Labels command from the pop-up menu. The Edit Breakpoint Labels window is shown in Figure 5.3.
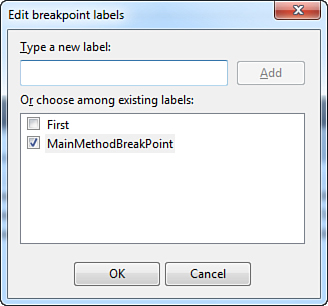
Figure 5.3. The Edit Breakpoint Labels window enables categorizing breakpoints.
You need to specify labels and click Add. When you finish, select the label you want from the list and click OK so that the label is assigned to the breakpoint. You can assign the same label to multiple breakpoints performing the same steps, or you can assign multiple labels to a single breakpoint. Assigning labels to breakpoints can be reflected into the Breakpoints window in which you can search for breakpoints specifying labels in the search box.
Location
You can change the position of a breakpoint by right-clicking the breakpoint and then selecting the Location command from the pop-up menu. In the dialog box that opens, you need to specify the line of code and the character position to which you want the breakpoint to be moved. This can be useful because you can move a breakpoint without losing breakpoint settings.
Hit Count
With the hit term we mean each time a breakpoint is encountered and therefore the application execution should stop. You can control the hit’s behavior. For example, imagine you have a cyclic code that contains a breakpoint, but you need to break the execution only when the cycle arrives at a particular point. By using the Hit Count command, you can specify when the debugger must break the application. For example, consider the following code snippet:
For i As Integer = 0 To 3
Console.WriteLine("Breakpoint test")
Next
Imagine you place a breakpoint on the Console.WriteLine statement and that you want the debugger to break only starting from the second iteration. You can specify this condition by right-clicking the breakpoint and then selecting the Hit Count command. In the Breakpoint Hit Count dialog box, you need to specify the condition. The default setting is always break, which means that the debugger breaks the execution each time a breakpoint is encountered. For our example, set the condition to Break When the Hit Count Is Greater Than or Equal To with value of 2. Figure 5.4 shows the Hit Count window.
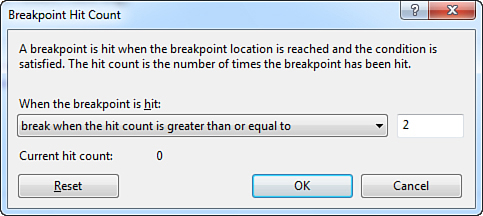
Figure 5.4. The Breakpoint Hit Count window enables customizing breakpoints’ behavior.
With this setting, the previous code would break on the second iteration. It can be convenient when you need to debug your code only from a certain point.
When Hit
When Hit lets you specify a tracepoint. The difference between a breakpoint and a tracepoint is that in this second case, the debugger will not break the execution of the application and writes the information that you specify in the Output window. To set a hit condition, right-click a breakpoint and then select the When Hit command from the pop-up menu. This opens the When Breakpoint Is Hit window, which is shown in Figure 5.5.
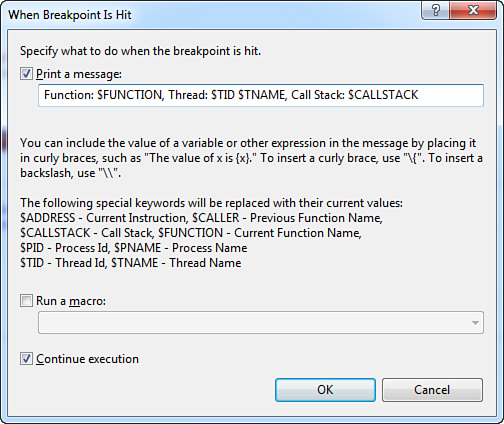
Figure 5.5. Specifying tracepoint conditions.
You can set one of the special expressions indicated in the window to build a kind of log message that will be written to the Output window. A tracepoint is highly customizable, so you can also specify a Visual Basic macro and decide whether the execution needs to continue. This feature is useful when you prefer getting a log message about the application state instead of breaking the execution.
Condition
This command enables specifying whether a breakpoint must be hit, depending on whether the supplied expressions are evaluated to True or get changed. Information on conditions is provided by the following page of the MSDN Library: http://msdn.microsoft.com/en-us/library/za56x861(v=vs.110).aspx. When a condition is set, the debugger then steps into the Hit Count tool.
Locals Window
The Locals window shows the active local variables and their values. Considering the example in Listing 5.1, when stepping into the Main method the Locals window shows information about lineRead and result variables, as shown in Figure 5.6.
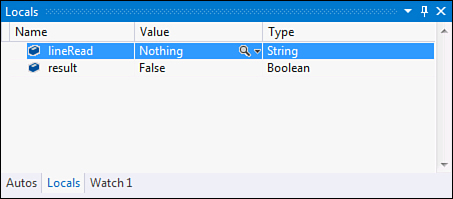
Figure 5.6. The Locals window shows information on local variables.
As you can see, the window shows names of the local variables, their types (in our example Boolean and String), and their actual values. When a variable is not initialized yet, the window shows the default value (for example, Nothing for reference types and zero for Integers). Moreover, if a variable represents an object such as a class or a collection, the variable can be expanded to show members and their values. You can also change variables’ values by double-clicking each one. Some variables cannot be viewed without executing code, such as in-memory queries (they can be still viewed, though the IDE will run the code in memory to be able to display the results).
Command Window
The Command window enables evaluating expressions or running functions without running the application or continuing the debug. Figure 5.7 shows the Command window evaluating an Integer.Parse statement and an invocation to our Test method.
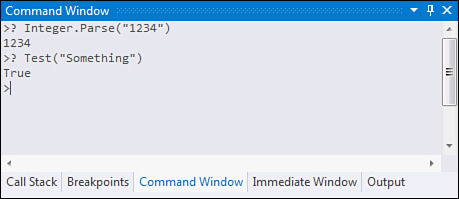
Figure 5.7. The Command window enables evaluating expressions and functions.
This can be useful because we do not need to run our application to see whether a method works, and we could also evaluate complex expressions before writing code. Just remember that only functions are allowed; procedures are not supported. Expressions can be constituted by several .NET objects and Visual Basic keywords, but not all of them are supported. You can get a complete list of supported keywords and expressions from the related MSDN web page available at http://msdn.microsoft.com/en-us/library/099a40t6(v=vs.110).aspx. To evaluate an expression or test a function, you need to first write a question mark (?) symbol. Using a double question mark (??) causes the debugger to open a Quick Watch window, which is discussed later in this chapter. It is worth mentioning that the ? symbol works when either in debug mode or not, while the ?? symbol requires the IDE to be already in debug mode.
Call Stack Window
The Call Stack window shows the method calls stack frame. In other words, you can see how method calls run in the stack. The window can show the programming language that the method is written with and can display calls to external code. By default, the Call Stack window shows information about Just My Code. To understand method calls, press F11 to step into the code. Figure 5.8 shows the Call Stack window related to Listing 5.1.
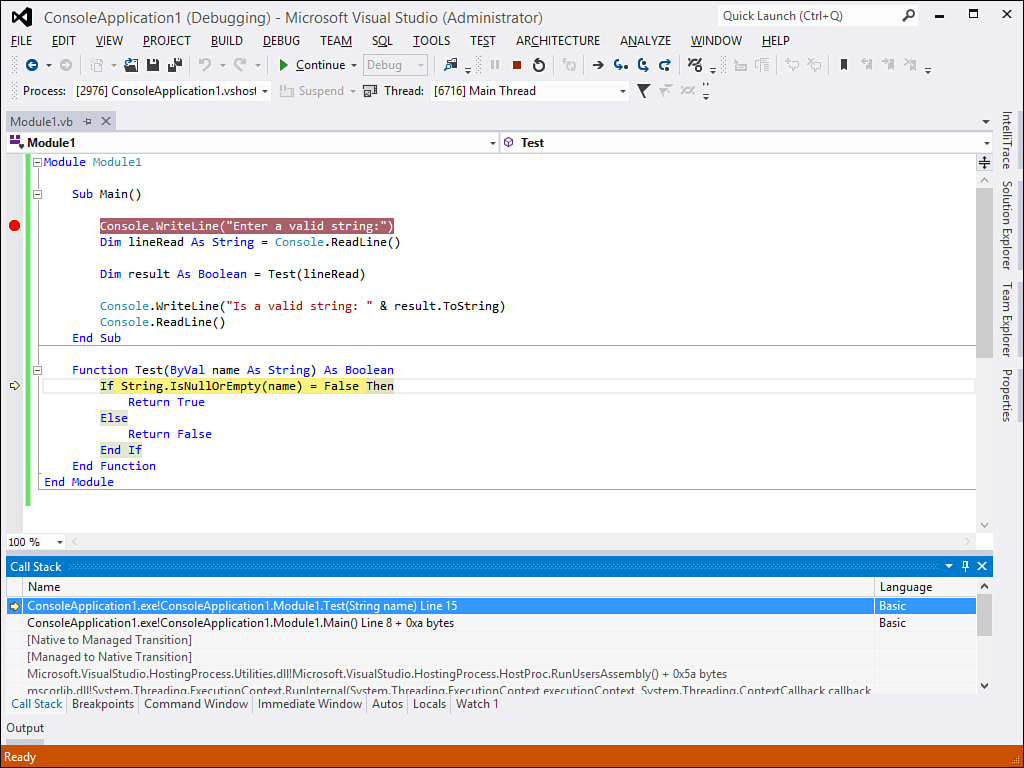
Figure 5.8. The Call Stack window shows method calls in the Stack.
The window shows the names of methods being executed and the programming language with which they were written. Calls to .NET Framework system methods are also shown. Another interesting feature is that you can see the assembly code for code execution. Right-click the window and select the Go to Disassembly command from the pop-up menu. As shown in Figure 5.9, you can see Visual Basic lines of code and the related underlying assembly code that you can step into by pressing F11.
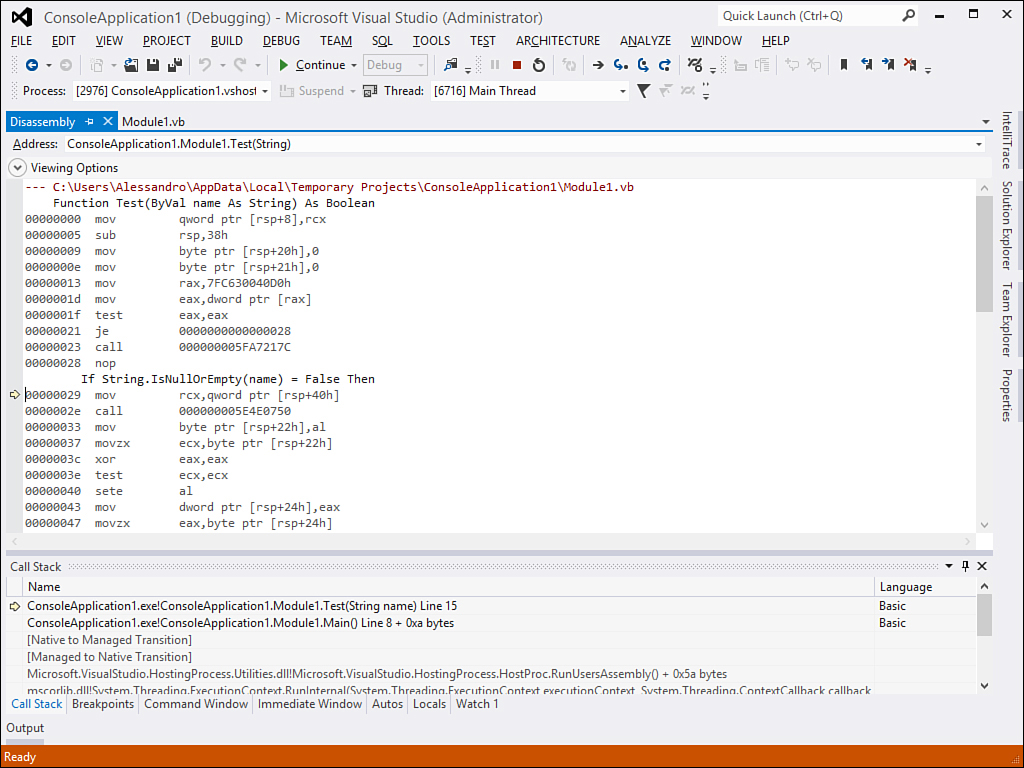
Figure 5.9. The assembly code execution shows in Call Stack.
You can also customize the type of information you want to visualize by expanding the View Options control. This feature provides great granularity on what’s happening behind the scenes and allows understanding if method calls are executed correctly. You can invoke the Call Stack window by pressing Ctrl+Alt+C.
Threads and Call Stack
The Call Stack window can show information only on the current thread. Therefore, method calls on other threads are ignored by the window.
Watch Windows
Watch windows enable monitoring object variables or expressions so that you can track what a variable is doing. There are four Watch windows available, enabling you to track different objects or expressions. To add items to a Watch window, when in break mode right-click the object in the code editor and then select the Add Watch command from the pop-up menu. Continuing our example of Listing 5.1, imagine you want to keep track of the Test method state. Run the application in Step Into mode by pressing F11. When the debugger breaks the application execution, right-click the Test method definition and then click Add Watch. The method is considered as an expression. The first available Watch window is shown and contains the Test item but advertises that no argument has been supplied, as shown in Figure 5.10.
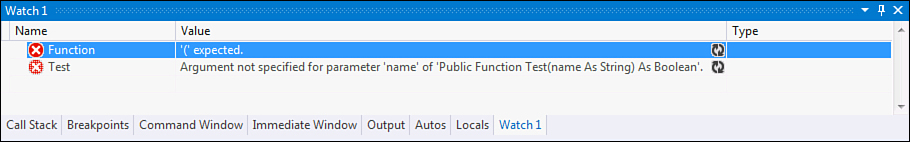
Figure 5.10. Adding an expression to a Watch window.
If you continue stepping into the code, you notice that when the debugger begins stepping into the Test method, the expression is first evaluated as False. (This is the default value for Boolean.) When the code completes the execution, the Watch window contains the actual evaluation of the expression; in our example, if the user writes a valid string in the Console window, the expression is evaluated as True, as shown in Figure 5.11.
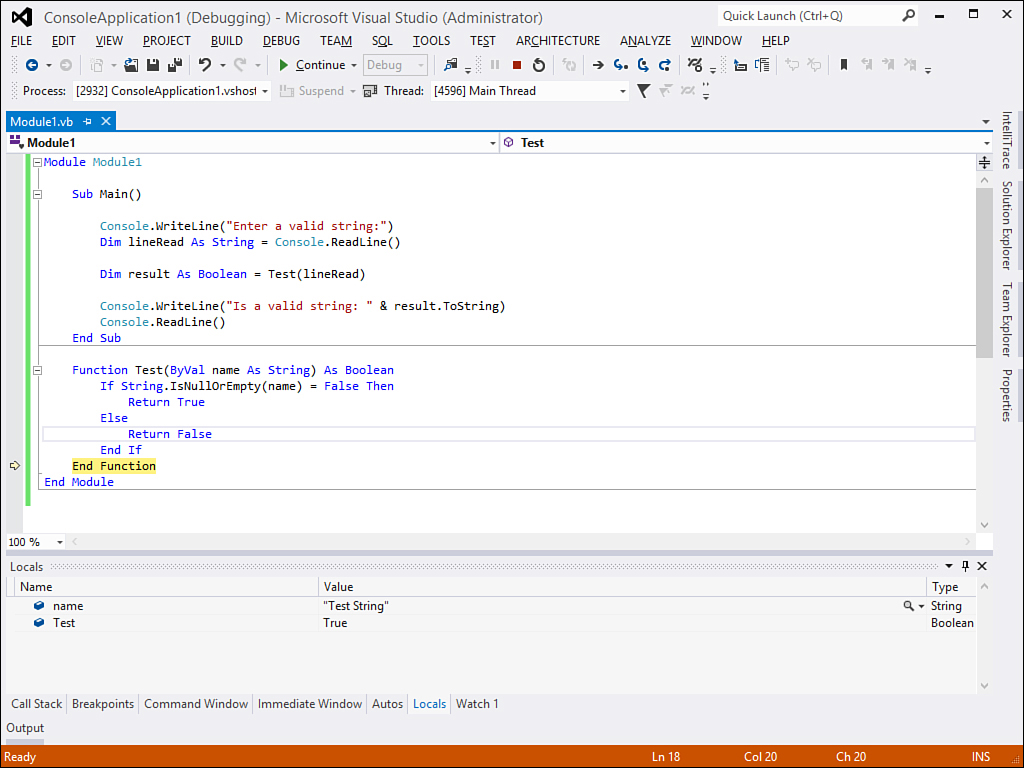
Figure 5.11. Evaluation of the expression is completed within the Watch window.
In this way you can control whether your variables or methods are correctly executed.
Quick Watch Window
The Quick Watch window is an additional Watch window that enables quickly evaluating one expression or variable per time, choosing between items you previously added to Watch windows or right-clicking an object in the code editor and then selecting the Quick Watch command. In this scenario, the expression or variable is evaluated considering its state at the moment you request the Quick Watch to appear. Figure 5.12 shows the Quick Watch window.
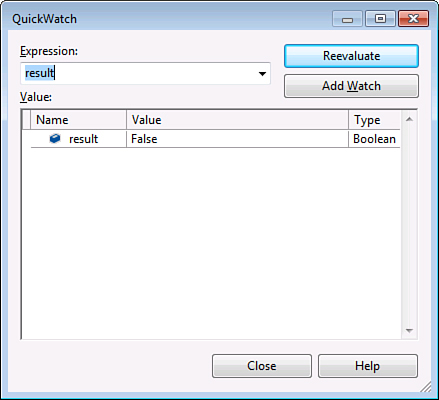
Figure 5.12. The Quick Watch window.
You can pick an expression from the Expression combo box. When you choose the expression, you can click Reevaluate to run the evaluation. Just remember that this dialog box is a modal dialog box, so you need to close it before you can go back to Visual Studio.
Threads Window
.NET applications can run multiple threads. This can happen with your applications, too. You can get a view of the running threads and debugging threads within the Threads window, which you can enable by pressing Ctrl+Alt+H. Figure 5.13 shows the Threads window open when the sample application is in break mode.
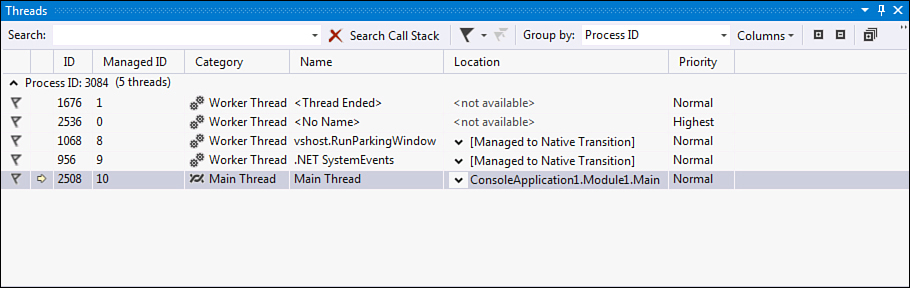
Figure 5.13. The Threads window.
The window shows a list of running threads and enables stepping into the Call Stack for the various threads. If the source code is available for threads other than the current one, you can step into this code. In our example, the main thread is the Console application. You can also organize and filter the view, search within the Call Stack, and get information on the thread’s priority. The Threads window is particularly useful with multithreaded applications. For applications that take advantage of the Task Parallel Library, the Visual Studio 2012 debugger provides other tools, which are described in Chapter 43, “Parallel Programming and Parallel LINQ.”
Call Stack
You can get the method call stack per thread by passing the mouse pointer over each thread in the window. The list of method calls is offered under the form of a tooltip.
Autos Window
The Autos window shows the variables used by the current statement and by the previous three and next three statements. Figure 5.14 shows an example of the Autos window.
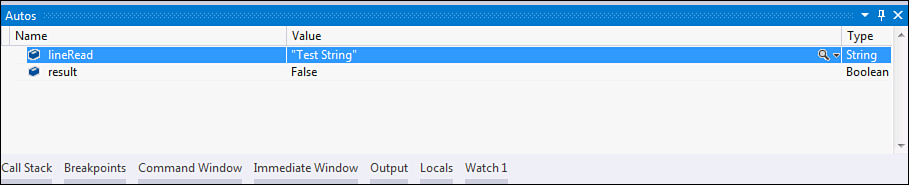
Figure 5.14. The Autos window.
For the Autos window, you can change variables’ values by double-clicking each one.
64-Bit Support
One of the new features in the Visual Studio 2012 debugger is that mixed mode with 64-bit applications debugging is now supported.
Inspecting Object Details with Debugger Visualizers
Debugger visualizers are built-in tools that enable viewing information on objects, controls, members, and variables (generally complex data) in a particular format. For example, if you place a breakpoint on the following line of code of the sample project
Dim result As Boolean = Test(lineRead)
you can then open the Locals window and select the lineRead variable. In the Value column, notice the small magnifying glass you can click. From there, you can choose how you want to visualize information on the lineRead variable, such as Text format, XML format, and HTML format. Of course, trying to view the content of plain text as XML content does not provide any benefits, but if you have a string representing XML data or HTML code, you could get an appropriate representation to understand what’s happening. Visualizers are also useful when you have a large multiline string and you need to see how it is formatted. In our example, Figure 5.15 shows the Text visualizer for the lineRead variable.
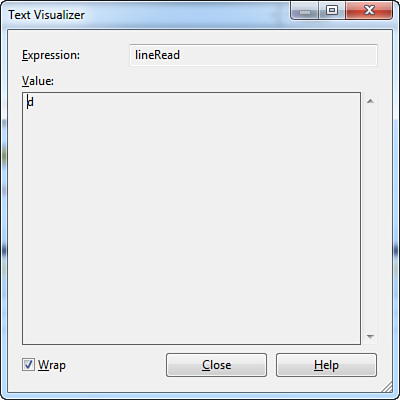
Figure 5.15. Viewing information with debugger visualizers.
The visualizers’ purpose is to provide a graphical tool for analyzing what’s happening on expressions.
Custom Debugger Visualizers
Visual Studio 2012 offers default debugger visualizers that are useful in common situations, but you might need custom visualizers. You can build custom visualizers, but this is beyond the scope of this chapter. Information on creating custom visualizers is available in the MSDN documentation at http://msdn.microsoft.com/en-us/library/e2zc529c(v=vs.110).aspx.
Debugging in Code
The .NET Framework offers the ability to interact with the debugger via managed code. You can use two classes, System.Diagnostics.Debug and System.Diagnostics.Trace, to verify conditions and evaluations that can be useful to provide feedback about your code if it is working correctly. Information generated by these classes can eventually be added to the application.
Both Debug and Trace classes are single-instance shared classes and therefore expose only shared members.
The Debug Class
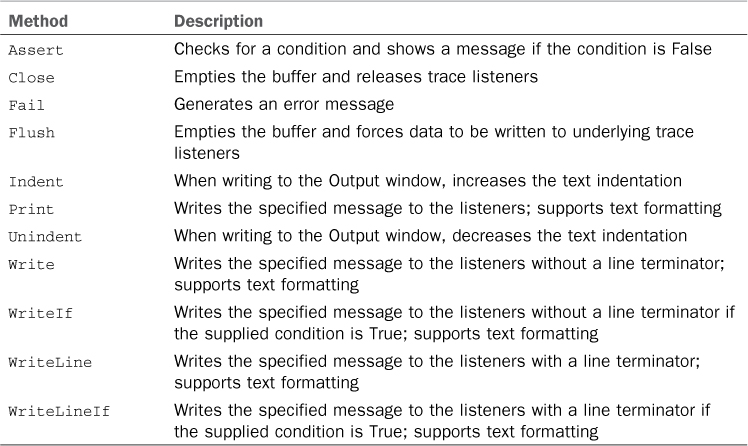
The Debug class, exposed by the System.Diagnostics namespace, provides interaction with the Visual Studio debugger and lets you know whether your code is working correctly via instrumentation that evaluates conditions at a certain point of your code. The Debug class exposes only shared methods and can display contents into the Output window so that you can programmatically interact with the debugger without the need to set breakpoints. Table 5.2 provides an overview of Debug methods.
Table 5.2. Debug Class Methods
Debug Output
Saying that the Debug class can display contents to the Output window is true only in part. Developers can use other built-in outputs known as trace listeners to redirect the output. Later in this chapter we provide an overview of trace listeners.
Continuing the code example in Listing 5.1, try to add the following lines of code after the declaration and assignment of the result variable within the Main method:
Debug.WriteLine("Value of result is " & result.ToString)
Debug.WriteLineIf(result = True, "Result is valid because = True")
'If you type an empty or null string,
'then the condition "result=True" is False therefore
'shows an error message
Debug.Assert(result = True, "Needed a valid string")
Now run the application and type in a valid (nonempty) string. Figure 5.16 shows how the Output window appears when the runtime encounters the Debug methods.
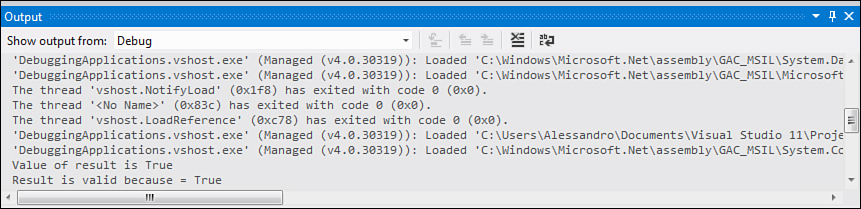
Figure 5.16. Writing debug information to the Output window.
The first line shows the Boolean value of the result variable. The WriteLine method can be useful if you need to monitor objects’ values without breaking the application. This method also adds a line terminator so that a new line can begin. The Write method does the same but does not add a line terminator. The WriteLineIf (and WriteIf) writes a message only if the specified condition is evaluated as True. If you enter a valid string, the WriteLineIf method writes a message. Notice that there is an invocation to the Assert method. This method causes the runtime to show a message box containing the specified message that is shown only if the specified expression is evaluated as False. According to this, if you enter a valid string in the sample application, the expression is evaluated as True; therefore, no message is shown. If you instead enter an empty string (that is, press Enter), the runtime shows the dialog box represented in Figure 5.17.
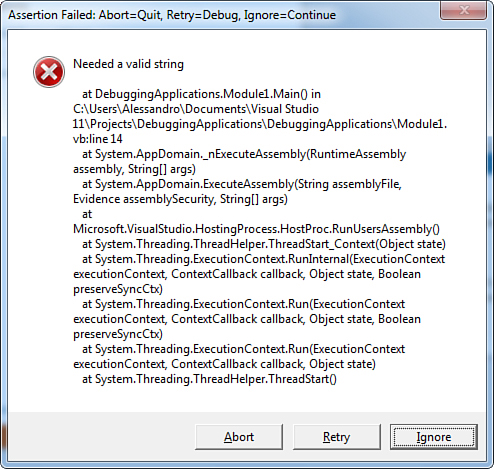
Figure 5.17. The Assertion dialog box.
The Fail method, which is not shown in the example, shows a similar dialog box but without evaluating any condition. In Table 5.2, method descriptions mention trace listeners. We now provide an overview of the Trace class and then an overview of the particular objects.
The Trace Class
The Trace class, which is also exposed by the System.Diagnostics namespace, works exactly like the Debug class. One important difference influences the building process. The output of the Debug class is included in the build output only if the DEBUG constant is defined, but the Trace class’s output is included in the build output only if the TRACE constant is defined. When you build your applications with the Debug configuration active, both constants are defined, so both outputs are included. The Release configuration defines only the TRACE constant, so it includes only this output.
Understanding Trace Listeners
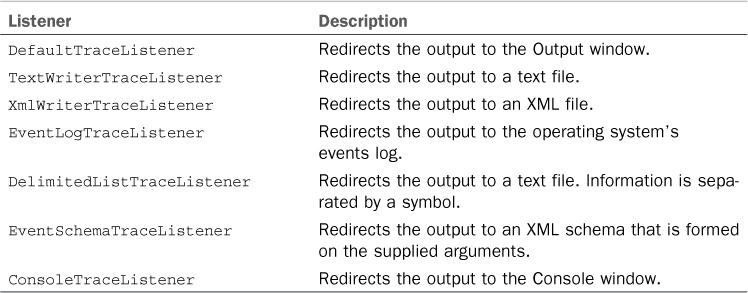
In the preceding examples related to the Debug class (and consequently related to the Trace class, too), you saw how to send the output of the debugger to the Output window. The .NET Framework enables sending the output to other targets, known as trace listeners. A trace listener is an object that “listens” to what is happening at debugging time and then collects information under various forms. For example, you could collect information as XML files or just send such information to the Output window. Both the Debug and Trace classes expose a property named Listeners that represents a set of built-in listeners. Table 5.3 groups the .NET Framework built-in listeners.
Table 5.3. .NET Built-In Trace Listeners
System.Diagnostics Namespace Required
All listeners listed in Table 5.3 are exposed by the System.Diagnostics namespace, which is not mentioned for the sake of brevity. Usually this namespace is imported by default, according to the options set within My Project. If the background compiler advises that classes are not defined, you should add an Imports System.Diagnostics directive to your code.
When you invoke members from the Debug and Trace classes, by default the output is redirected to the output window. This is because the DefaultTraceListener is attached to the application by the debugger. Now suppose you want to redirect the output to a text file. This can be accomplished by writing the following lines of code:
Trace.Listeners.Clear()
Trace.Listeners.Add(New
TextWriterTraceListener
("C:usersalessandrodesktopTraceOutput.txt"))
'This will ensure the file is closed when
'the debugger shuts down
Trace.AutoFlush = True
Trace.WriteLineIf(result = True, "You entered a valid string")
Listeners Do Not Overwrite Files
All built-in trace listeners that redirect output to a file do not overwrite the file itself if it already exists. They just append information to an existing file. If you need to create a new file each time from scratch, remember to remove the previous version (for example, invoking the File.Delete method).
The Trace.Listener.Clear method ensures that all previous information from other listeners gets cleared. You need to add a new instance of the TextWriterTraceListener class to listeners’ collection. At this point you need to supply the name of the output file as an argument. If you add the preceding code after the declaration and assignment of the result variable within the Main method of our main example, the output is redirected to a text file, as shown in Figure 5.18.
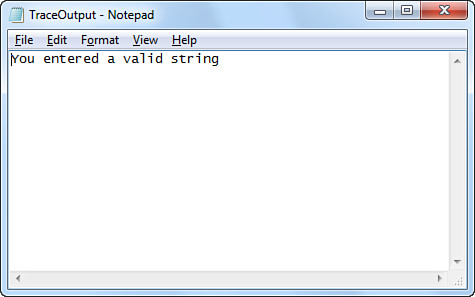
Figure 5.18. The debugging output has been redirected to a text file.
The AutoFlush property set as True ensures that the text file is correctly closed when the debugger shuts down. In the end, you write evaluations as you would do when sending output to the Output window (see WriteLineIf method). A class named DelimitedListTraceListener inherits from TextWriterTraceListener and enables writing information to a file using a delimitation symbol. By default, this symbol is a comma (output files are Comma Separated Value [CSV] files that can be opened with Microsoft Excel), but you can set the Delimiter property value with another symbol. The usage remains the same as its base class. You also might want to redirect output to an XML file. This can be accomplished adding an instance of the XmlWriterTraceListener class, as shown in the following code:
Trace.Listeners.Clear()
Trace.Listeners.Add(New
XmlWriterTraceListener
("C:usersalessandrodesktopTraceOutput.xml"))
'This will ensure the file is closed when
'the debugger shuts down
Trace.AutoFlush = True
Trace.WriteLineIf(result = True, "You entered a valid string")
The usage is the same as in the TextWriterTraceListener example. If you try to run the preceding code, you can obtain a well-formed XML document, as shown in Figure 5.19.
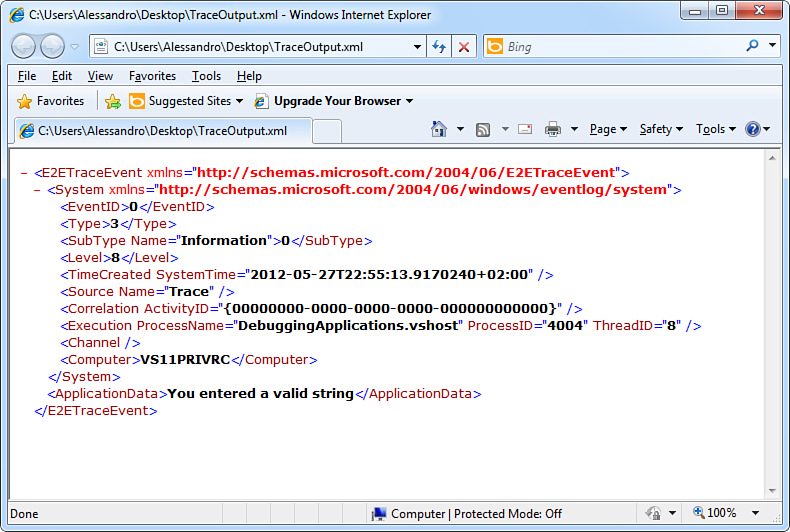
Figure 5.19. The output produced by the XmlWriterTraceListener class.
As you should understand, writing the output to an XML document is a more powerful task because of the amount of information collected. All the information persisted to the XML document is reflected by properties of the instance of the XmlWriterTraceListener class. Each property is named as the related information in the XML document. For example, the Computer property represents the name of the computer running the debugger, the ProcessName property represents the name of the process that the debugger is attached to, the ProcessID property represents the process identification number of the process, and the ThreadID property represents the thread identification number of the process. Another listener that you can use for producing XML files is named EventSchemaTraceListener. This object creates an XML schema starting from debugging information; the EventSchemaTraceListener constructor has several overloads that enable specifying how the schema will be formed. The following code shows an example:
Trace.Listeners.Add(New
EventSchemaTraceListener("Test.xsd",
"My listener",
32768,
TraceLogRetentionOption.LimitedCircularFiles,
65536, 10))
Explaining this class in detail is beyond the scope of this book. If you would like to read further details on this class, you can read the official MSDN documentation at http://msdn.microsoft.com/en-us/library/system.diagnostics.eventschematracelistener(v=vs.110).aspx. The EventLogTraceListener class works similarly to the previous ones. The following lines of code attach a new instance of the class to the debugger, and the debug output is redirected to the Windows Event Log:
Trace.Listeners.Clear()
Trace.Listeners.Add(New EventLogTraceListener
("Chapter 5 - Debugging applications"))
'This will ensure the log resources are released when
'the debugger shuts down
Trace.AutoFlush = True
Trace.WriteLineIf(result = True, "You entered a valid string")
Application Log Requires Administrator
Writing to the application log requires administrative privileges. If you run Windows Vista or Windows 7 and you have the User Account Control active on your system, you should also run Visual Studio 2012 as an administrator.
The preceding code creates a new entry in the application log of the operating system. Figure 5.20 shows the content of the application log, which is reachable via the Event viewer shortcut of the Administrative tools menu.
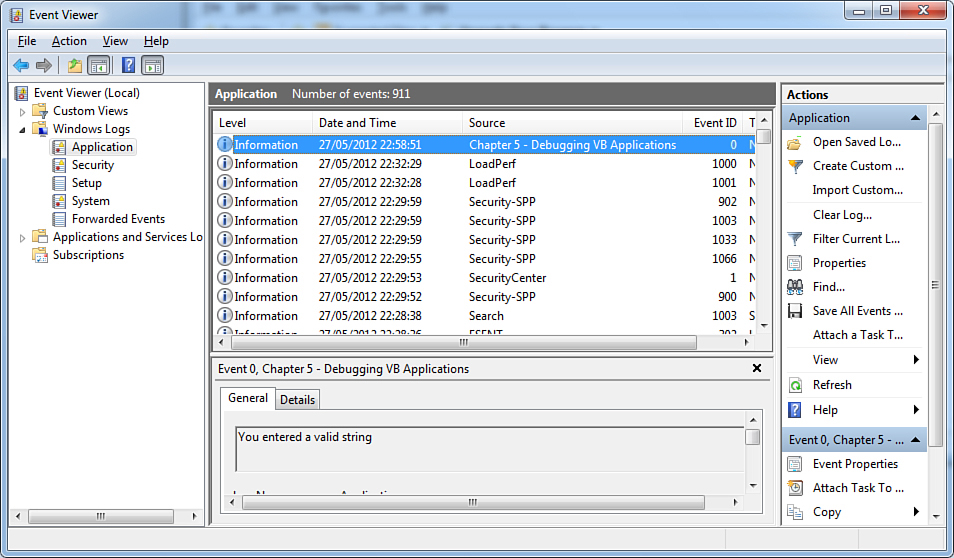
Figure 5.20. Windows’s Event viewer shows the application log containing our debug output.
My.Application.Log
Visual Basic 2012 offers an alternative to the EventLogTraceListener that is provided by the My namespace. As you see in Chapter 19, “The My Namespace,” an object named My.Application.Log provides a simpler way for writing the trace output to the application log.
The last listener object is named ConsoleTraceListener and enables sending messages to the Console window. You use this object as the previous ones. At this point we should focus on an important feature of listeners: Hard-coding listeners in Visual Basic code is not mandatory. The good news is that you can add listeners to a configuration file that can be manually edited externally from Visual Studio.
Setting Listeners in Configuration Files
To set listeners to a configuration file, first you need one. In Solution Explorer, right-click the project name and then select the Add New Item command from the pop-up menu. When the Add New Item dialog box appears, you can search for the Application Configuration File template using the search box, as shown in Figure 5.21.
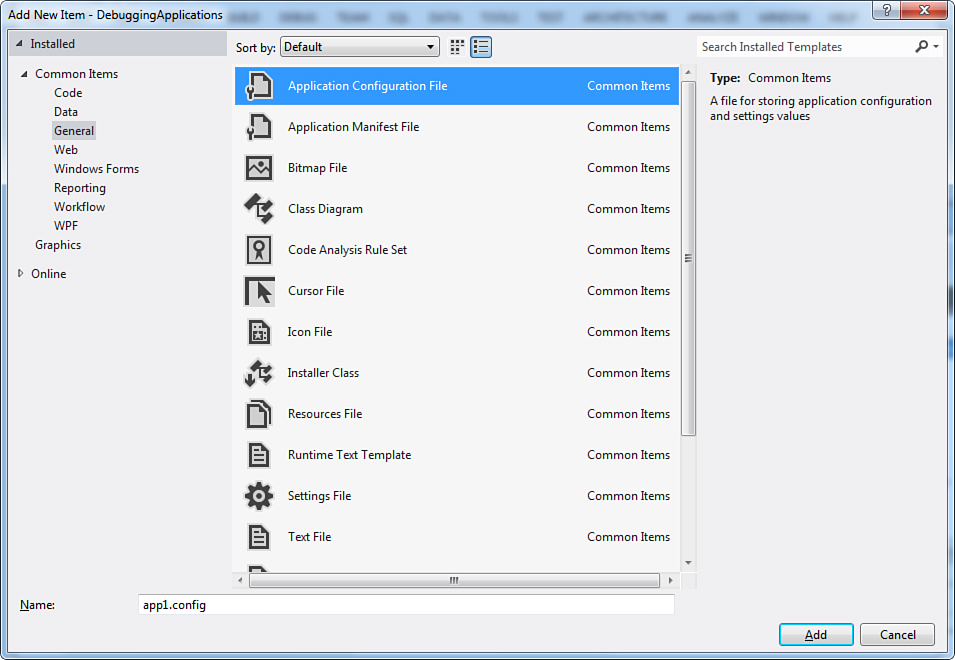
Figure 5.21. Adding a new configuration file to the project.
If you now double-click the configuration file in Solution Explorer, you notice a section that is named System.Diagnostics, as in the following snippet:
<system.diagnostics>
<sources>
<source name="DefaultSource" switchName="DefaultSwitch">
<listeners>
<add name="FileLog"/>
</listeners>
</source>
</sources>
<switches>
<add name="DefaultSwitch" value="Information" />
</switches>
</system.diagnostics>
This section represents the same-named namespace and offers the capability to specify trace listeners. By default, a DefaultTraceListener is added. This can be understood examining the preceding code snippet. You might also add other listeners, such as a TextWriterTraceListener or an XmlWriterTraceListener. The following code snippet shows how you can add a TextWriterTraceListener to the App.config file, remembering that it must be nested into the System.Diagnostics node:
<trace autoflush="true">
<listeners>
<add name="DemoTestWriter"
type="System.Diagnostics.TextWriterTraceListener"
initializeData="output.txt"/>
<!-- If you want to disable the DefaultTraceListener-->
<remove name="Default"/>
</listeners>
</trace>
As you can see, you need to supply a name, the type (that is, the class name), and the output file. The following code snippet shows instead how you can add an XmlWriterTraceListener:
<trace autoflush="true">
<listeners>v
<add name="DemoTestWriter"
type="System.Diagnostics.XmlWriterTraceListener"
initializeData="output.xml"/>
<!-- If you want to disable the DefaultTraceListener-->
<remove name="Default"/>
</listeners>
</trace>
Of course, using configuration file is optional. This could be a good choice if another person who cannot edit your source code should change how the debugger information is collected because the configuration file can be edited externally from Visual Studio.
Using Debug Attributes in Your Code
In the section “’Just My Code’ Debugging,” I explained how some attributes can influence the debugger’s behavior versus autogenerated code and that you can use that versus your own code. The .NET Framework also provides other attributes you can use to decorate your code for deciding how the debugger should behave versus such code. Table 5.4 lists other attributes that complete the list in Table 5.1.
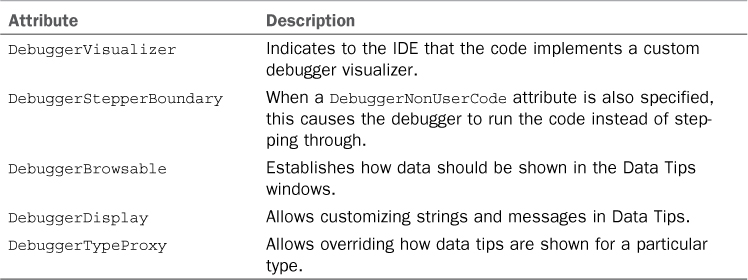
As previously described in this chapter, discussing custom debugger visualizers is beyond the scope of this book, so the DebuggerVisualizer attribute is not discussed here.
The previous attributes are effectively used and useful when debugging the application from within Visual Studio. When you compile the application in Release mode, debug attributes are ignored and do not affect your code at runtime.
DebuggerStepperBoundary
This attribute is used only in multithreading scenarios and has effects only when a DebuggerNonUserCode is also specified. It is used to run code instead of stepping through it when you are stepping into user code that does not actually relate to the thread you were debugging. Due to its particular nature, this attribute is not discussed in detail. The MSDN Library provides additional information at this address: http://msdn.microsoft.com/en-us/library/system.diagnostics.debuggerstepperboundaryattribute(v=vs.110).aspx.
DebuggerBrowsable
You can use the DebuggerBrowsable attribute to establish how an item should be visualized in Data Tips or variables windows by specifying one of the following arguments exposed by the System.Diagnostics.DebuggerBrowsableState enumeration:
• Collapsed, which establishes that an item is collapsed and that you have to click the + symbol to expand it and see its children elements
• Never, which causes the specified item to never be visible in windows such as Autos and Locals
• RootHidden, which forces the debugger to show just the children elements of the specified item
For example, consider the following code snippet that retrieves an array of processes (each represented by an instance of the System.Diagnostics.Process class):
<DebuggerBrowsable(DebuggerBrowsableState.RootHidden)>
Private ProcessesList As Process()
Sub ShowProcesses()
ProcessesList = Process.GetProcesses
End Sub
The preceding code causes the debugger to show only the children element of the array, excluding the root (ProcessesList), as shown in Figure 5.22.
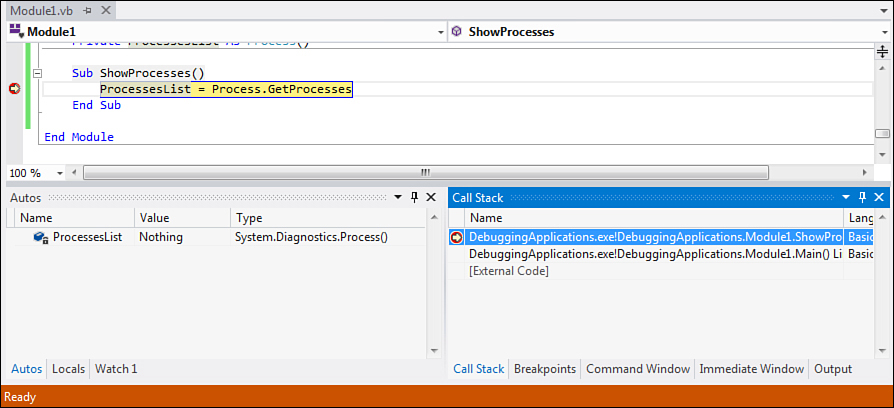
Figure 5.22. Using DebuggerBrowsable, you can establish how an object can be shown in debugger windows.
DebuggerDisplay
The DebuggerDisplay attribute also enables you to establish how an item should be shown inside Data Tips. With this attribute, you can replace Visual Studio default strings and customize the description for an object within Data Tips. For example, imagine you have the code shown in Listing 5.3, in which a Person class and code creates a list of people.
Listing 5.3. Using the DebuggerDisplay Attribute
Module Module1
Sub Main()
Dim p As New List(Of Person)
p.Add(New Person With {.FirstName = "Alessandro", .LastName = "Del Sole"})
p.Add(New Person With {.FirstName = "MyFantasyName",
.LastName = "MyFantasyLastName"})
Console.ReadLine()
End Sub
End Module
<DebuggerDisplay("This person is {FirstName} {LastName}")>
Class Person
Property FirstName As String
Property LastName As String
End Class
At this point, it’s not important to focus on how collections of objects are created. However, it’s interesting to understand what the DebuggerDisplay attribute does. Now place a breakpoint on the Console.ReadLine statement and then run the application. If you pass the mouse pointer over the p object, Data Tips for this object will be activated. The debugger then displays data formatted the way we described in the DebuggerDisplay attribute. Figure 5.23 shows the result of our customization.
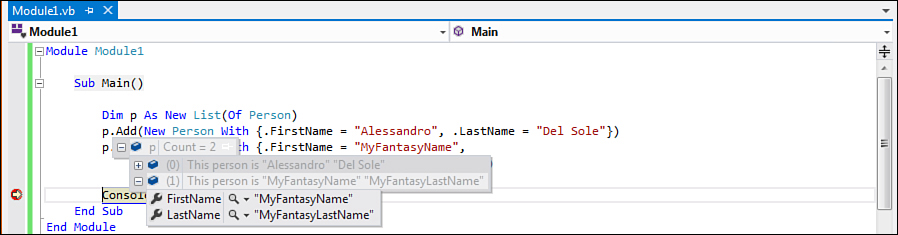
Figure 5.23. The DebuggerDisplay attribute enables customizing Data Tips messages.
DebuggerTypeProxy
As its name implies, the DebuggerTypeProxy enables you to override how debug information for a specific data type is shown within Data Tips. Listing 5.4 shows how you can implement such an attribute.
Listing 5.4. Using the DebuggerTypeProxy Attribute
Module Module1
Sub Main()
Dim p As New List(Of Person)
p.Add(New Person With {.FirstName = "Alessandro", .LastName = "Del Sole"})
p.Add(New Person With {.FirstName = "MyFantasyName",
.LastName = "MyFantasyLastName"})
Console.ReadLine()
End Sub
End Module
<DebuggerTypeProxy(GetType(PersonProxy))>
Class Person
Property FirstName As String
Property LastName As String
End Class
Class PersonProxy
Dim myProxy As Person
Sub New(ByVal OnePerson As Person)
myProxy = OnePerson
End Sub
ReadOnly Property Length As Integer
Get
Return String.Concat(myProxy.FirstName, " ", myProxy.LastName).Length
End Get
End Property
End Class
The PersonProxy class gets the instance of the Person class being debugged, reads the information from such instance, and returns via the Length property the length of the string composed by the FirstName and LastName properties. The Length property here is a basic example, but it is useful to understand where the real proxy is. To activate the proxy, you need to decorate the Person class with the DebuggerTypeProxy attribute whose argument is the Type representation of what you need to debug. This type is retrieved using a GetType keyword. If you now try to run the application, you can see that the debugger can display the new Length information, as shown in Figure 5.24.
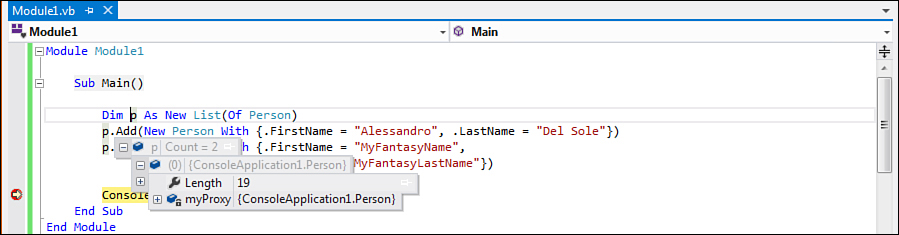
Figure 5.24. The DebuggerTypeProxy enables customizing the debug information.
So you now have a powerful way to customize debug information.
Summary
Debugging is a primary task in developing applications. The Visual Studio 2012 IDE offers lots of useful tools that can enhance the debugging experience. In this chapter, you learned what Just My Code is and then learned how you can work with breakpoints and trace points, passing through debugging in steps. You also saw the debugger windows in action, enabling deep control over variables and objects. In the end, you learned how to customize your own code to take advantage of the Visual Studio debugging tools by decorating your code with debug attributes. But debugging is just one part in the development process that fights against errors. Exceptions are the other part, and they are discussed in Chapter 6, “Handling Errors and Exceptions.”