
14
Tracking Performance
Posting a video to YouTube is just the start of the marketing process. You need to judge how effective that video is—how many viewers it attracts and how many sales result from those viewers.
Fortunately, YouTube provides a number of metrics you can use to track the performance of each video you post. Read on to learn more.
Why Tracking Is Important
Why should you bother tracking the performance of your YouTube videos? For the same reasons you track the performance of other parts of your marketing mix—to fine-tune your activities to have bigger impact, to measure the effectiveness of your efforts, and to learn from your efforts when planning future activities.
Let’s look at each reason individually.
Fine-Tuning Your Efforts
You don’t have to wait until the end of a campaign to track its performance. In fact, it’s a good idea to look at what’s happening while it’s happening so that you can make any mid-course corrections that might be necessary.
Let’s say, for example, that you launch a series of YouTube videos but discover, after the first few weeks, that viewership is much less than what you anticipated. Why is this? What do you do about it?
Can you tweak upcoming videos to make them more attractive to potential viewers? These are all questions you can answer now, without having to wait until the end of the campaign. Track the performance and make necessary changes along the way—this is how you get the most out of any marketing campaign.
Measuring Effectiveness
At the conclusion of the campaign, you need to measure just how effective it was. Did the campaign meet your goals? Did you achieve the view-ership you wanted? Was there the expected increase in sales? And if not, why not?
You need to apply the same sort of scrutiny to your YouTube activities as you do to any marketing campaign. That means setting goals beforehand, and then measuring the actual performance against those goals. Just as important, you need to analyze the results to see why your videos under- or over-performed against expectations. Set a goal, measure performance, and then analyze that performance—that’s Marketing 101.
Planning Future Activities
Finally, you need to learn from your YouTube activities. If your first campaign bombed, figure out why and apply that knowledge to your next campaign. If the campaign was a success, determine what contributed to that success, so you can replicate it in future efforts. Each activity you engage in should be a learning experience that informs the next activity, and the one after that. Don’t repeat your mistakes—and don’t abandon your successes.
Tracking Basic Viewership
Fortunately, YouTube makes tracking basic metrics somewhat easy, thanks to several online tracking tools. You use these tools to track viewer-ship of your videos, as well as reveal other important statistics.
YouTube’s first tool for tracking the performance of a video is located right on the page for each video, on the Statistics & Data tab just below the video player. When you click this tab, you see a variety of statistics, as shown in Figure 14.1.
Figure 14.1 Tracking viewership on the Statistics & Data tab of a video page.

The provided statistics and information include
• Views —The total number of times the video has been viewed
• Ratings —The number of users who have rated the video
• Responses —The number of video responses left for this video
• Comments —The number of text comments left about this video
• Favorites —The number of users who have added this video to their favorites list
• Honors for this video
• Sites linking to this video
• Recording date and location
The Statistics & Data tab gives you a quick look at how this video is performing. Particularly useful is the Views metric, which tells you precisely how many times the video has been watched. I also like the list of sites that link back to the video, which includes a count of the actual clicks made from that site to your video on the YouTube site.
When it comes to judging performance, how many views is a good number? That’s hard to say. Certainly, if your video gets a million views overnight, you’re doing something right—that’s pure viral status. But for particular types of videos and businesses, 100 views might be good (for example, if you’re selling high-priced real estate). You have to judge performance based on your own parameters and with realistic expectations.
Tip |
It’s particularly useful to compare views for all the videos in your library. Although raw numbers might not tell you much, comparative numbers tell you which of your videos are performing best and which might need replaced. |
Gaining Insight
If you want more detailed performance metrics, you can turn to YouTube’s newest analytical tool, dubbed Insight. The Insight tool enables you to view detailed statistics about each video you’ve uploaded. You can drill down through the data to view activity by geographic region over selected periods; you can even compare the popularity of your video to other videos in that region.
To access the Insight tool, click Account, My Videos to display your entire list of uploaded videos. Next to each video, as you can see in Figure 14.2, is an Insight button; click it to display the Insight page.
Figure 14.2 Click the Insight button to analyze a video’s performance.

The Insight page for each video includes three tabs: Views, Popularity, and Discovery. Each tab displays a particular type of information, as discussed next.
Insight Views
The Views tab, shown in Figure 14.3, presents a graphical display of the number of views for your video, both over time and by region.
Figure 14.3 Using the Views tab to analyze the view count for a video by time and region.

The left graph displays the number of views over the designated period. You can expand or contract the graph to show views for the past 5 days, 1 month, 3 months, 6 months, 1 year, or total video life (Max). After you choose a length, you can use the slider beneath the graph to show performance for other periods in the life of the video.
Note |
YouTube’s view count data includes views of the video on the YouTube site as well as views from other sites that embed the video. |
The right graph is a map of the world, with the number of views for your video displayed in different colors for each region. To select a specific country, click that country on the map. To select a larger region, select that region from the pull-down list beneath the graph.
Note |
Insight analyzes performance for the following regions: U.S.A., Asia, Africa, Europe, Middle East, and South America. |
When you select a country or region, the view count for that area appears in the left graph. You can return that graph to a combined worldview by clicking the Back to All Countries link.
Insight Popularity
When you want to compare the popularity of your video with other videos in a given country or region, go to the Popularity tab. As you can see in Figure 14.4, this tab has a two-graph display similar to that on the Views tab. What differs is that the left graph charts the popularity of the video as compared to other videos in the selected region or country.
Figure 14.4 Using the Popularity tab to compare the popularity of a video with other videos in the selected region.
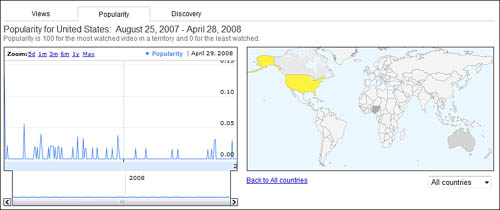
In this instance, a popularity index measures the video’s popularity; the index is like the percentile rankings you find in standard test scores. In this scheme, the most watched video has a ranking of 100, whereas the least watched video has a ranking of 0.
For example, a video with a popularity index of 50 is more popular than 50% of the videos in that region, and a video with an index of 75 is more popular than 75% of other videos. Few videos achieve this type of index score, however; your video is more likely to have an index ranking in the single digits or below.
As with the Views tab, you can view the popularity index by specific time frame (5 days, 1 month, 3 months, and so on) and by specific country or region. Select the time frame in the left graph and the country/region in the map on the right.
Note |
On the Popularity map, the country where the video is most popular is dark green, whereas the country where it’s least popular is light green. |
Insight Discovery
Insight’s Discovery tab, shown in Figure 14.5, tells you how viewers discovered your video. This is a great way to determine where to put your promotional efforts.
Figure 14.5 Using the Discovery tab to determine how viewers are finding your videos.
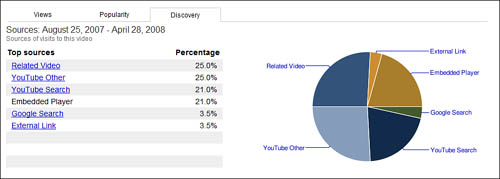
The table on the left lists the top sources where your video was discovered. These methods include the following:
• Related videos
• YouTube search
• Embedded players (your video embedded on other sites)
• Google search
• Other links on the YouTube site
The pie chart on the right displays the discovery methods visually. This makes it easier to compare each discovery method, on a percentage basis.
Click a particular discovery method in the table or the pie chart, and you see a list of specific items related to that method. For example, if you click the YouTube Search link, you receive a list of the top search queries that found your video; further click a query link to see all the results for that query, and where your video appears on the results list.
I think the Insight Discovery tool is the most important one in the entire toolkit. It’s key in determining how viewers find your videos; until you know this information, it’s impossible to determine how to promote your YouTube videos. For example, if you find that the majority of viewers discover a video by searching on Google, you know that you need to optimize future videos for Google search. In this instance, you’re further empowered by Insight’s listing of what keywords your viewers searched for. With this knowledge in hand, you can make sure to include the most popular keywords in the descriptions of subsequent YouTube videos.
Alternatively, you can use the Discovery tool to determine why a particular video performs less well than others. Look at how viewers did (or, more important, didn’t) find a less-viewed video, and you’ll find out areas where you need to improve. If, for example, a video didn’t pull well via Google search, you know that you need to pay more attention to keywords in future video descriptions. The key is to determine how viewers find out about your videos and then exploit that information.
Tracking Effectiveness
The number of views a video obtains isn’t necessarily indicative of how effective it is. A video might gain huge viewership but result in few sales or little brand awareness; conversely, a video with a small number of viewers might result in much higher sales or brand awareness.
Tracking the effectiveness of a video is more difficult than tracking simple viewership. No analytical tools measure this metric; in fact, it’s more of a black art than it is a science. With that caveat, there are ways to get a general handle on how effective a video is.
Tracking Interactivity
One measure of effectiveness is how well the video involves the viewers— that is, how viewers interact with the video. You can deduce the level of interaction from the number of comments and video responses left by viewers. The more that the video draws in viewers, the more viewers leave personal comments and responses.
Think of it this way. If your video is just light entertainment, viewers will likely not be inspired to leave comments. If, on the other hand, your video proves particularly useful or educational, viewers are more likely to leave comments to that effect. The more comments you get, the better the video is at involving the viewer.
On a meta level, you can track the effectiveness of all your videos in total by noting the number of subscribers you get to your YouTube channel. If your videos connect with viewers, they’re more likely to subscribe to your channel to get notice of future videos. If your videos are less effective, viewers are less likely to subscribe.
Tracking Traffic
If you’re using your YouTube videos to sell products or services directly from your website, the best way to measure the effectiveness of each video is simply to track traffic from each YouTube video back to your site. There are a number of ways to do this.
Most website-hosting services provide their own traffic analysis tools. You can also use a third-party tool, such as Blizzard Tracker (www. blizzardtracker.com), GoStats (www.gostats.com), and Opentracker (www.opentracker.net). Also good is Google’s own Google Analytics tool (www.google.com/analytics/), shown in Figure 14.6; it is a robust and totally free analysis tool that any website can use.
Figure 14.6 Using Google Analytics or a similar tool to analyze your website’s incoming traffic.
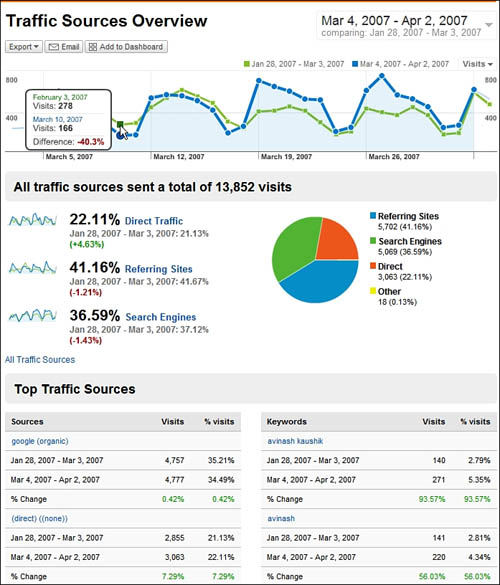
Just about any website analysis tool will show where your site traffic comes from—that is, the previous sites viewed by your site’s visitors. By using this type of tool, it’s easy enough to track the traffic from the YouTube site (www.youtube.com) to your site. If you see a spike in traffic from YouTube after you post a new video, it’s a good bet that the traffic was driven by that video.
More sophisticated website analysis tools track traffic from specific pages on the originating site. This makes it even easier to determine which videos are driving the most traffic back to your site.
Alternatively, you can include a special code for each video you upload to YouTube. The easiest way to do this is to display a unique URL for your main site in each YouTube video; the URL should lead to a unique landing page on your website. For example, you might create a series of landing pages for each of your videos, with URLs such as www.yourwebsite.com/youtubepromo01/, www.yourwebsite.com/youtubepromo02/, www.yourwebsite.com/youtubepromo03/, and so on. This makes it easy to track hits on each specific landing page, providing a detailed analysis of the effectiveness of each originating video.
Tip |
If you upload videos to multiple video-sharing sites, several services can help you both upload your videos and track each site’s relative performance. The most popular of these video syndication/analysis services includes TubeMogul (www.tubemogul.com) and Vidmetrix (www.vidmetrix.com). |
Tracking Direct Sales
Ultimately, the best measure of a video’s effectiveness is how many sales directly result from the viewing of that video. Determining which sales result from which videos is a simple tracking issue. Assign each video a special tracking code and include that code in the video’s text description and onscreen information screen. Encourage customers to enter that tracking code on your product purchase or checkout page, and you know from which video the sale came from.
What’s a good conversion rate? That’s entirely within your judgment; for some companies, converting 1 sale per 100 views is good performance, whereas other companies might be satisfied with a 1 in 10,000 conversion rate. It all depends on the type of product you sell.
In any instance, the total number of conversions might be less important than comparing the conversion rates of different videos. If one video has a 0.1% conversion rate and another a 0.5% rate, you know that second video is five times more effective than the first one. Knowing that, you can then analyze the why behind the numbers—what it was about that second video that drove more viewers to become paying customers.
With this knowledge in hand, you can better focus future videos to include the elements that made the second video more effective. And that’s the key: To learn from what you’ve done to become more successful going forward.