Day 25 Verifying and Troubleshooting Basic Switch Configurations
CCNA 640-802 Exam Topics
![]() Verify network status and switch operation using basic utilities (including ping, traceroute, telnet, SSH, ARP, ipconfig), and show and debug commands.
Verify network status and switch operation using basic utilities (including ping, traceroute, telnet, SSH, ARP, ipconfig), and show and debug commands.
![]() Identify, prescribe, and resolve common switched network media issues, configuration issues, autonegotiation, and switch hardware failures.
Identify, prescribe, and resolve common switched network media issues, configuration issues, autonegotiation, and switch hardware failures.
![]() Interpret the output of various show and debug commands to verify the operational status of a Cisco switched network.
Interpret the output of various show and debug commands to verify the operational status of a Cisco switched network.
Key Points
In the days to come, we will review the configuration, verification, and troubleshooting tasks associated with VLANs, trunking, VLAN Trunking Protocol (VTP), Spanning Tree Protocol (STP) and inter-VLAN routing. Today we focus on troubleshooting skills associated with basic switch configuration including verifying network connectivity, interpreting commands that display the status of interfaces, and using Cisco Discovery Protocol (CDP).
Troubleshooting Methodology
Day 29, “Network Data Flow from End-to-End,” discussed the three approaches to troubleshooting your network based on the layers of the OSI model: bottom up, top down, and divide and conquer. Regardless of the method you use, here are some general suggestions to make your troubleshooting more effective:
![]() Understand normal switch operation: No amount of studying can replace hands-on experience. Hopefully, you have already spent many hours configuring switches, at least in a lab environment or on a simulator. The configuration guides at Cisco.com will help fill in any gaps in your experience.
Understand normal switch operation: No amount of studying can replace hands-on experience. Hopefully, you have already spent many hours configuring switches, at least in a lab environment or on a simulator. The configuration guides at Cisco.com will help fill in any gaps in your experience.
![]() Create accurate physical and logical maps: Because a switch can create different segments by implementing VLANs, the physical connections alone do not tell the whole story. You must know how the switches are configured to determine which segments (VLANs) exist and how they are logically connected.
Create accurate physical and logical maps: Because a switch can create different segments by implementing VLANs, the physical connections alone do not tell the whole story. You must know how the switches are configured to determine which segments (VLANs) exist and how they are logically connected.
![]() Have a plan: Before jumping to conclusions, try to verify in a structured way what is working and what is not. Because networks can be complex, it is helpful to isolate possible problem domains. For example, can all devices on the same LAN ping each other? Assuming that the switch is configured correctly, many of the problems you encounter will be related to physical layer issues (physical ports and cabling). Layer 2 issues could be the problem as well, however. The point is to have a plan for where to start—Layer 1 or Layer 2—and then solve all the problems at that layer before moving on.
Have a plan: Before jumping to conclusions, try to verify in a structured way what is working and what is not. Because networks can be complex, it is helpful to isolate possible problem domains. For example, can all devices on the same LAN ping each other? Assuming that the switch is configured correctly, many of the problems you encounter will be related to physical layer issues (physical ports and cabling). Layer 2 issues could be the problem as well, however. The point is to have a plan for where to start—Layer 1 or Layer 2—and then solve all the problems at that layer before moving on.
![]() Assume nothing: Do not assume basic components are working correctly without testing them first. It usually takes only a minute to verify the basics (for example, that the ports are correctly connected and active), and it can save you valuable time.
Assume nothing: Do not assume basic components are working correctly without testing them first. It usually takes only a minute to verify the basics (for example, that the ports are correctly connected and active), and it can save you valuable time.
The following steps outline a general troubleshooting method that can be used with any problem in the network. This is the method used in Wendell Odom’s books in the CCNA Official Exam Certification Library, Third Edition:
Step 1 Analyzing/predicting normal operation.
Predict the details of what should happen if the network is working correctly, based on documentation, configuration, and show and debug command output.
Step 2 Problem isolation.
Determine how far along the expected path the frame/packet goes before it cannot be forwarded any further, again based on documentation, configuration, and show and debug command output.
Step 3 Root cause analysis.
Identify the underlying causes of the problems identified in the preceding step—specifically, the causes that have a specific action with which the problem can be fixed.
Following this process requires a variety of learned skills. You need to remember the theory of how networks should work, as well as how to interpret the show command output that confirms how the devices are currently behaving. This process requires the use of testing tools, such as ping and traceroute, to isolate the problem. Finally, this approach requires the ability to think broadly about everything that could affect a single component.
For our purposes today, we are going to assume that all the Layer 3 potential problems have been ruled out so we can focus on Layer 2 and Layer 1 issues. In a switched LAN, you will most likely need to determine some or all of the following:
![]() MAC addresses of devices involved (PCs and router interfaces)
MAC addresses of devices involved (PCs and router interfaces)
![]() Switch interfaces that are in use
Switch interfaces that are in use
![]() Status of switch interfaces
Status of switch interfaces
![]() Expected behavior from source to destination
Expected behavior from source to destination
Verifying Network Connectivity
Using and interpreting the output of various testing tools is often the first step in isolating the cause of a network connectivity issue. The ping command can be used to systematically test connectivity in the following manner:
![]() Can an end device ping itself?
Can an end device ping itself?
![]() Can an end device ping its default gateway?
Can an end device ping its default gateway?
![]() Can an end device ping the destination?
Can an end device ping the destination?
By using the ping command in this ordered sequence, you can isolate problems quicker. If local connectivity is not an issue—in other words, the end device can successfully ping its default gateway—using the traceroute utility can help isolate at what point in the path from source to destination that the traffic stops.
As a first step in the testing sequence, verify the operation of the TCP/IP stack on the local host by pinging the loopback address, 127.0.0.1, as demonstrated in Example 25-1.
Example 25-1 Testing the TCP/IP Stack on a Windows PC
C:>ping 127.0.0.1
Pinging 127.0.0.1 with 32 bytes of data:
Reply from 127.0.0.1: bytes=32 time<1ms TTL=64
Reply from 127.0.0.1: bytes=32 time<1ms TTL=64
Reply from 127.0.0.1: bytes=32 time<1ms TTL=64
Reply from 127.0.0.1: bytes=32 time<1ms TTL=64
Ping statistics for 127.0.0.1:
Packets: Sent = 4, Received = 4, Lost = 0 (0% loss),
Approximate round trip times in milli-seconds:
Minimum = 0ms, Maximum = 0ms, Average = 0ms
Because this test should succeed regardless of whether the host is connected to the network, a failure indicates a software or hardware problem on the host itself. Either the network interface is not operating properly, or possibly support for the TCP/IP stack has been inadvertently removed from the operating system.
Next, verify connectivity to the default gateway. Determine the default gateway address using ipconfig and then attempt to ping it, as demonstrated in Example 25-2.
Example 25-2 Testing Connectivity to the Default Gateway on a Windows PC
C:>ipconfig
Windows IP Configuration
Ethernet adapter Local Area Connection:
Connection-specific DNS Suffix . : cisco.com
IP Address. . . . . . . . . . . . : 192.168.1.25
Subnet Mask . . . . . . . . . . : 255.255.255.0
Default Gateway . . . . . . . . . : 192.168.1.1
C:>ping 192.168.1.1
Pinging 192.168.1.1 with 32 bytes of data:
Reply from 192.168.1.1: bytes=32 time=162ms TTL=255
Reply from 192.168.1.1: bytes=32 time=69ms TTL=255
Reply from 192.168.1.1: bytes=32 time=82ms TTL=255
Reply from 192.168.1.1: bytes=32 time=72ms TTL=255
Ping statistics for 192.168.1.1:
Packets: Sent = 4, Received = 4, Lost = 0 (0% loss),
Approximate round trip times in milli-seconds:
Minimum = 69ms, Maximum = 162ms, Average = 96ms
Failure here can indicate several problems, each of which will need to be checked in a systematic sequence. One possible order might be the following:
-
Is the cabling from the PC to the switch correct? Are link lights lit?
-
Is the configuration on the PC correct according to the logical map of the network?
-
Are the affected interfaces on the switch the cause of the problem? Is there a duplex or speed mismatch? VLAN misconfigurations?
-
Is the cabling from the switch to the router correct? Are link lights lit?
-
Is the configuration on the router interface correct according to the logical map of the network? Is the interface active?
Finally, verify connectivity to the destination by pinging it. Assume we are trying to reach a server at 192.168.3.100. Example 25-3 shows a successful ping test to the destination.
Example 25-3 Testing Connectivity to the Destination on a Windows PC
PC>ping 192.168.3.100
Pinging 192.168.3.100 with 32 bytes of data:
Reply from 192.168.3.100: bytes=32 time=200ms TTL=126
Reply from 192.168.3.100: bytes=32 time=185ms TTL=126
Reply from 192.168.3.100: bytes=32 time=186ms TTL=126
Reply from 192.168.3.100: bytes=32 time=200ms TTL=126
Ping statistics for 192.168.3.100:
Packets: Sent = 4, Received = 4, Lost = 0 (0% loss),
Approximate round trip times in milli-seconds:
Minimum = 185ms, Maximum = 200ms, Average = 192ms
Failure here would indicate a failure in the path beyond the default gateway interface because we already successfully tested connectivity to the default gateway. From the PC, the best tool to use to find the break in the path is the tracert command, as demonstrated in Example 25-4.
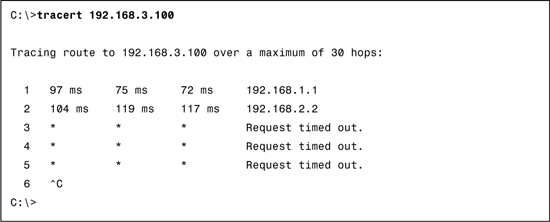
Note The reason for failure at hops 3, 4, and 5 in Example 25-4 could be that these routers are configured to not send ICMP messages back to the source.
The last successful hop on the way to the destination was 192.168.2.2. If you have administrator rights to 192.168.2.2, you could continue your research by remotely accessing the command line on 192.168.2.2 and investigating why traffic will not go any further. Also, other devices between 192.168.2.2 and 192.168.3.100 could be the source of the problem. The point is, you want to use your ping and tracert tests as well as your network documentation to proceed in logical sequence from source to destination.
Regardless of how simple or complex your network is, using ping and tracert from the source to the destination is a simple, yet powerful, way to systematically test connectivity and locate breaks in a path from one source to one destination.
Interface Status and the Switch Configuration
Because today we are focusing on switch troubleshooting, let’s look at the show commands that are helpful in troubleshooting your basic configuration.
Interface Status Codes
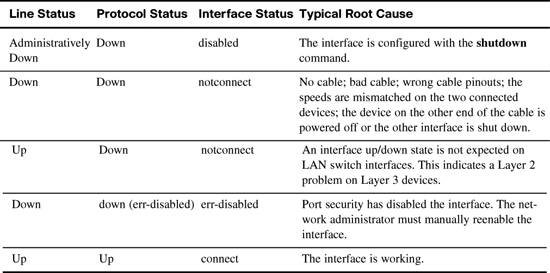
In general, interfaces are either “up” or “down.” However, when an interface is “down” and you don’t know why, the code in the show interfaces command provides more information to help you determine the reason. Table 25-1 lists the code combinations and some possible causes for the status indicated.
Duplex and Speed Mismatches
One of the more common problems is issues with speed and/or duplex mismatches. On switches and routers, the speed {10 | 100 | 1000} interface subcommand and the duplex {half | full} interface subcommand set these values. Note that configuring both speed and duplex on a switch interface disables the IEEE-standard autonegotiation process on that interface.
The show interfaces status and show interfaces commands list both the speed and duplex settings on an interface, as shown in Example 25-5.

Notice that both commands will show the duplex and speed settings of the interface. However, the show interface status command is preferred for troubleshooting duplex or speed mismatches because it shows exactly how the switch determined the duplex and speed of the interface. In the duplex column, a-full means the switch autonegotiated full duplex. The setting full or half means that the switch was configured at that duplex setting. Autonegotiation has been disabled. In the speed column, a-100 means the switch autonegotiated 100 Mbps as the speed. The setting 10 or 100 means that the switch was configured at that speed setting.
Finding a duplex mismatch can be much more difficult than finding a speed mismatch, because if the duplex settings do not match on the ends of an Ethernet segment, the switch interface will still be in a connect (up/up) state. In this case, the interface works, but the network may work poorly, with hosts experiencing poor performance and intermittent communication problems. To identify duplex mismatch problems, check the duplex setting on each end of the link, and watch for incrementing collision and late collision counters.
Common Layer 1 Problems On “Up” Interfaces
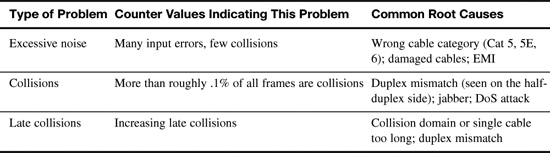
When a switch interface is “up”, it does not necessarily mean that the interface is operating in an optimal state. For this reason, IOS will track certain counters to help identify problems that can occur even though the interface is in a connect state. These counters are highlighted in the output in Example 25-5. Table 25-2 summarizes three general types of Layer 1 interface problems that can occur while an interface is in the “up,” connected state.
CDP as a Troubleshooting Tool
CDP discovers basic information about directly connected Cisco routers and switches by sending CDP messages. Example 25-6 shows the output from a switch that is directly connected to a Cisco router.

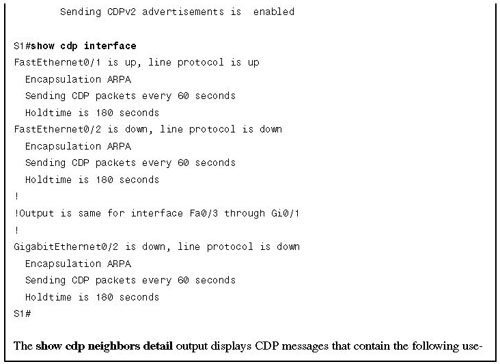
ful information:
![]() Device ID: Typically the hostname
Device ID: Typically the hostname
![]() Entry address(es): Network and data-link addresses
Entry address(es): Network and data-link addresses
![]() Platform: The model and OS level running in the device
Platform: The model and OS level running in the device
![]() Capabilities: Information on what type of device it is (for instance, a router or a switch)
Capabilities: Information on what type of device it is (for instance, a router or a switch)
![]() Interface: The interface on the router or switch issuing the show cdp command with which the neighbor was discovered
Interface: The interface on the router or switch issuing the show cdp command with which the neighbor was discovered
![]() Port ID: Text that identifies the port used by the neighboring device to send CDP messages to the local device
Port ID: Text that identifies the port used by the neighboring device to send CDP messages to the local device
Also notice in the show cdp interface command that every interface on the switch is sending CDP messages every 60 seconds. CDP is enabled by default and, thus, creates a security issue because CDP messages can be intercepted and network information discovered. CDP can easily be disabled both globally for the entire device (no cdp run) or individually by interface (no cdp enable).