
We will extend the app that we developed in the last chapter with advanced functionalities and modularized code refactoring. Let's create a custom widget in the app that does the following:
- Allows the user to draw a polygon on the map. The polygon will be symbolized by a semi-transparent red fill and a dashed yellow outline.
- The polygon should fetch all the major wildfire events within the boundary of the polygon.
- This shall be shown as a graphic and the data should be in a grid.
- Internationalization support must be provided.
Let's list the modules required to define classes and their corresponding intended callback function decoration.
|
Modules |
Values |
|---|---|
|
|
|
|
|
|
|
|
|
|
Modules |
Values |
|---|---|
|
|
|
|
|
|
|
Modules |
Values |
|---|---|
|
|
|
|
|
|
|
|
|
Modules |
Values |
|---|---|
|
|
|
|
|
|
|
|
|
|
|
|
|
|
|
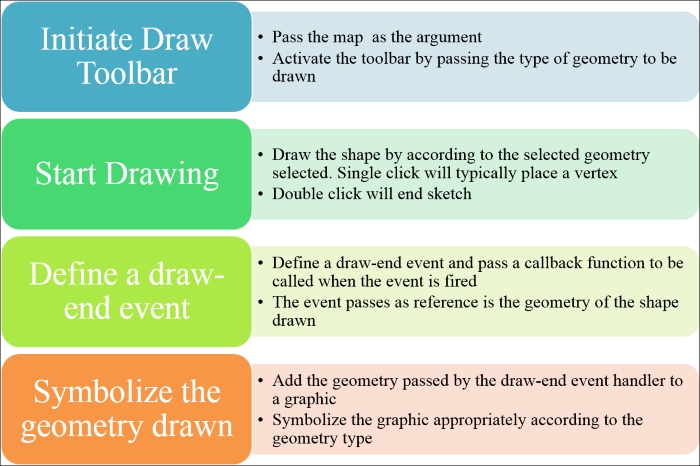
The draw toolbar enables us to draw graphics on the map. This toolbar has events associated with it. When a draw operation is completed, it returns the object drawn on the map as geometry. Follow these steps to create a graphic using the draw toolbar:
The draw toolbar is provided by the module called esri/toolbars/draw. The draw toolbar accepts the map object as an argument. Instantiate the draw toolbar within the postCreate function. The draw toolbar also accepts an additional optional argument named options. One of the properties in the options object is named showTooltips. This can be set to true so that we can see a tooltip associated while drawing. The text in the tooltip can be customized. Otherwise, a default tooltip associated with draw geometry is displayed:
return declare([_WidgetBase, _TemplatedMixin], {
    //assigning html template to template string
    templateString: dijitTemplate,
    isDrawActive: false,
    map: null,
    tbDraw: null,
    constructor: function (options, srcRefNode) {
      this.map = options.map;
    },
    startup: function () {},
    postCreate: function () {
      this.inherited(arguments);
      this.tbDraw = new Draw(this.map, {showTooltips : true});
    }
...
The draw toolbar can be activated on the click or touch event (in case of smart phones or tablets) of a button, which is intended to indicate the start of a draw event. Dojo provides a module that takes care of touch as well as click events. The module is named dijit/a11yclick.
To activate the draw toolbar, we need to provide the type of symbol to draw. The draw toolbar provides a list of constants, which corresponds to the type of the draw symbol. These constants are POINT, POLYGON, LINE, POLYLINE, FREEHAND_POLYGON, FREEHAND_POLYLINE, MULTI_POINT, RECTANGLE, TRIANGLE, CIRCLE, ELLIPSE, ARROW, UP_ARROW, DOWN_ARROW, LEFT_ARROW, and RIGHT_ARROW.
While activating the draw toolbar these constants must be used to define the type of the draw operation required. Our objective is to draw a polygon at the click of a draw button. The code is shown in the following screenshot:
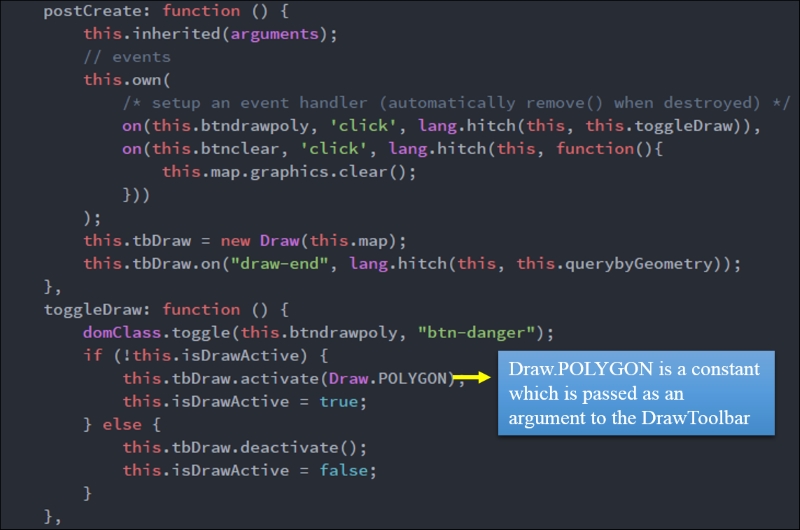
Once the draw toolbar is activated, the draw operation begins. For point geometry, the draw operation is just a single click. For a polyline and a polygon, the single click adds a vertex to the polyline, and a double-click ends the sketch. For a freehand polyline or polygon, the click and drag operation draw the geometry and a mouse-up operation ends the drawing.
When the draw operation is complete, we need an event handler to do something with the shape that was drawn by the draw toolbar. The API provides a draw-end event, which is fired once the draw operation is complete. This event handler must be connected to the draw toolbar. This event handler will be defined within the this.own() function inside the postCreate() method of the widget. The event result can be passed to a named or anonymous function:
postCreate: function () {
...
      this.tbDraw.on("draw-end", lang.hitch(this, this.querybyGeometry));
    },
...
querybyGeometry: function (evt) {
      this.isBusy(true);
      //Get the Drawn geometry
      var geometryInput = evt.geometry;
...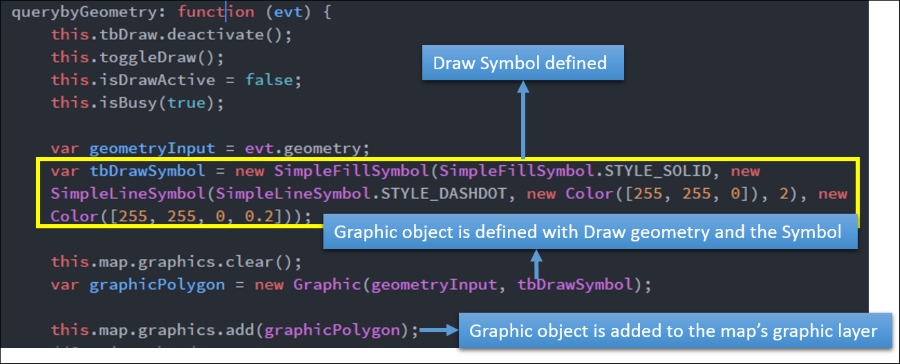
}In the draw-end event callback function, we will get the geometry of the drawn shape as the result object. To add this geometry back to the map, we need to symbolize it. A symbol is associated with the geometry that it symbolizes. Also, the styling of the symbol is defined by the colors or pictures used to fill up the symbol and its size. Just to symbolize a polygon, we need to use the SimpleFillSymbol and SimpleLineSymbol modules. We may also need the esri/color module to define the fill colors.
Let's review a snippet to understand this better. This is a simple snippet used to construct a symbol for a polygon with a semi-transparent solid red color fill and a yellow dash-dot line:
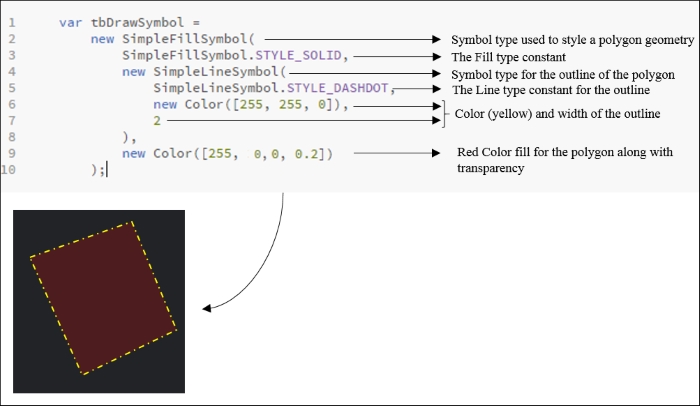
In the preceding screenshot, SimpleFillSymbol.STYLE_SOLID and SimpleLineSymbol.STYLE_DASHDOT are the constants provided by the SimpleFIllSymbol and SimpleLineSymbol modules respectively. These constants are used to style the polygon and the line.
Two colors are defined in the construction of the symbol: one for filling up the polygon and the other for coloring the outline. A color can be defined by four components. They are as follows:
- Red
- Green
- Blue
- Opacity
The red, green, and blue components takes values from 0 to 255 and the opacity takes a value from 0 to 1. A combination of red, green, and blue components can be used to produce any color according to the RGB color theory. So, to create a yellow color, we use the maximum of red component (255) and the maximum of green component (255); we don't want the blue component to contribute to our color, so we use 0. An opacity value of 0 means 100% transparency, and an opacity value of 1 means 100% opaqueness. We have used 0.2 for the fill color. This means that we need our polygon to be 20% opaque, or 80% transparent. The default value for this component is 1.
A symbol is just a generic object. This means any polygon geometry can use the symbol to render itself. Now, we need a container object to display the drawn geometry with the previously defined symbol on the map. A graphic object provided by the esri/Graphic module acts as a container object, which can accept a geometry and symbol. The graphic object can be added to the map's graphic layer.
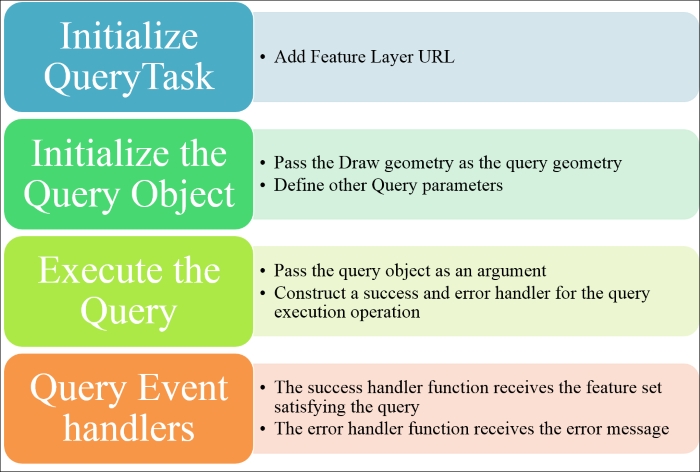
The widget's main function is to define and execute a query based on the user's draw input. The following image will provide a general way for us to construct a querytask and handle the execution:
We will be working with Active Wildfire feature layers that we used in the previous chapter. When providing the input geometry, we will be using the geometry that we got from the draw-end event instead of using the map's current extent geometry, like we did in the previous chapter. We will be fetching all the features within the draw geometry, hence we will be using the truthy expression (1=1) as the where clause. The following lines of code explain how the query object is constructed and how the queryTask is executed and stored as a deferred variable:
var queryTask = new QueryTask(this.wildFireActivityURL);
var query = new Query();
query.where = "1=1";
query.geometry = geometryInput;
query.returnGeometry = true;
query.outFields = ["FIRE_NAME", "AREA_", "AREA_MEAS"];
var queryDeferred = queryTask.execute(query);
The execute
method on the QueryTask object returns a deferred variable. This means that we should use the .then() operation to elicit the task execution result. The success handler returns a featureset. A featureset is an array of features. A feature contains a graphic as well as some attributes.
Now, there are two operations that we needs to perform to display the query results:
- Highlight the query result by symbolizing it appropriately and adding it as appropriate graphics on the map.
- Show the details of Active Wildfires satisfying the query conditions in a simple HTML table. The HTML table should come from an HTML template file.
We need an HTML template to render the widget. This widget will have the following components:
- A button whose
clickevent will toggle the draw event - A button to clear the draw graphic, as well as the result graphic and the HTML table
- A
domelement to hold onto the HTML table being constructed
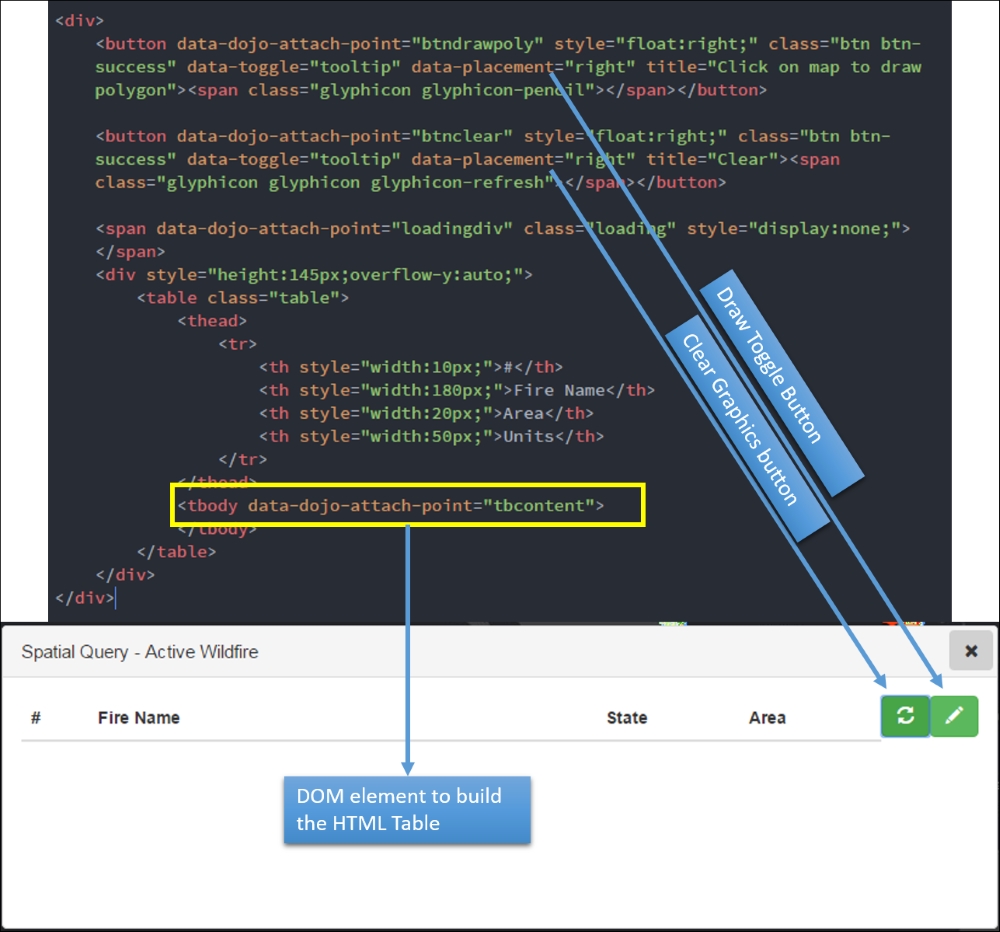
The following screenshot explains how the HTML template is constructed:
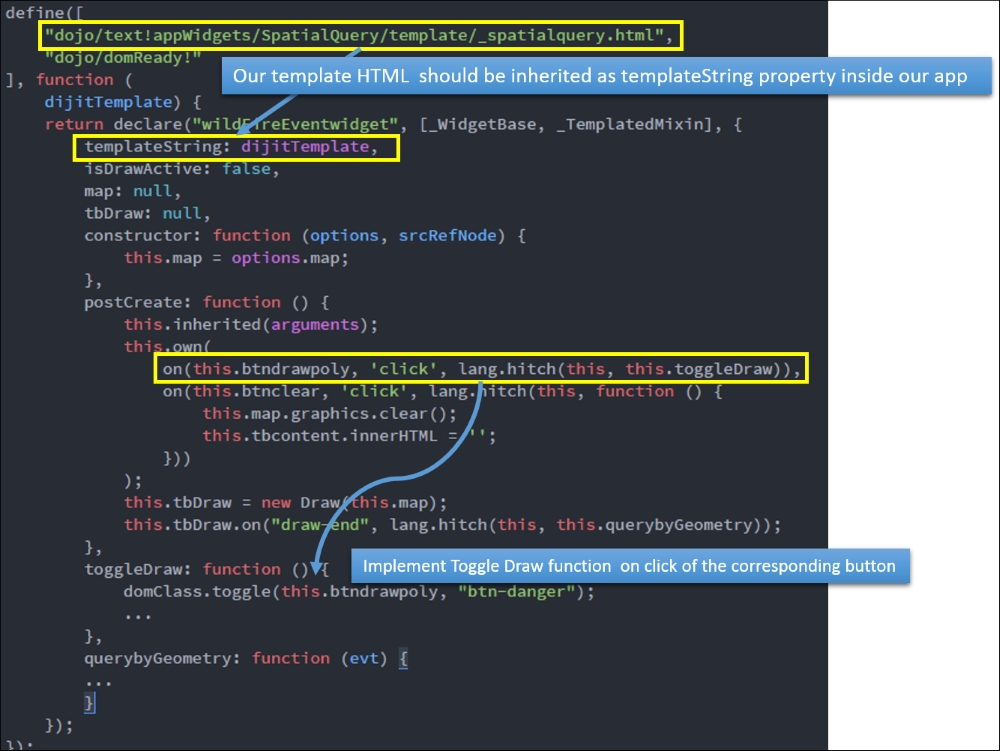
This HTML file should be loaded as a plugin using the dojo/text! plugin. Once this is done, all the dom elements referred by dojo-attach-point can be accessed in the code using this notation. Also, functions to handle the click events for the toggleDraw button and the clear button should be implemented. The following screenshot shows a barebones implementation of this:
The features returned by the query are wildfire locations, all of which have a point geometry. We can use SimpleMarkerSymbol or PictureMarkerSymbol to symbolize features returned by the query. The PictureMarker symbol accepts the following properties:
anglexoffsetyoffsettypeurlcontentTypewidthheight
We will use a PNG resource, which is part of the application to define PictureMarkerSymbol:
  var symbolSelected = new PictureMarkerSymbol({
  "angle": 0,
  "xoffset": 0,
  "yoffset": 0,
  "type": "esriPMS",
  "url": "images/fire_sel.png",
  "contentType": "image/png",
  "width": 24,
  "height": 24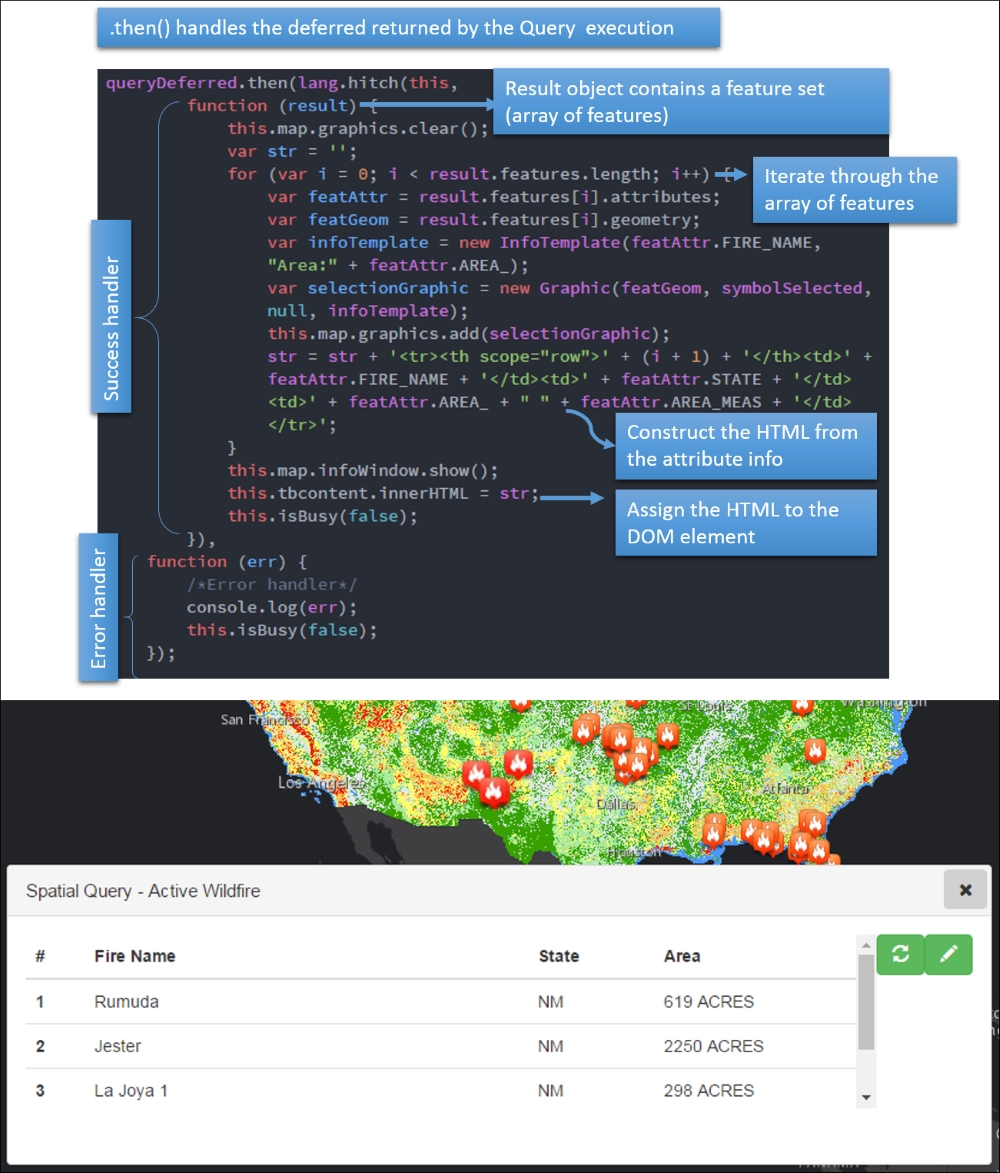
});All the query result features should be converted into a graphic with the PictureMarkerSymbol that we just defined. Additionally, we will also be adding an infotemplate to each graphic. The infotemplate content will be taken from query result attributes. The HTML table can also be constructed by iterating through the features returned by the query result object. The following screenshot illustrates the entire process clearly:
The complete code listing can be found in the folder called B049549_04_CODE02.