With the knowledge of all these statistics, it's time to go smart with mapping using the smart mapping module provided by the API. Imagine a module that can automatically call the renderer parameters on its own given a few basic inputs, such as the feature layer on which the renderer needs to be generated and the classification method.
Module name: esri/renderers/smartMapping
The smart mapping module provides several methods, each of which produces a renderer. The renderers that the smart mapping module can produce are:
- Color-based classed renderer
- Size-based classed renderer
- Type-based renderer
- Heat map renderer
Smart mapping even takes care of the rendering based on the Basemap. For example, a certain color or opacity renderer works well with a darker-themed Basemap such as satellite, and certain renderers work well with a light-themed Basemap such as street maps.
With three simple steps, you can let the API decide the color scheme and create the classes color renderer for you:
- Construct a schemes object from the Esri styles
choroplethmodule (importesri/styles/choropleth) - Construct a classed color parameter object with the following properties:
basemapclassificationMethodlayerfieldscheme—choose theprimarySchemeproperty from the schemes object constructed earliernumClasses
- Assign a classed color parameter object as a parameter to the
createClassedColorRenderer()method belonging to the smart mapping module - Assign the renderer property returned by the smart mapping method to the feature layer's
setRenderer()method as a parameter - Redraw the feature layer and refresh the legend object
The following code explains how smart mapping can be used to create a classed color renderer:
//Call this function with the classification method as input
function applySmartRenderer(selectedClassificationMethod) {

//Create a scheme object assigning a theme
var schemes = esriStylesChoropleth.getSchemes({
  //The following options are available for theme:
  // high-to-low, above-and-below, centered-on, or extremes.
  theme: "high-to-low",
  basemap: map.getBasemap(),
  geometryType: "polygon"
});
console.log(JSON.stringify(schemes));

//Create a classed color Render Parameter object
var classedColorRenderParams = {
  basemap: map.getBasemap(),
  classificationMethod: selectedClassificationMethod,
  field: 'MEDHINC_CY',
  layer: CountyDemogrpahicsLayer,
  scheme: schemes.primaryScheme,
  numClasses: 5
};

SmartMapping.createClassedColorRenderer(classedColorRenderParams).then(function (result) {
  CountyDemogrpahicsLayer.setRenderer(result.renderer);
  //Redraw the feature layer
  CountyDemogrpahicsLayer.redraw();
  //Update the legend
  legend.refresh();
}).otherwise(function (error) {
  console.log("An error occurred while performing%s, Error: %o", "Smart Mapping", error);
});
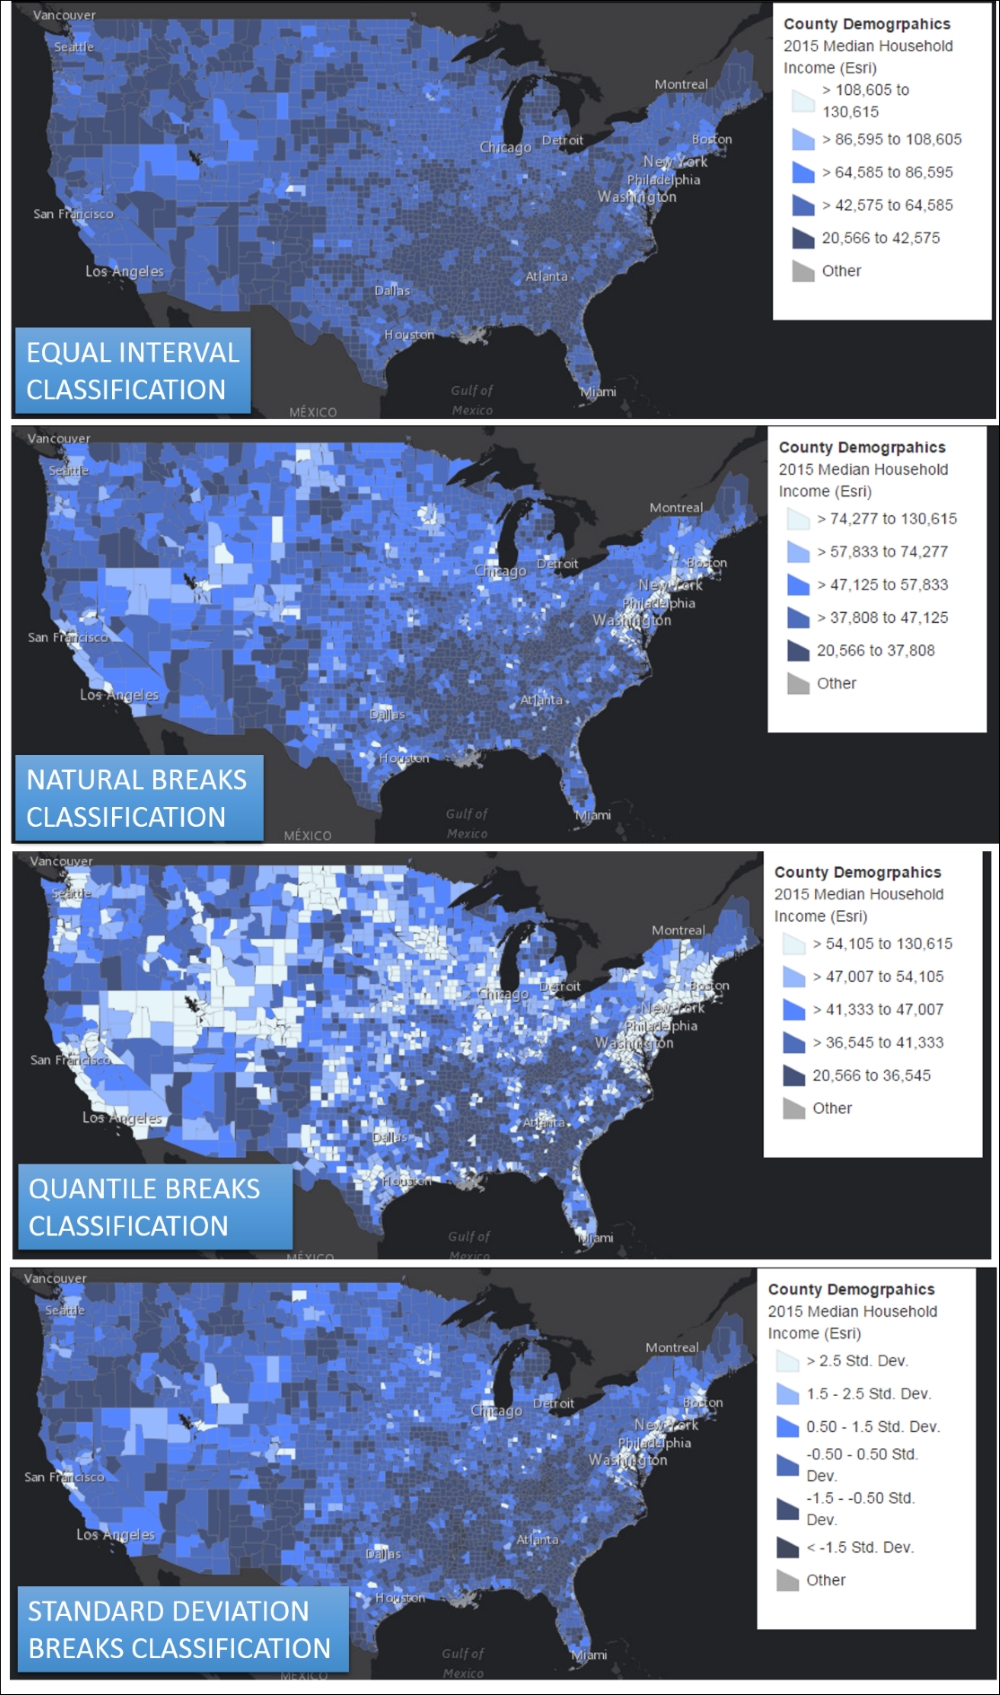
The following screenshots show the classed color renderer created using the smart mapping module for four different classifications, namely equal interval, natural breaks, quantile, and standard deviation. The user's discretion is used to decide which would serve as the best classification method based on the purpose of mapping the data, and also the audience.
We can manually define the color scheme by editing the scheme object, which is a property in the parameter object for the createClassedColorRenderer() method.