ArcGIS Online is an effective medium to visualize and play with data hosted on ArcGIS Server. When opening a map service in ArcGIS Online, the default symbology is displayed and we can get a sense of the extent of the data we would be using in our application.
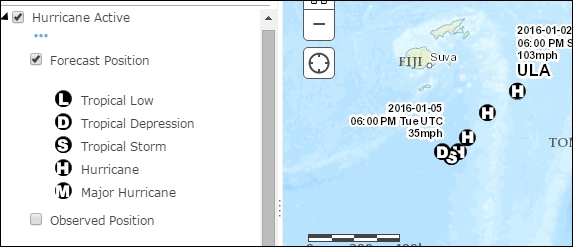
In the following screenshot, we can see the Forecast Position feature layer and its default symbology. The symbology being used is PictureMarkerSymbol and it gives a sense of what is the intensity of the hurricane over the past three days (72 hours).
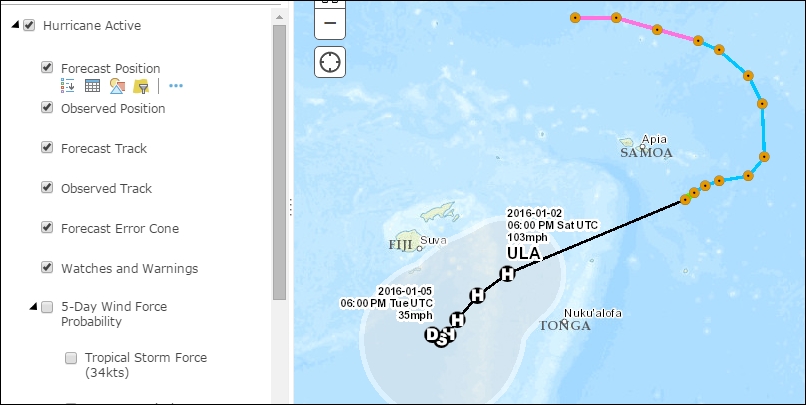
The following screenshot gives a holistic picture of the entire data in the map service including forecast locations and track, as well as observed locations:
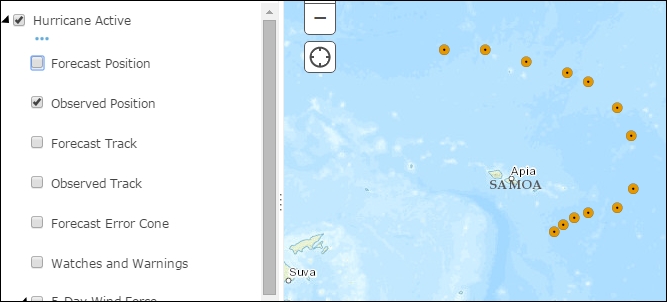
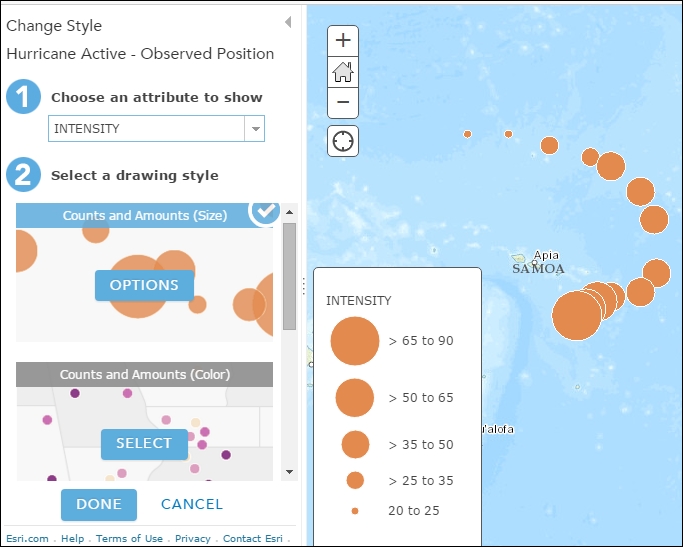
Turn off all the layers in the Table of Contents (TOC) and turn on just the Observed Position layer. The Observed Position layer is just rendered by just a simple Renderer. The symbology doesn't vary in size according to any field value. It just shows the locations where storm activity was measured in the past 72 hours.
Now ArcGIS Online gives us options to set its symbology in various ways. When we click the layer's name in the TOC, the following screen opens up. It shows various styles based on which symbology can be changed. In the following screenshot, INTENSITY of the storm is chosen as the field of display, and the size of the symbol is based on the quantity of the INTENSITY value:
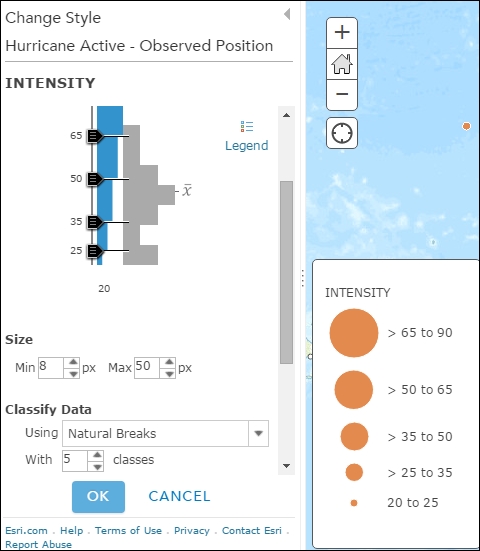
The data can be classified into groups according to various classification techniques such as Equal Breaks, Quantile, Natural Breaks, and so on.
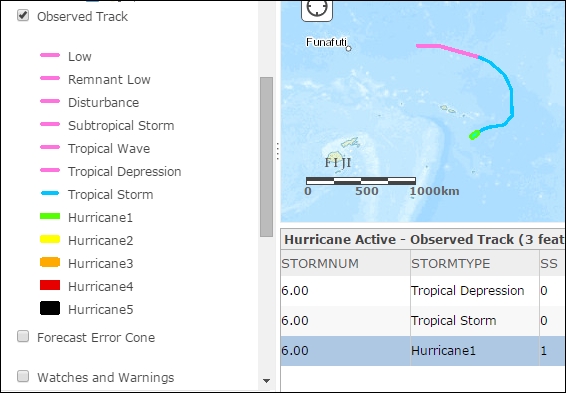
Finally, the Observed Track actually shows the track taken by the hurricane over the past 72 hours and uses a unique value renderer to render the data.