Now that we have gained an understanding of our data using the ArcGIS Online service, we can use the map service URL to build a web mapping application of our own. In our application, we intend to incorporate the following:
- Add layers to the map that displays the past and present hurricane locations
- Add global wind data
- Add a gauge widget to display the wind speed
- Add a current weather widget, which displays the current weather information at the user's browser location
- Add a Current Hurricane List widget, which shows the updated list of current hurricanes and the details of each hurricane when selected
We have more than one feature layer to deal with. Let's try to build a layer dictionary. In the following code snippet, we will try to create an array of objects where each object has properties such as a URL and title. The URL refers to the URL of a feature layer and the title property refers to the title by which we would like to refer to the feature layer:
var windDataURL = "http://livefeeds.arcgis.com/arcgis/rest/services/LiveFeeds/NOAA_METAR_current_wind_speed_direction/MapServer";

var activeHurricaneURL = "http://livefeeds.arcgis.com/arcgis/rest/services/LiveFeeds/Hurricane_Active/MapServer";


var layerDict = [
          {
            title: "Forecast Error Cone",
            URL: activeHurricaneURL + "/4"
          },
          {
            title: "Forecast Tracks",
            URL: activeHurricaneURL + "/2"
          },
          {
            title: "Observed Track",
            URL: activeHurricaneURL + "/3"
          },
          {
            title: "Watches and Warnings",
            URL: activeHurricaneURL + "/5"
          },
          {
            title: "Forecast Positions",
            URL: activeHurricaneURL + "/0"
          },
          {
            title: "Past Positions",
            URL: activeHurricaneURL + "/1"
          },
          {
            title: "Wind Data",
            URL: windDataURL + "/0"
          }
        ];
This helps us retrieve the feature layer using the layer name or title property. Let's use the array.map() method provided by the dojo/_base/array module to add the corresponding feature layer for each object into the layerDict array. The array.map() method, if you can recollect from Chapter 1, Foundation for the API, actually iterates through the elements in the array and will return an array. Then, each item being iterated can be modified. In our case we are trying to do the following for each item:
- Create a feature layer from the URL in each item.
- Add the feature layer to the map.
- Add an additional layer property to each item object in the
layerDictarray.
The following code snippet explains the process:
var layerDict = array.map(layerDict, function (item) {
          var featLayer = new FeatureLayer(item.URL, {
            mode: FeatureLayer.MODE_ONDEMAND,
            outFields: ["*"]
              //infoTemplate: infoTemplate
          });
          map.addLayer(featLayer);
          item.layer = featLayer;
          return item;
        });
Now each object in the layerDict array will have an additional layer property, which holds the feature layer referred by the URL.
To retrieve a feature layer, we can use the layer name in the array.filter() method provided by the dojo/_base/array module. The filter method() iterates through each object item and returns a filtered array based on our predicate condition.
The following line of code returns the feature layer with the title "Forecast Error Cone" and saves it in the variable named foreCastErrorConeFeatureLayer:
var foreCastErrorConeFeatureLayer = array.filter(layerDict, function (item)
{
  return item.title == "Forecast Error Cone";
})[0].layer;
We are trying to symbolize the features in some of the feature layers. We will start off with the past positions. The past positions feature a layer, which by default is represented by a circle with a dot in the center. We will try to use a red flag to symbolize it. The following approach shall be taken to symbolize it:
- Import the
esri/symbols/PictureMarkerSymbolmodule. - Find the URL for a PNG representing a red flag and use it to create a
PictureMarkerSymbol. - Import the
esri/renderers/SimpleRenderermodule and create aSimpleRendererassigning the symbol for the renderer with thePictureMarkerSymbolwe just created. - Set the renderer for the feature layer with the simple renderer we just created.
The following lines of code explain this process clearly:
var pastPositionLayer = array.filter(layerDict, function (item) {
    return item.title == "Past Positions";
})[0].layer;

var pastPositionSymbol = new PictureMarkerSymbol({
  "angle": 0,
  "type": "esriPMS",
  "url": http://static.arcgis.com/images/Symbols/Basic/RedFlag.png",
  "contentType": "image/png",
  "width": 18,
  "height": 18
});

var pastPositionRenderer = new SimpleRenderer(pastPositionSymbol);
pastPositionLayer.setRenderer(pastPositionRenderer);
Now, we can try and render the forecast error cones layer. Forecast error cones are polygon feature layers that represent the uncertainty in the forecast predictions. Two polygon features are present for each hurricane type. One of the polygon represents a 72-hour forecast error polygon and the other represents a 120-hour forecast error polygon. This information is available in the FCSTPRD field in the feature layer.
Let's create a unique value renderer and symbolize each of these types of polygon differently based on the value of the FCSTPRD field name. To create a unique value renderer, we need to take the following approach:
- Import the
esri/renderers/UniqueValueRenderer,esri/symbols/SimpleLineSymbolandesri/symbols/SimpleFillSymbolmodules. - Create a default symbol for the renderer. Since we know that with all our
Forecast Errorpolygons theFCSTPRDfield value will be either72or120, we will create aSimpleFillSymbolwith empty symbology and also set its outline as null line symbol. - Create a
UniqueValueRendererobject from theesri/renderers/UniqueValueRenderermodule. Assign it the default symbology we just created as well as theFCSTPRDas the fieldname upon which the rendering is based. - Add values to the renderer using the
addValue()method. TheaddValue()method accepts the unique value (72/120) and the corresponding symbol for each unique value. - Set the renderer to the
Forecast Error Cone Feature layer.//Get the Forecast Error Cone feature layer var foreCastErrorConeFeatureLayer = array.filter(layerDict, function (item) { return item.title == "Forecast Error Cone"; })[0].layer; //Create a Null SimpleFillSymbol var defaultSymbol = new SimpleFillSymbol().setStyle(SimpleFillSymbol.STYLE_NULL); //With a null Line Symbol as its outline defaultSymbol.outline.setStyle(SimpleLineSymbol.STYLE_NULL); var renderer = new UniqueValueRenderer(defaultSymbol, "FCSTPRD"); //add symbol for each possible value renderer.addValue('72', new SimpleFillSymbol().setColor(new Color([255, 0, 0, 0.5]))); renderer.addValue('120', new SimpleFillSymbol().setColor(new Color([255, 255, 0, 0.5]))); //Set Renderer foreCastErrorConeFeatureLayer.setRenderer(renderer);
We have tried symbolizing a feature layer with PictureMarkerSymbol and render it using SimpleRenderer. For another feature layer, we used a unique value renderer to render features having different values for a particular field differently. Now let's try a special kind of symbology known as CartographicLineSymbol.
The CartographicLineSymbol provides additional properties such as cap and join, which defines how the end cap of the lines and the edge joins are rendered. To know more about these two properties, visit the API page at https://developers.arcgis.com/javascript/jsapi/cartographiclinesymbol-amd.html.
We would like to use the CartographicLineSymbol to symbolize the forecast track feature layer. The following shows us how to use the symbol and to render the particular feature layer:
- Import the
esri/symbols/CartographicLineSymbolmodule. - Use
STYLE_DASHDOTfor the style parameter, yellow for the color parameter,5as the width in pixels,CAP_ROUNDas the cap type, andJOIN_MITERas the join type. - Use the symbol for a
SimpleRenderer. - Set the renderer to the forecast track feature layer.
The following snippet codifies the previous approach:
var lineSymbol = new CartographicLineSymbol(
  CartographicLineSymbol.STYLE_DASHDOT,
  new Color([255, 255, 0]), 5,
  CartographicLineSymbol.CAP_ROUND,
  CartographicLineSymbol.JOIN_MITER, 5
);
var CartoLineRenderer = new SimpleRenderer(lineSymbol);

forecastTrackLayer.setRenderer(CartoLineRenderer);
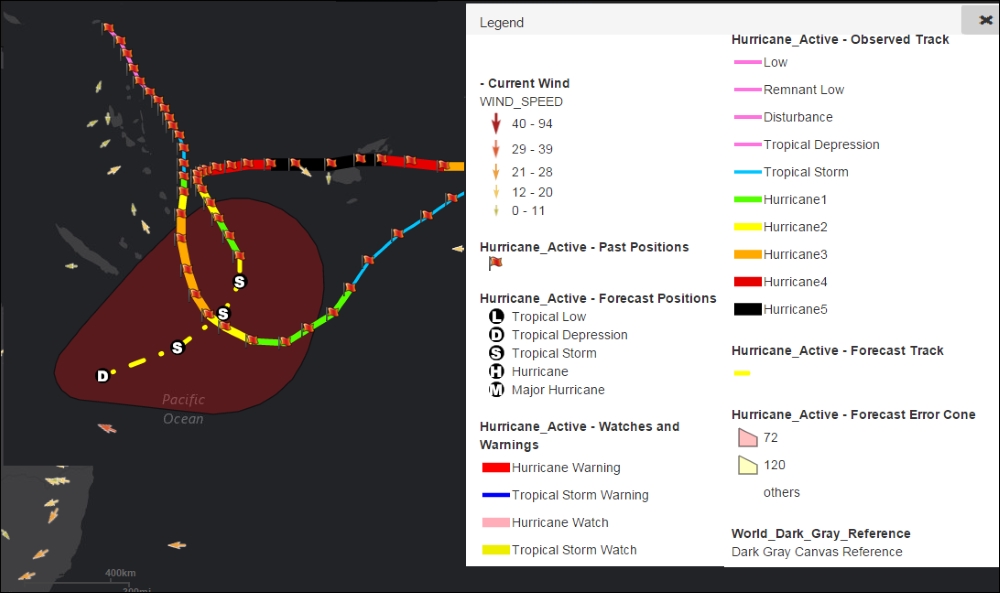
Our map looks like the following when the previous renderers are applied to the past positions layer, Forecast Track, and the Forecast Error Cone layers: