When an application uses layers that are referenced from a web map or a GIS service, the web map or service itself provides default drawing properties that determine how the layer will be drawn. A developer can choose to override this behavior by working with colors, symbols, and renderers to change and enhance how the features are displayed.
You can use the setSymbol() method to apply a symbol to a single graphic. When you want to apply symbology to all the graphics in a dynamic, feature, or a graphics layer, you can use a renderer.
Renderers make it easy to symbolize many features quickly, using either a single symbol or multiple symbols based on attribute values.
Several of the renderers available in the ArcGIS API for JavaScript are as follows:
SimpleRenderer: This applies the same symbol to all the graphics in a layerUniqueValueRenderer: This applies specific symbols based on the unique attribute values of each graphicClassBreaksRenderer: This applies the symbols of different sizes or colors based on the ranges of attribute valuesDotDensityRenderer: This shows the variation in the spatial density of a discrete spatial phenomenonHeatmapRenderer: This converts point data into a raster display that shows the high density or weighted areas of concentration using a blur radius and the intensity valueTemporalRenderer: This visualizes real-time or historic observations in the current extent of the map, factoring in relative feature aging and tracks along which observed incidents occur, such as a hurricaneScaleDependentRenderer: This applies different renderers to the same layer based on the current scale of the map
The symbols and renderers guide in the API documentation provides a great guide on using symbols and renderers. The documentation can be accessed at https://developers.arcgis.com/javascript/jshelp/inside_renderers.html.
UniqueValueRenderer and ClassBreaksRenderer are attribute-based renderers. This means that attribute values determine how the features are symbolized. To determine whether to use UniqueValueRenderer or ClassBreaksRenderer in a given situation, consider the nature of the field values upon which the categorization needs to be performed.
UniqueValueRenderer and ClassBreaksRenderer have the defaultSymbol property that gets used when a value or break cannot be matched. During development, you can use a default symbol with a high-contrast color to quickly verify whether any feature has failed to match the renderer's criteria.
We will be developing a Stream Gauge app to demonstrate how to use the following renderers:
- Simple renderer
- Unique value renderer
- Class breaks renderer
- Heatmap renderer
The Stream Gauge data is provide by Esri as part of their Living Atlas of the World portal. This means that we need to have an ArcGIS Developer login to access the content. The URL to the Mapservice for the Stream Gauge data is http://livefeeds.arcgis.com/arcgis/rest/services/LiveFeeds/StreamGauge/MapServer/.
The map service provides the readings of Stream Gauges around the United States, which depict the current water level in the measured areas. The application we are trying to develop endeavors to demonstrate different rendering techniques over the Gauge data. The upcoming snapshot in the next section provides a rough rendition of our final application that we will have developed by the end of this chapter.
If you do not have an ArcGIS Developer account, refer to Chapter 3, Writing Queries, for instructions on how to register an account and use the credentials in the application proxy.
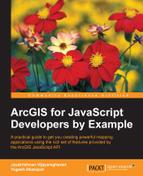
Simple renderer is provided by the esri/renderers/SimpleRenderer module, and its constructor accepts any appropriate symbol or a JSON. Since all the Gauge locations are point locations, we will use SimpleMarkerSymbol to symbolize them.
Since we have already discussed how to construct a PictureMarkerSymbol from its corresponding module, we will see how to use the JSON form of the symbol. Using the JSON representation of the symbol means that we no longer need to load the modules separately for each symbol and color. The following snapshot shows how JSON is formed and used in the SimpleRenderer constructor:
In the preceding code, after the renderer is assigned with SimpleRenderer, the renderer object must be set to the feature layer by using the setRenderer() method. Also, the legend should be refreshed once the rendering is applied to the feature layer:
streamLyr.setRenderer(renderer);
streamLyr.redraw();
legend.refresh();
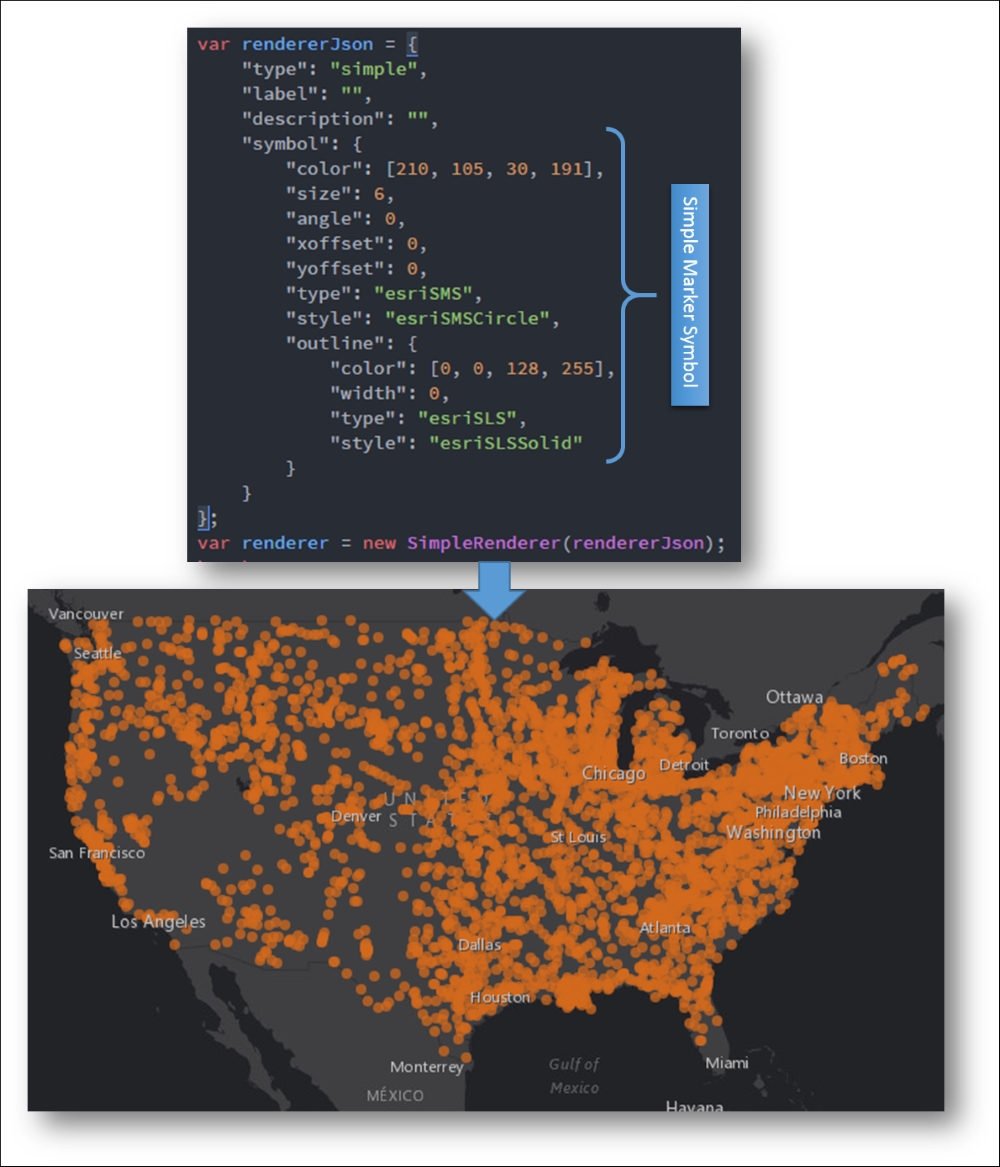
Unique value renderer is provided by the esri/renderers/UniqueValueRenderer module. Unique value renderer lets us define different symbols for a set of unique values in the data. Up to three attribute fields can be provided to determine the uniqueness of the data. Unique value renderer expects the uniqueValueInfos object. This object is basically a mapping between the unique value and the symbol that is used to represent the value. Therefore, all the features with a specific value will be rendered by the corresponding mapped symbol. We can provide the defaultSymbol object to the renderer that will be used to symbolize any value that is not defined in the uniqueValueInfos object. The following is a JSON representation of a unique value renderer object symbolizing unique values of flood stages. The unique values for flood stages that we symbolize are as follows:
majormoderateminoractionvar rendererJson = { "type": "uniqueValue", "field1": "STAGE", "defaultSymbol": {}, "uniqueValueInfos": [{ "value": "major", "symbol": { "color": [163, 193, 163], "size": 6, "type": "esriSMS", "style": "esriSMSCircle" } }, { "value": "moderate", "symbol": { "color": [253, 237, 178], "size": 6, "type": "esriSMS", "style": "esriSMSCircle" } }, { "value": "minor", "symbol": { "color": [242, 226, 206], "size": 6, "type": "esriSMS", "style": "esriSMSCircle" } }, { "value": "action", "symbol": { "color": [210, 105, 30], "size": 6, "type": "esriSMS", "style": "esriSMSCircle" } }] }; var renderer = new UniqueValueRenderer(rendererJson);
The preceding code renders in the app as follows:
The following properties can be used with feature layers to render it based on multiple visual properties, such as color, rotation, size, and opacity:
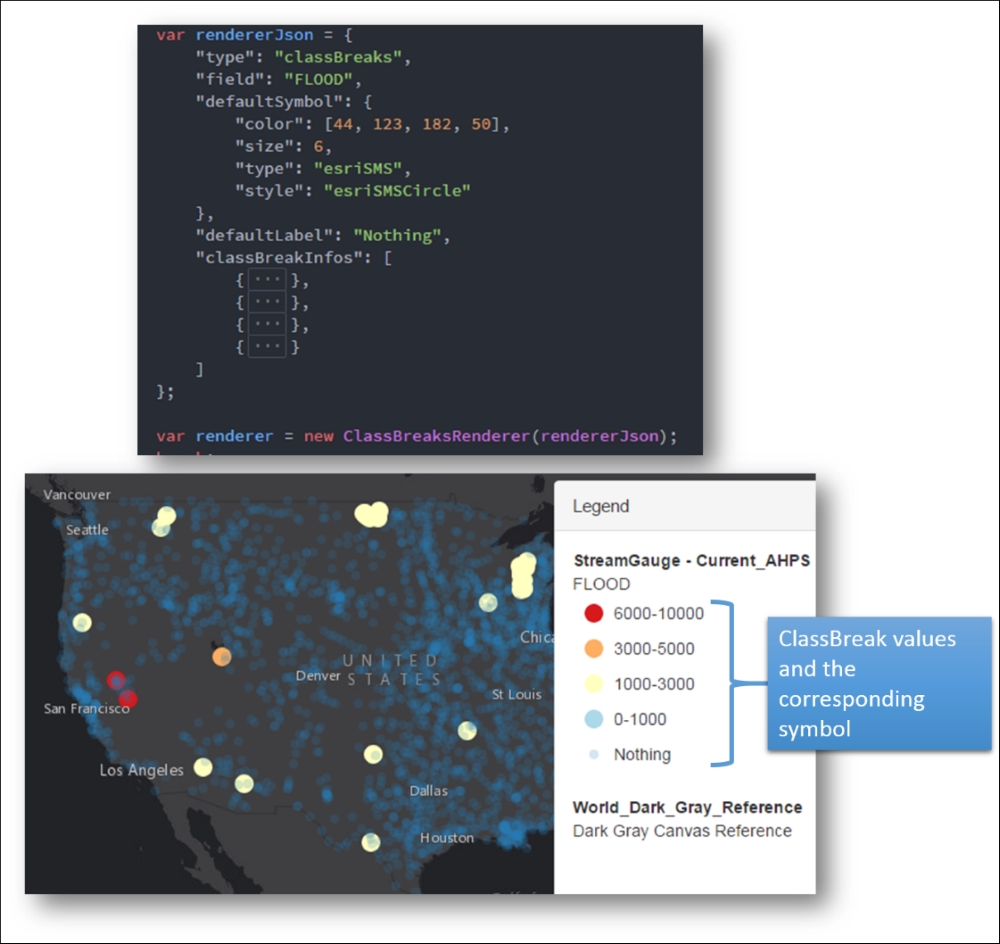
When the field is classified and visually differentiated it is spread over a range of values, we can use ClassBreaksRenderer. ClassBreaksRenderer can be used by loading the esri/renderers/ClassBreaksRenderer module.
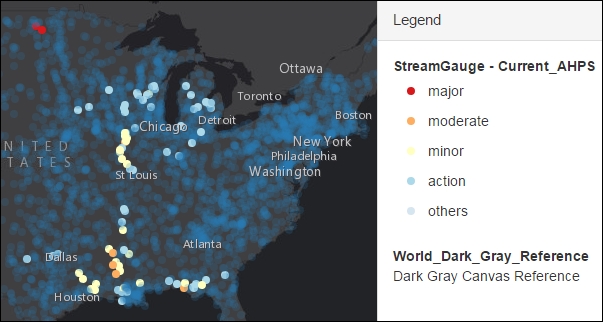
Class break renderer is very similar to unique value renderer in that the constructor for Class break renderer expects a classBreakInfos object, which is similar to the uniqueValueInfos object.
classBreakInfos is an array of classBreakInfo objects, which maps between a class range and a symbol. A class range is defined by the class' minimum (classMinValue) and the class' maximum (classMaxValue).
The following snapshot shows how the ClassBreakRenderer JSON object is constructed with the classBreakInfo array and rendered on the map:
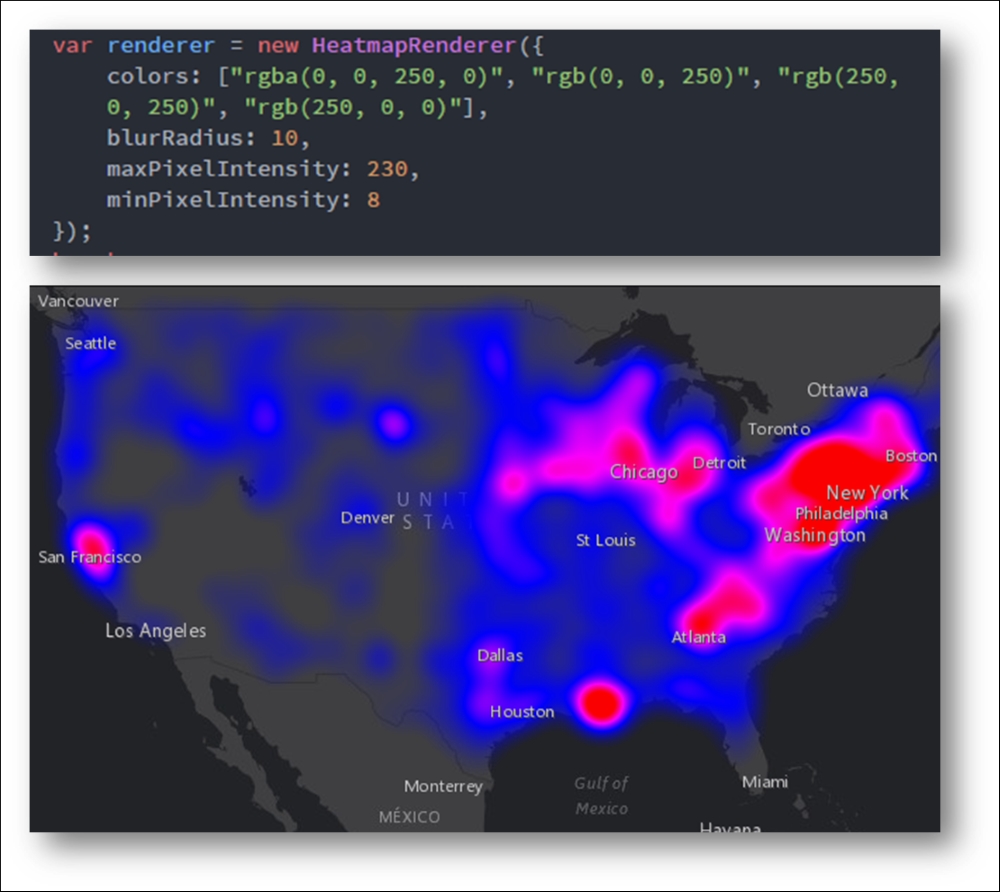
HeatmapRenderer renders point data into a raster visualization that emphasizes areas of higher density or weighted values. This renderer normal distribution curve to spread value out in vertical and horizontal directions.
This averaging function is applied horizontally and vertically to produce a blurred area of influence instead of a single specific point.
A HeatmapRenderer module constructor accepts an array of colors. The first color is used to represent areas with least influence, and the last color in the array is used to represent pixels with the highest influence. We can also define other parameters for the HeatmapRenderer constructor such as blurRadius, the maximum pixel intensity, and the minimum pixel intensity. The following snapshot of the code is used to generate a HeatmapRenderer:
DotDensityRenderer provides the ability to create dot density visualizations of the data. A dot density map can be used to visualize the variation in the spatial density of a discrete spatial phenomenon. We can use multiple fields to visualize multiple variables on one map with different colors. For example, we can use different colors to show the distribution of various ethnic groups. The density on the map always changes as the user zooms in or out. Use ScaleDependentRenderer to set a unique-dot density renderer for each scale or zoom range, so dotValue and dotSize can vary across multiple scale ranges.
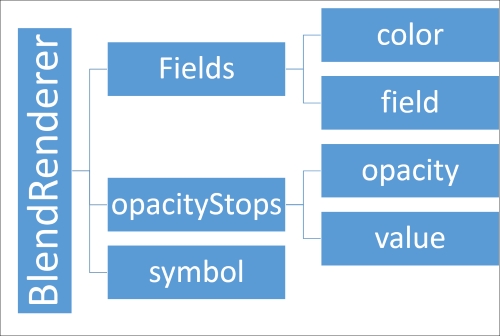
The problem with ClassBreakRenderer or UniqueValueRenderer is that you have to assign a specific color to any given value. When assigning discrete colors based on clear boundary values isn't desirable, we can use BlendRenderer.
BlendRenderer lets you do a fuzzy classification of data. It lets you assign different colors for values from different fields and use some opacity to represent the magnitude of the value. The final rendering will be a blend of these colors since we are using opacity for each field. This diagram shows how color and opacity variables can be blended to provide a rendering:
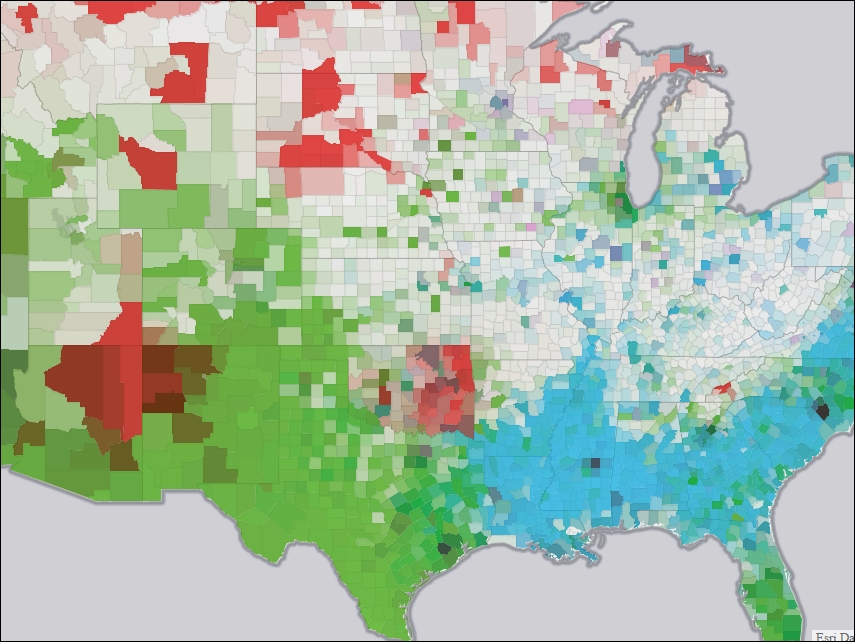
The following map shows a map of predominant minority groups throughout the United States. Such illustrations give a sense of predominant features while not completely suppressing other details:
The SmartMapping module provides a lot of helper methods that help us choose the best rendering method. The following illustration shows a list of methods available with the SmartMapping module:
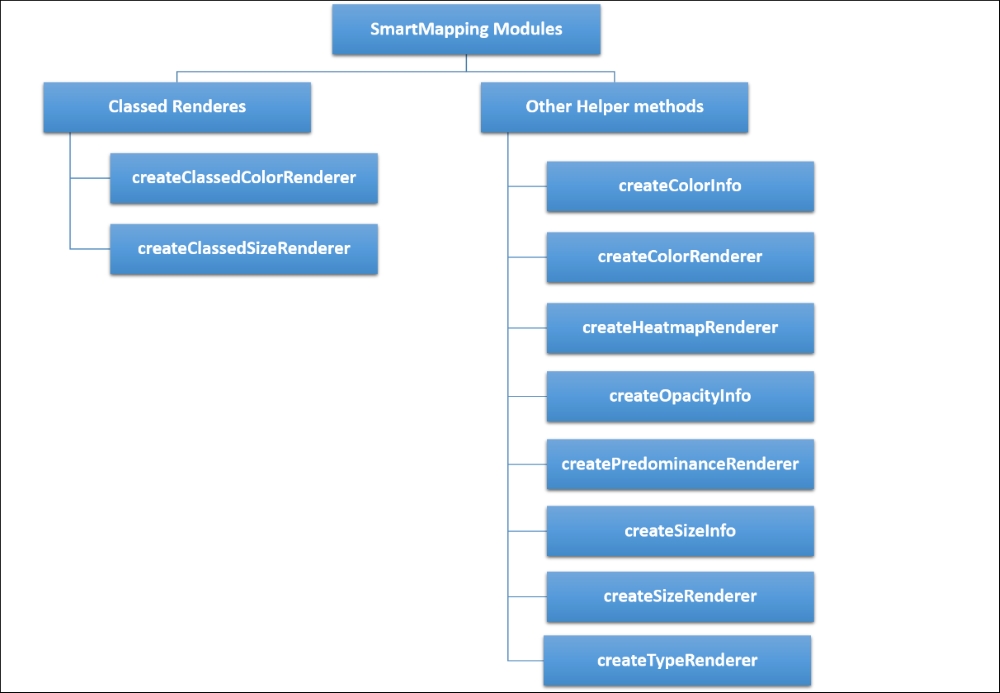
The classed renderer helper methods, such as createClassedColorRenderer() and createClassedSizeRenderer(), need classificationMethod as a parameter. Choosing this value is quite important if we need to understand the significance of each.
The following classification methods are available:
- equal-interval
- natural-breaks
- quantile
- standard-deviation
The default method is equal-interval.
Equal interval classification divides the data equally into a predefined number of classes. Such a classification might not necessarily reflect the skewness in the data. For example, if the data range is from 0-1 million, and the majority of the data is concentrated between 300,000-500,000, then instead of classifying the data between 0-250,000, 250,000-500,000, 500,000-750,000, and 750,000-1,000,000, it would be a better classification scheme if there were a greater number of classification ranges between 300,000-500,000.
Classification methods such as natural-breaks, quintile, and standard deviation help to segregate the data better; hence, our data visualization technique would be statistically much accurate. This topic will be discussed in greater detail in Chapter 7, Map Analytics and Visualization Techniques.