
Data that are updated constantly presents us with a significant challenge in retrieving and rendering them. In this chapter, we will deal with two basic methods to work with real-time data by developing an application that is meant to track hurricanes. You will learn about the following topics in this chapter:
- Understand about the nature of real-time data such as hurricane data
- Use the in-built options given by ArcGIS to visualize the data
- Methods to get the latest data
- Methods to set the refresh interval for a layer
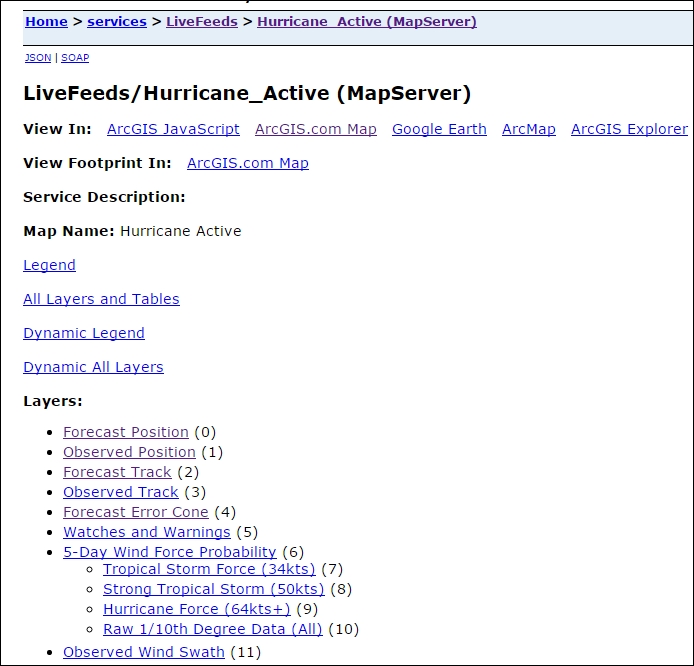
We are going to deal with hurricane data provided by the National Hurricane Center (NHC). The NHC provides a map service that describes the path and forecast of tropical hurricane activity. The live feeds provided as a map service by the NHC can be found at http://livefeeds.arcgis.com/arcgis/rest/services/LiveFeeds/Hurricane_Active/MapServer.
The map service provides data about the following:
- Forecast Position
- Observed Position
- Forecast Track
- Observed Track
- The Cone of Uncertainty
- Watches and Warnings
- Tropical Storm Force
The forecast and observed positions represent the center of the cyclone, whereas the track represents forecast and observed positions connected to give a sense of the movement of the hurricane.
In the Service Catalog heading, click ArcGIS.com Map to get a holistic perspective of the data in the map service.