
We have dealt with reading and displaying time-based data in our earlier chapters, as well as non-spatial charting methodologies using innovative libraries such as D3 and Cedar. This chapter deals with visualizing space-time data using spatial visualization, as well as other non-spatial visualization aids such as Time Slider and Time Graph. The following topics are discussed in this chapter:
- Time aware layers and the need for them
- Building a drought app using Time Slider
- Querying based on time data using D3
- Advanced spatio-temporal visualization using Cedar charts
ArcGIS 10 and above includes support for time aware layers. Time aware layers are DynamicMapService or feature layers that have a TimeInfo property. The following screenshot shows the Service Catalog of a Time aware feature layer.
Check out the TimeInfo property in the image:
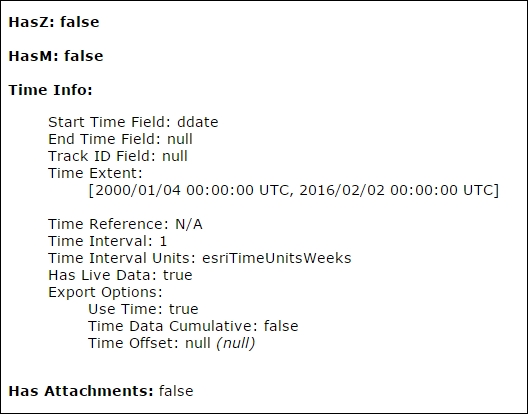
Snapshot of TimeInfo information in the Service Catalog
Let's discuss the components of the TimeInfo object, which is something similar to the one we saw in the previous image. The TimeInfo property provides us with the following information:
- Which field in the layer stores the time information (State Time Field, End Time Field).
- The minimum-most and maximum-most time for which data is available (Time Extent).
- The Time Reference property refers to the time zone in which the date time values are stored (if null, UTC time is followed; this shall be discussed in detail).
- The Time Interval units is the time interval at which data is available for each feature.
- Has Live Data property refers to a Boolean value, which indicates whether data is continuously updated.
- Export Options provides a list of properties such as Use Time, Time Data Cumulative, and Time Offset. The Time Data Cumulative is a Boolean value referring to whether features retrieved are accumulated with time.
Time aware layers let us understand data in a spatio-temporal context; this means we can see how spatial information changes over a time period. This kind of data has various real-world applications such as:
- Understanding where the crime hotspots are in a city over time
- Tracking a hurricane and displaying its current position
- The spread of flood events in an area over a short span of time
- Displaying the proliferation of oil wells in a state
- How the drought conditions have affected a place over time
A certain basic understanding of the concept of time in ArcGIS will help us work with time aware layers better. The following points are worth noting:
- Time should always be referred into the Coordinated Universal Time (UTC), which is functionally equivalent to Greenwich Mean Time (GMT).
- Just like the spatial extent of the map, we can define the time extent of the map, which has time aware layers. This will only affect map layers that have the
timeInfoproperty. Time extent is provided by theesri/TimeExtentmodule. We can define aTimeExtentobject with either of the following properties:startTimeendTimestartTimeandendTimerequire(["esri/TimeExtent", ... ], function(TimeExtent, ... ){ var timeExtent = new TimeExtent(); timeExtent.startTime = new Date("1/15/1989 UTC"); map.setTimeExtent(timeExtent); });
- The Time Data Cumulative property of the Export Options object under the Time Info object determines whether data can be cumulated or not.
- When the data in the time aware layer cannot be cumulated in the map display, we should be using just one thumb in the time slider. We will discuss the time slider shortly.