Despite the increasing number of offices with a computer (or two) on every desk, many people still need to or want to work with printed drawings. Perhaps you thought that using AutoCAD means you wouldn't have to rely on hard-copy versions of drawings because you could view them on-screen instead. Even if that's true, you may need to give hard-copy prints to your less savvy colleagues who don't have AutoCAD. You may want to make some quick prints to pore over during your bus ride home. You may find that checking drawings the old-fashioned way — with a hard-copy print and a red pencil — turns up errors that managed to remain hidden on the computer screen.
Whatever the reason, you'll want to print drawings at some point — probably sooner rather than later. Depending on where you are in a project, plotting is the pop quiz, mid-term, or final exam of your drawing-making semester. This chapter helps you ace the test.
Plotting originally meant creating hard-copy output on a device that was capable of printing on larger sheets, such as D size or E size (or A1 or A0 for the metrically inclined), that measure several feet (or a meter or more) on a side. (See Chapter 4 for information about drafting paper sizes.) These plotters often used pens to draw, robot-fashion, on large sheets of vellum or drafting film. The sheets could then be run through diazo blueline machines — copying machines that create blueline prints — in order to create less-expensive copies. Printing meant creating hard-copy output on ordinary printers that used ordinary-sized paper, such as A size (letter size, 8-1/2 × 11 inches) or B size (tabloid or ledger size, 11 × 17 inches) — that's A4 or A3 for you metric folk.
Nowadays, AutoCAD and most CAD users make no distinction between plotting and printing. AutoCAD veterans usually say "plotting," so if you want to be cool, you can do so, too.
Whatever you call it, plotting an AutoCAD drawing is considerably more complicated than printing a word processing document or a spreadsheet. CAD has a larger range of different plotters and printers, drawing types, and output procedures than other computer applications. AutoCAD tries to help you tame the vast jungle of plotting permutations, but you'll probably find that you have to take some time to get the lay of the land and clear a path to your desired hard-copy output.
One of the complications you face in your attempts to create a hard copy is that AutoCAD has two distinct ways of communicating with your plotters and printers. Operating systems, and the programs that run on them, use a special piece of software called a printer driver to format data for printing and then send it to the printer or plotter. When you configure Windows to recognize a new printer connected to your computer or your network, you're actually installing the printer's driver. ("Bring the Rolls around front, James. And bring me a gin and tonic and a D-size plot while you're at it.") AutoCAD, like other Windows programs, works with the printers you've configured in Windows. AutoCAD calls these system printers because they're part of the Windows system.
But AutoCAD, unlike other Windows programs, can't leave well enough alone. Some output devices, especially some larger plotters, aren't controlled very efficiently by Windows system printer drivers. For that reason, AutoCAD comes with specialized non-system drivers (that is, drivers that are not installed as part of the Windows system) for plotters from companies such as Hewlett-Packard, Xerox, and Océ. These drivers are kind of like non-union workers. They ignore the tidy rules for communicating with Windows printers in order to get things done a bit more quickly and flexibly.
Using already-configured Windows system printer drivers usually is easiest, and they work well with many devices — especially devices such as laser and inkjet printers that print on smaller paper. However, if you have a large plotter, you may be able to get faster plotting, better plot quality, or more plot features by installing a non-system driver. To find out more, choose Contents
For now, you should simply make sure that AutoCAD recognizes the devices that you want to use for plotting. The following steps show you how:
Launch AutoCAD and open an existing drawing or start a new, blank drawing.
Choose Tools

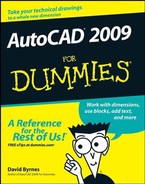
Click the drop-down arrow to view the list just below the Use as Default Output Device option, as shown in Figure 16-1.
The list includes two kinds of device configurations, designated by two tiny, difficult-to-distinguish icons to the left of the device names:
A little laser printer icon with a sheet of white paper coming out the top indicates a Windows system printer configuration.
A little plotter icon with a piece of paper coming out the front indicates a non-system (that is, AutoCAD-specific) configuration.
Tip
The non-system configuration names always end in
.pc3because they're stored in special AutoCAD Plotter Configuration version 3 files. So, if you can't tell the difference between the icons, look for the.pc3at the end of the name.Verify that the list includes the printers and plotters that you want to have available in AutoCAD.
If not, how you add one depends on your operating system. In Windows XP, choose Start
Choose the output device that you want to make the default for new drawings.
Click OK to close the dialog box and retain any changes that you made in the previous step.
Note
You use the AutoCAD Plotter Manager's Add-a-Plotter Wizard to create non-system driver configurations. (Choose Plotter Manager on the Output tab of the Ribbon's Plot panel or choose File
Okay, so you believe me. You know that you're not going to master AutoCAD plotting in five minutes. That doesn't change the fact that your boss, employee, wife, husband, construction foreman, or 11-year-old daughter wants a quick check plot of your drawing.
Here's the quick, cut-to-the-chase procedure for plotting a simple drawing — a mere 16 steps! This procedure assumes that you plot in model space — that is, that clicking the Model button on the status bar shows you the drawing in a way that you want to plot. (I cover plotting paper space layout tabs in the section "Plotting the Layout of the Land," later in this chapter.) This procedure doesn't deal with controlling plotted lineweights — see the "Plotting Lineweights and Colors" section later in this chapter for those details. It should, however, result in a piece of paper that bears some resemblance to what AutoCAD displays on your computer monitor.
Follow these steps to make a simple, not-to-scale, monochrome (black-and-white) plot of a drawing:
Open the drawing in AutoCAD.
Click Model on the status bar to ensure that you're plotting the model space contents. If you've got the model and layout tabs rather than the status bar buttons, click the Model tab.
I explain model space and paper space in Chapters 4 and 5, and how to plot paper space layouts later in this chapter.
Zoom to the drawing's current extents; in the Home tab's Utilities panel, click the down arrow adjacent to the Zoom button (look for the magnifying glass) and then choose Zoom Extents from the menu (or choose View
The extents of a drawing consist of a rectangular area just large enough to include all the objects in the drawing.

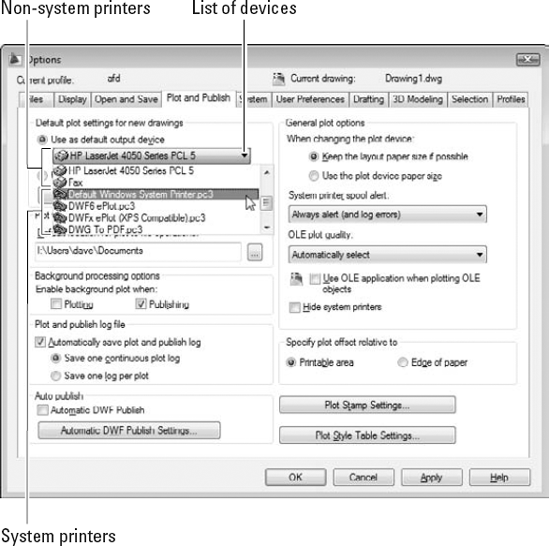
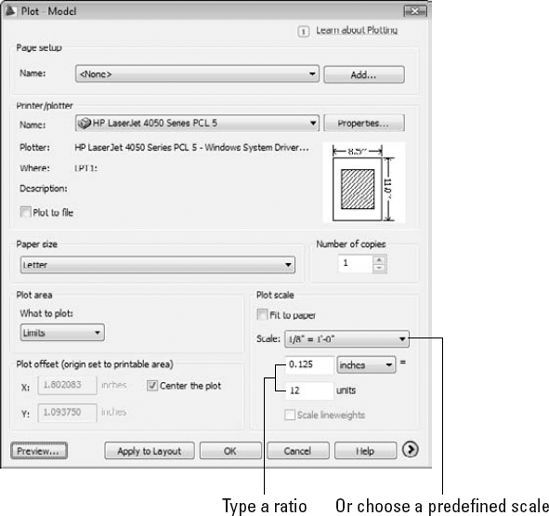
The Plot dialog box appears, as shown in Figure 16-2.
In the Printer/Plotter area, select a device from the Name drop-down list.
In the Paper Size area, select a paper size that's loaded in your printer or plotter.
Make sure that the paper size is large enough to fit the drawing at the scale at which you want to plot it. For example, if you want to plot a D-size drawing, but you have only a B-size printer, you're out of luck — unless you resort to multiple pieces of paper and lots of tape.
In the Plot Area area (sponsored by the Department of Redundancy Department), select Extents from the What to Plot drop-down list.
If you set limits properly, as I suggest in Chapter 4, you can select Limits instead to plot the drawing area that you defined. The Window option — that is, plot a window whose corners you pick — is useful when you want to plot just a portion of your drawing.
In the Plot Offset (Origin Set to Printable Area) area, select the Center the Plot check box.
Alternatively, you can specify offsets of zero or other amounts in order to position the plot at a specific location on the paper.
In the Plot Scale area, either select the Fit to Paper check box or deselect Fit to Paper and specify a scale (by choosing from the drop-down list or typing into the two text boxes).
For most real plotting, you'll plot to a specific scale, but feel free to select the Fit to Paper check box for now. If you do want to plot to a specific scale, see the "Instead of fit, scale it" section later in this chapter for guidance.
Click the More Options button (at the bottom-right corner of the dialog box, next to the Help button).
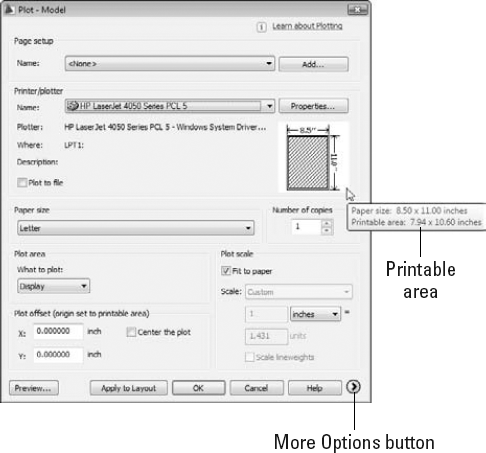
The Plot dialog box reveals additional settings, as shown in Figure 16-3.
In the Plot Style Table (Pen Assignments) area, choose monochrome.ctb or monochrome.stb from the drop-down list.
Tip
AutoCAD may ask you if you want to "Assign this plot style table to all layouts?" Answer Yes to make
monochrome.ctb(ormonochrome.stb) the default plot style table for the paper space layout tabs as well as the Model tab, or answer No to make the change apply only to the current tab.The "Plotting with style" section, later in this chapter, describes plot style tables.
In the Plot Options area, make sure that the Plot with Plot Styles check box is selected and that the Save Changes to Layout check box is deselected, as shown in Figure 16-3.
Leaving the Save Changes to Layout check box deselected tells AutoCAD to use any plot settings changes that you make only for this plot — AutoCAD will revert to the original plot settings the next time you plot the drawing.
Tip
After you become confident with plotting, you may want to select this check box so that AutoCAD does save your plotting settings changes as the default. Alternatively, click the Apply to Layout button to make the current plot settings the default for future plotting of this tab (that is, the Model tab) in this drawing.
In the Drawing Orientation area, choose Portrait or Landscape.
The icon (the letter A on a sheet) in the lower-right corner may help you decide on the right orientation. If not, the full preview in the next step will tell you for sure.
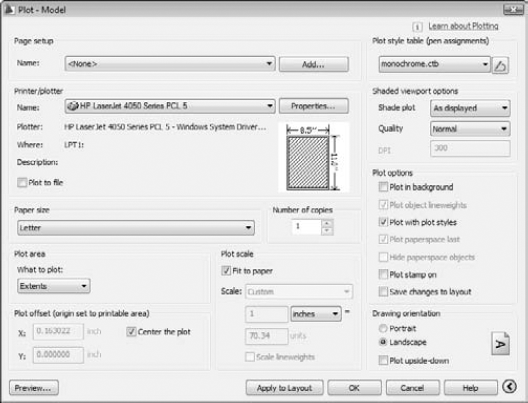
Click the Preview button and check that the drawing displays on the paper at the correct orientation and size, as shown in Figure 16-4; then right-click and choose Exit to return to the Plot dialog box.
If you found any problems in the preview, adjust the plot settings (for example, Plot Area, Plot Scale, or Drawing Orientation) and repeat the preview until the plot looks right.
Click OK to create the plot.
When AutoCAD finishes generating and sending the plot, it displays a Plot and Publish Job Complete balloon notification from the status bar. If you decide that you don't want to see these notifications, right-click the Plot/Publish Details Report Available icon near the right end of the status bar and deselect Enable Balloon Notification.

There — 16 steps, as promised. If for some reason your plot didn't work, well, I warned you that AutoCAD plotting was complicated and temperamental! Read the rest of this chapter for all the details about the numerous other plotting options that can cause plotting to go awry. If you're in a big hurry, turn directly to the troubleshooting section, "Troubles with Plotting," at the end of this chapter.
One of the keys to efficient plotting is liberal use of AutoCAD's preview feature. (To maintain political balance, I recommend conservative use of some other AutoCAD options elsewhere in the book.)
The postage stamp–sized partial preview in the middle of the Plot dialog box is a quick reality check to make sure your plot fits on the paper and is turned in the right direction. If the plot area at the current scale is too large for the paper, AutoCAD displays thick red warning lines along the side(s) of the sheet where the drawing will be truncated.
Click the Preview button to see a full preview in a separate window. You see exactly how your drawing lays out on the paper and how the various lineweights, colors, and other object plot properties will appear. You can zoom and pan around the preview by using the right-click menu. (Any zooming or panning that you do won't affect what area of the drawing gets plotted — zooming and panning is just a way to get a better look at different areas of the plot preview.)
In most real plotting situations, you want to plot to a specific scale rather than let AutoCAD choose an oddball scale that just happens to maximize the drawing on the paper. And if you're going to plot the Model tab of a drawing to scale, you need to know its drawing scale factor. Chapter 4 describes setup concepts, and Chapter 13 provides some tips for determining the scale factor of a drawing that someone else created.
If your drawing was created at a standard scale, such as 1:50 or 1/4″=1′−0″, then you simply choose the scale from the handy Scale drop-down list in the Plot dialog box. If your scale isn't in the list, type the ratio between plotted distance and AutoCAD drawing distance into the two text boxes below the Scale drop-down list, as shown in Figure 16-5. The easiest way to express the ratio usually is to type 1 in the upper box and the drawing scale factor in the lower box. (See Chapter 4 for more information.)
Warning
Your CAD manager may have added uncommon scales or removed scales from the Scale drop-down list that your company never uses. If you're designing espresso machines in Milano, for example, you'll probably never need to plot your drawings at 1/128″=1′−0″.
Creating half-size plots for some purposes is common in some industries. To plot model space half-size, double the drawing scale factor. For example, a 1/8″=1′−0″ drawing has a drawing scale factor of 96, which is equivalent to a plot scale of 1=96. To make a half-size model space plot of it, specify a plot scale of 1=192 (or choose 1/16″=1′−0″ from the Scale drop-down list).
Tip
Even if you work with drawings that are created to be plotted at a specific scale, plotting with a Fit to Paper scale may be the most efficient way to make a reduced-size check plot. For example, drafters in your office might create drawings that get plotted on D-size sheets (24 × 36 inches), whereas you have access to a laser printer with a B-size (11 × 17 inches) paper tray. By plotting the D-size drawings scaled to fit on B-size paper, you end up with check plots that are slightly smaller than half size. You won't be able to measure distances on the check plots with a scale, but you probably will be able to check them visually for overall correctness.
In the previous section, I show you how to plot the model space representation of your drawing by making sure that the Model tab is active when you open the Plot dialog box. However, paper space gives you many additional options for controlling the look of your output without having to modify the underlying geometry. So in some drawings, you may want to plot a paper space layout instead.
Note
Paper space is the environment that's specifically designed for outputting hard copy of your drawings. If you need a refresher on paper space or layouts, have another look (or a first look!) at Chapter 5.
As I explain in Chapter 5, AutoCAD gives you two alternative ways of switching between full-screen model space and the paper space layouts stored in the drawing. If you choose to display the model and layout tabs, you simply click on the appropriate tab to select the one you want. If instead you hide the model and layout tabs, you use the model and layout buttons plus Quick View Layouts (see Chapter 5) on the status bar.
Note
In AutoCAD 2009, the right-click menu is gone, replaced by a new Quick View Layouts status bar button. Quick View Layouts is a new way of reviewing, selecting, and managing paper space layouts in AutoCAD 2009. For the complete lowdown on using Quick View Layouts, refer to Chapter 5. In this section, I explain using the new feature to print your paper space layouts.
Plotting a paper space layout is pretty much like plotting model space except that you need to find the appropriate layout first and make sure that its tab is selected before you open the Plot dialog box, as follows:
Click Quick View Layouts on the status bar and scroll through the image panel.
The Quick View image panel opens in the lower part of the drawing area and displays a preview panel of model space and each layout stored in the drawing.
Move your mouse pointer across the images in the Quick View panel and pause over the image of the layout you want to plot.
As you move your mouse over each image, icons appear: Publish at the upper right corner and Plot at the upper left. I describe the PUBLISH command briefly in Chapter 19. In this chapter we're sticking with PLOT.
Click the Plot button in the upper left corner of the image panel of the layout you want to plot.
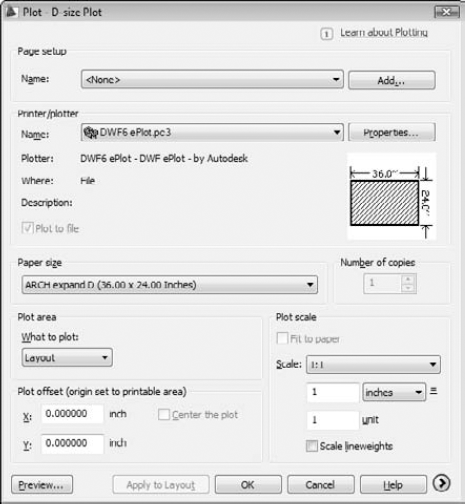
The Plot dialog box appears with the name of the layout to be plotted displayed in the title bar. (In Figure 16-6, I'm plotting a layout named "D-size Plot.")
Tip
If no one has set up a layout yet, AutoCAD creates a default layout. (If the Show Page Setup Manager for New Layouts setting on the Display tab of the Options dialog box is turned on, you'll see the Page Setup Manager dialog box first — just click the Close button.) The default layout probably won't be useful for real projects, but you can use it to find out about the layout plotting procedure. Refer to Chapter 5 for instructions on creating a real layout.
Specify a Printer/Plotter Name and a Paper Size.
Tip
If you don't have a printer capable of outputting larger than letter- or tabloid-sized sheets, you can still experiment by selecting a device that outputs to file, such as
DWF6 ePlot.pc3.In the What to Plot drop-down list, choose Layout, as shown in Figure 16-6.
The Layout option is available only when plotting a layout tab; Limits is available only when plotting the Model tab.
Specify the Plot Offset (such as
0in both the X and Y directions).Specifying the Plot Offset as 0 in both X and Y directions places the lower-left corner of the plotted drawing at the lower-left corner of the printable area.
In the Plot Scale area, select 1:1 from the Scale drop-down list, as shown in Figure 16-6.
One of the big advantages of layouts is that you don't need to know anything about drawing scale in order to plot the drawing — hence the name paper space. Figure 16-6 shows the proper settings for plotting a layout.
Tip
To create a half-size plot of a layout, select 1:2 from the Scale drop-down list. In addition, select the Scale Lineweights check box in order to reduce lineweights proportionally. (I cover plotting lineweights in the next section.)
If you find that the layout is too big for your plotter's largest paper size at a plot scale of 1:1, you can select Extents from the What to Plot drop-down list and then select the Fit to Paper check box in the Plot Scale area. Alternatively, you can close the Plot dialog box and fix the problem if you want to have a paper space layout that permanently reflects a new paper size. Use the Page Setup dialog box to modify the layout settings, or copy the layout and modify the new copy.
Click the More Options button and change any additional plot options that you want to.
Refer to Steps 11 through 13 in the earlier section, "Plotting success in 16 steps."
Click the Preview button, ensure that the drawing displays on the paper at the correct orientation and size, and then right-click and choose Exit to return to the Plot dialog box.
If you found any problems in the preview, change your plot settings and preview again until it looks right.
Click OK to create the plot.
In previous sections of this chapter, I help you gain some plotting confidence. Those sections show you how to create scaled, monochrome plots with uniform lineweights in model space or paper space. Those skills may be all you need, but if you care about controlling plotted lineweights and colors or adding special effects such as screening (plotting shades of gray), read on.
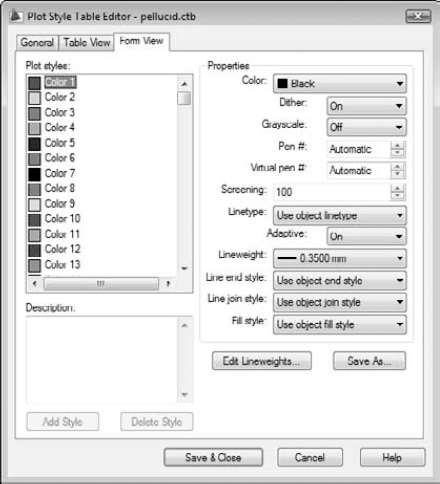
Plot styles provide a way to override object properties with alternative plot properties. (See Chapter 6 for information about object properties.) The properties include plotted lineweight, plotted color, and screening (plotting shades of gray). Figure 16-7 shows the full range of options. Plot styles come in two exciting flavors:
Color-dependent plot styles are based on the standard way of plotting in earlier versions of AutoCAD (before AutoCAD 2000), whereas named plot styles provide a newer way.
It's remotely possible that you won't need to bother with plot styles. If the drawings you want to plot have layer and object properties (especially lineweight) that reflect how you want objects to plot, you can dispense with plot styles. But most people and most drawings use plot styles, so you should at least be familiar with them.
A couple of common reasons for using plot styles are to
Map screen colors to plotted lineweights. If this idea seems completely loony to you, try to suspend judgment until you've read the "Plotting through thick and thin" section, a bit later in this chapter.
Create screened lines on monochrome plots. Lines that are screened display in various shades of gray, not black. Drafters sometimes use screened lines to de-emphasize secondary objects that otherwise would overwhelm the main objects in the drawing. Screening is expressed as a percentage, with 100 percent being completely black and 0 percent being invisible.
If you want objects in your drawing to plot with properties that differ from their display properties, you need plot styles. For example, you can plot with different lineweights or colors from the ones you're using for display purposes. Or, as I mention in the preceding section, you may need to map display colors to plotted lineweights. AutoCAD groups plot styles into plot style tables, each of which is stored in a separate file.
Color-based plot styles live in color-dependent plot style table (CTB) files, and they map the 255 AutoCAD display colors to 255 plot styles. AutoCAD automatically attaches the color-dependent plot styles to every object, based on — you guessed it — the object's color. (Are those AutoCAD programmers brilliant, or what?) Color-dependent plot style tables mimic the old color-mapped-to-lineweight plotting approach of AutoCAD R14 and earlier releases; this remains the most common method in most companies.
Named plot styles were introduced in AutoCAD 2000, and are object properties, just like color, linetype, and lineweight. Named plot styles live in (wouldn't you know it?) named plot style table (STB) files. After you've created a named plot style table, you create one or more plot styles and give them any names you like. Then you can assign the named plot styles to layers or to individual objects. (See Chapter 6 for more information about object and layer properties.)
To use the plot styles in a plot style table (whether they're color-dependent or named), you must attach the plot style table to model space or a paper space layout. The attached plot style table affects plotting only for that layout or for model space. This approach lets you plot the same drawing in different ways by attaching different plot styles to different tabs.
You can attach a plot style to model space or a paper space layout by selecting its image in the Quick View Layouts panel and opening the Plot dialog box, or by right-clicking over an image and choosing Page Setup Manager. Choose the plot style table name in the Plot Style Table (Pen Assignments) area of the expanded Page Setup or Plot dialog box. See the section "Controlling plotted lineweights with screen colors," later in this chapter, for an example.
Note
When you start a new drawing in the usual way — that is, by using a template drawing (see Chapter 4) — the template drawing's plot style behavior determines whether you can choose CTB or STB files. If you want to change from color-dependent plot styles to named plot styles (or vice versa) in a particular drawing, use the CONVERTPSTYLES command.
If you're really lucky, you won't need to use plot styles. If you're somewhat lucky, you'll need to use plot styles, but someone will provide the plot style table files for you. If that's the case, you must put the CTB or STB files in your Plot Styles folder in order for AutoCAD to recognize them. (To find the location of your Plot Styles folder, open the Options dialog box, choose the Files tab, and look for the Printer Support File Path
If you're not lucky at all, you'll need to be smart — that is, you'll want to know how to create your own plot style table files. Here's how:
On the Plot panel of the Ribbon's Output tab, click Plot Style Manager (or choose File
The Plot Styles folder opens in a separate window.
Double-click the Add-a-Plot Style Table Wizard program shortcut.
Read the opening screen and then click Next.
On the Add Plot Style Table - Begin page, choose the Start from Scratch option or one of the other three options if you want to start with settings from another file. Then click Next.
The remaining steps in this procedure assume that you chose Start from Scratch. If you chose another option, simply follow the wizard's prompts.
On the Add Plot Style Table - Pick Plot Style Table page, choose whether you want to create a color-dependent plot style table (CTB file) or a named plot style table (STB file). Then click Next.
Choose Color-Dependent Plot Style Table in order to map screen colors to plotted lineweights. Choose Named Plot Style Table in order to create named plot styles that you can apply to layers or objects.
On the Add Plot Style Table - File Name page, type a name for the new CTB or STB file and then click Next.
Click the Plot Style Table Editor button on the Add Plot Style Table - Finish page.
The Plot Style Table Editor dialog box opens to the Form View tab if you're creating a color-dependent plot style table (refer to Figure 16-7), or to the Table View tab if you create a named plot style table.
Note
If you choose a named plot style in Step 5, the Plot Style Table Editor dialog box opens in Table View, with one plot style named Normal in the first data column, a blank column to its right, and Add Style and Delete Style buttons at the bottom. New named plot styles that you create continue to be added in columns to the right of the previous column. For more information, click the Help button in the Plot Style Table Editor.
If you created a color-dependent plot style table, assign Lineweight, Screening, or other plot properties to each color that's used in the drawing. If you created a named plot style table, click the Add Style button and then assign plot properties to each of the named styles that you create.
To determine which colors are used in a drawing, switch to the AutoCAD window and open the Layer Properties Manager palette by clicking the Layer Properties button located on the Layers panel of the Home Ribbon (or the classic Layers toolbar).
Tip
To change a setting for all colors or named styles, select all of them first by clicking the first color or named style, holding down the Shift key, scrolling to the end of the list, and then clicking the last color or named style. Any subsequent changes you make get applied to all the selected colors or named styles.
Click the Save & Close button to close the Plot Style Table Editor dialog box. Then click Finish to complete the steps for the wizard.
The Plot Styles folder now displays your new CTB or STB file.
Close the Plot Styles folder by clicking the X in its title bar.
Creating your first plot style table can be a harrowing experience because you have so many options. Just remember that your most likely reason for creating one is to map screen colors to plotted lineweights (as I describe in greater detail in the next section). Also remember that you may be able to minimize your effort by getting a CTB or STB file from the person who created the drawing that you want to plot.
Note
In Chapter 6, I recommend that you limit yourself to the first nine Standard AutoCAD Colors when defining layers, and not a patchwork of the 255 colors that AutoCAD makes available. If you follow my advice, your work to create a color-dependent plot style table will be much reduced because you'll have to assign plot properties for only 9 colors, rather than worrying about 255 of them.
Tip
You can use the file found in C:Program FilesAutoCAD 2009SamplePlot Screening and Fill Patterns.dwg for systematic testing of your CTB files. This drawing shows an array of color swatches for all 255 AutoCAD colors. The layouts (such as Grayscale and Screening 25%) demonstrate how different CTB files attached to the same layout produce radically different results.
Warning
Named plot styles hold a lot of promise, but there are at least a couple of places — dimensions and tables — where they don't work as well as traditional color-based plotting. Dimension properties allow you to assign different colors to dimension lines, extension lines, and text. The purpose for this is to allow different parts of a dimension object to print with different lineweights; for example, you can have your dimension text print with a medium lineweight, the same as your annotation text, while keeping extension and dimension lines to a fine lineweight. But because named plot styles are based on objects or layers, you don't have that lineweight control over individual dimension components. The same limitation applies to tables, where you can set your text to be one color and your grid lines to be another.
If you really get carried away and decide to take advantage of the 16 million-odd colors in AutoCAD's True Color or Color Book modes, you're not going to be controlling lineweights with color-dependent plot styles. CTB plot styles affect the lineweights only of objects that use the traditional 255 colors of the AutoCAD Color Index palette. If you want true color or Color Book colors, use object lineweights or named plot styles to control plotted lineweight.
Long ago, manual drafters developed the practice of drawing lines of different thicknesses, or lineweights, in order to distinguish different kinds of objects. Manual drafters did it with different technical ink pen nib diameters or with different hardnesses of pencil lead and varying degrees of pressure on the pencil. Because a computer mouse usually doesn't come with different diameters of mouse balls, the AutoCAD developers had to figure out how to let users indicate lineweights on-screen and on a plot. They came up with two different ways to indicate lineweight:
Mapping on-screen colors to plotted lineweights. I describe this common approach in Chapter 6.
Displaying lineweights on-screen to match what the user can expect to see on the plot. This approach first appeared in AutoCAD 2000.
Plotting object lineweights is trivial, assuming that the person who created the drawing first took the trouble to assign a lineweight property to layers or objects (see Chapter 6 for details). Just make sure that the Plot Object Lineweights check box in the expanded Plot dialog box is selected. You may also want to deselect the Plot with Plot Styles check box because plot styles can override the object lineweights with different plotted lineweights. You can also make these settings in the Page Setup dialog box for the appropriate layout or Model tab. To access the Page Setup Manager, right-click the Quick View Layouts button on the status bar and choose Page Setup Manager.
Tip
If you want object lineweights to control plotted lineweights, make sure that the Plot Object Lineweights check box is selected in the Plot Options area of the Plot or Page Setup dialog box. If you don't want to plot the lineweights assigned to objects, you must deselect both the Plot Object Lineweights and Plot with Plot Styles check boxes in the Plot or Page Setup dialog box. Selecting Plot with Plot Styles selects Plot Object Lineweights as well.
To map screen colors to plotted lineweights, you need a color-dependent plot style table (CTB file), as I describe in the section "Plotting with style," earlier in this chapter. If you're plotting a drawing created by someone else, that someone else may be able to supply you with the appropriate CTB file or, at least, with a PCP or PC2 file from which you can create the CTB file quickly. At the very least, the creator of the drawing should be able to give you a printed chart showing which plotted lineweight to assign to each AutoCAD screen color. Use the instructions in the "Plotting with style" section to copy or create the required CTB file.
Warning
Unfortunately, no industry-wide standards exist for mapping screen colors to plotted lineweights. Different offices do it differently. That's why it's so useful to receive a CTB, PCP, or PC2 file with drawings that someone sends you.
After you have the appropriate CTB file stored in your Plot Styles folder, follow these steps to use it:
Click the Quick View Layouts button on the status bar to open the Quick View Layouts panel. Move the mouse pointer to the image of model space or the layout that you want to plot.
As you move the pointer over each image panel, icons for the PLOT and PUBLISH commands appear at the upper corners.
Click the Plot button in the upper-left corner of the selected image.
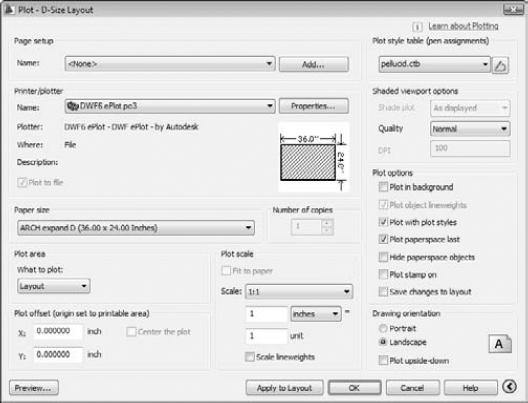
The Plot dialog box opens. Click the More Options button if the dialog box doesn't open in expanded mode as shown in Figure 16-8.
In the Plot Style Table (Pen Assignments) area on the Plot dialog box, select the CTB file from the drop-down list, as shown in Figure 16-8.
This action attaches the plot style table (CTB file) to the layout or model tab that you clicked in Step 1.
Click the Apply to Layout button.
AutoCAD records the plot setting change with the current layout's configuration information. Assuming that you save the drawing, AutoCAD uses the CTB that you selected as the default plot style when you (or other people) plot that layout in the future.
Continue with the plotting procedures described earlier in this chapter.
If your drawing uses a named plot style table instead of a color-dependent plot style table, you follow the same procedure, except that you select an STB file instead of a CTB file in Step 3.
Tip
You can tell whether the current drawing was set up to use color-dependent plot styles or named plot styles by looking at the Properties panel on the Ribbon's Home tab. If the lower right drop-down list is grayed out, shows ByColor, and doesn't display a tooltip, the drawing uses color-dependent plot styles. If this list isn't grayed out and displays the Selects a plot style tooltip, the drawing uses named plot styles.
Plotting the colors that you see on-screen requires no special tricks. In the absence of a plot style table (that is, if you selected None from the drop-down list in the Plot Style Table [Pen Assignments] area in the Plot or Page Setup dialog box), AutoCAD sends color information as it appears on-screen to the plotter. As long as your output device can plot in color, what you see should be what you get.
If you attach a plot style table to the layout that you're plotting (as described in the previous section), you can — if you really want to — map screen colors to different plotted colors. In most cases, you don't want that kind of confusion. Instead, leave the Color property in the plot style table set to Use Object Color.
Warning
If your goal is not to plot color, make sure that you set the Color property for all plot styles to Black. If you try to plot colors on a monochrome device, you may find that objects appear in various shades of gray, with lighter colors mapped to lighter shades of gray and darker colors to darker shades of gray. This process of mapping colors to shades of gray is called dithering, and it usually is not what you want in a CAD drawing. To override it, use the Plot Style Table Editor, as described in the section "Creating plot styles," earlier in this chapter, to set the Color option for all colors to Black. (The default setting is Use Object Color.) If you don't already have a plot style table that you want to use, select monochrome.ctb for color-based plot styles or select monochrome.stb for named plot styles — both of which come with AutoCAD — from the drop-down list in the Plot Style Table (Pen Assignments) area of the Plot dialog box.
Tip
To see the full range of AutoCAD colors available on your plotter, or to see how a particular plot style table affects plotting, open and then plot the file C:Program FilesAutoCAD 2009SamplePlot Screening and Fill Patterns.dwg. The Screening 100% layout in this drawing contains color swatches for all 255 AutoCAD colors.
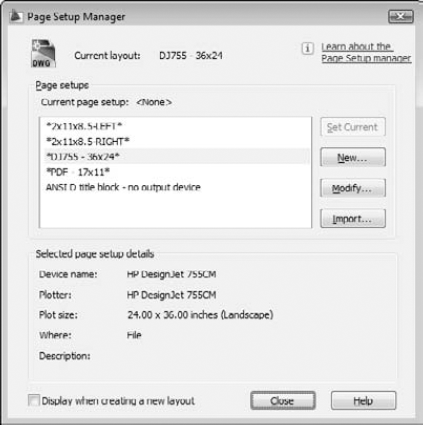
Page setups specify the plotter, paper size, and other plot settings that you use to plot a particular layout or the model space of a drawing. AutoCAD maintains separate page setups for model space and for each paper space layout. When you click the Apply to Layout button in the Plot dialog box (or select the Save Changes to Layout check box and then click OK to plot), AutoCAD stores the current plot settings as the page setup for the current layout.
You can also give page setups names and save them. The advantage of doing so is that you can switch quickly between different plot settings and copy plot settings from one drawing layout to another. Named page setups are stored with each drawing, but you can copy them from another drawing into the current one with the Page Setup Manager dialog box (described later in this section).
If you want to get fancier, you can create named page setups in order to plot the same layout (or model space) in different ways, or to copy plot settings from one layout to another or one drawing to another. Click the Add button in the Page setup area of the Plot dialog box to create a named page setup from the current plot settings. After you create a named page setup, you can restore its plot settings by choosing it from the Page Setup Name drop-down list.
For even greater control, right-click Quick View Layouts on the status bar and choose Page Setup Manager (that's File
In previous sections of this chapter, I cover most of the important options in the Plot dialog box. This section reveals a few more fine points that will make your plotting life easier. I don't cover every minute, obscure, useful-only-at-cocktail-party-discussions detail. (And if this sounds like your kind of cocktail party, remind me that I'm busy that night!) I do point out some occasionally useful options that will increase your vocabulary when you're communicating with the Plot dialog box.
Hover your mouse pointer over the part of the dialog box that you want to know more about.
Press F1 or click the Help button at the bottom of the dialog box if the pop-up help isn't enough.
For a more conceptual take on plotting, click the Learn about Plotting link to view the Quick Start to Plotting section of the online help.
The following list explains most of the remaining controls, check boxes, and lists in the Plot dialog box:
Printer/Plotter: As I describe in the section "Configure it out," earlier in this chapter, you use the Name drop-down list to select the Windows system printer or non-system driver configuration that you want to use for plotting.
Clicking the Properties button opens the Plotter Configuration Editor dialog box, with which you can change media (type of paper) and other properties that are unique to the currently selected plotter or printer. In particular, you can define custom paper sizes.
Warning
As if AutoCAD's Plot dialog box settings weren't overwhelming enough, depending on your plot device, you may also have to deal with the Plotter Configuration Editor dialog box. Some plotter drivers hide important settings in this dialog box. To access them, you typically click the Custom Properties button near the bottom of the Plotter Configuration Editor dialog box. For example, if you're using the enhanced Windows system driver for HP plotters, available at
www.designjet.hp.com, you can click the Custom Properties button and then the More Sizes button to specify which paper sizes are available to you on the Paper Size drop-down list of the main Plot dialog box.Note
To make matters even more confusing, if you make any changes in the Plotter Configuration Editor dialog box, AutoCAD prompts you to save the changes to a separate PC3 file. You should choose Save Changes to the Following File (that is, create a new AutoCAD-specific configuration that includes the revised settings) and type a configuration name that you'll recognize later. When you want to plot with custom settings, remember to choose the AutoCAD-specific PC3 configuration near the end of the Printer/Plotter Name drop-down list, and not the original Windows system printer configuration near the beginning of the list.
Plot to File: If you need to plot to a file rather than directly to your plotter or network printer queue, select the Plot to File option. When you click OK to plot, AutoCAD asks you for a plot filename and location.
Tip
This option is especially useful when you want to use the ePlot feature to publish a DWF file on a Web site. You also may need to use this option to create files to send to a plotting service bureau.
Note
AutoCAD 2009 adds DWFx to its ePlot options. DWFx is a flavored version of DWF that conforms to Microsoft's XPS page description language. For most people, the handiest thing about this format is that if you plot to DWFx, the resulting file can be displayed — in Windows Vista only — in Windows Explorer.
Plotting to the
DWG to PDF.pc3file creates versions of your drawing files that can be opened and viewed in the free and widely available Adobe Reader software.Plot Stamp On: Use this option to turn on and off and configure the contents of a text string that AutoCAD adds automatically to the corner of each plot. The plot stamp can include useful information such as the drawing filename and plot date and time.
Plot Area: Specify the area of the drawing to plot. Your choices include Display, Extents, and Window, regardless of whether you're plotting a paper space layout or model space. If you defined named views in the drawing, AutoCAD adds a View option. The additional choice is Layout for a paper space layout or Limits for model space.
Display means the drawing as it's currently displayed in the drawing window (including any empty space around the drawing objects).
Extents means the rectangular area containing all the objects in the drawing.
Limits (full-screen model space only) means the model space area that you specified (you did tell your drawing its limits, didn't you?) when you set up the drawing. (See Chapter 4 for details.)
Layout (Layouts only) means the paper space area you defined when you set up the layout.
Window means a rectangular area that you specify.
View means a named view, which you select from the drop-down list. (Chapter 12 describes named views and how to create them.)
Tip
Usually, you'll choose to plot Layout in paper space. For model space, the choice depends on whether the drawing was set up properly and what you want to plot. If you set limits properly, as I describe in Chapter 4, then plot Limits in order to get the whole drawing area. If you're trying to plot a drawing in which the limits weren't set properly, try Extents instead. Use Window or View if you want to plot just a portion of model space.
Plot Offset: A plot offset of X=0 and Y=0 positions the plot at the lower-left corner of the plottable area. If you want to move the plot from this default position on the paper, enter non-zero numbers or select the Center the Plot check box. (The Center the Plot check box is available only when you haven't selected Layout from the What to Plot drop-down list.)
Shaded Viewport Options: If your drawing includes viewports showing shaded or rendered 3D models, use this area to control the plotted appearance.
Plot Options: The Plot Object Lineweights and the Plot with Plot Styles check boxes control whether AutoCAD uses the features described in the "Plotting with style" and "Plotting through thick and thin" sections, earlier in this chapter.
Note
The Hide Paperspace Objects check box controls whether AutoCAD hides objects that are behind other objects when a 3D model is displayed in a viewport. If your drawing is entirely 2D, this option doesn't matter. If your drawing includes 3D objects, selecting this setting is like applying the 3DORBIT command's Hidden option to the plot. Look up "3DORBIT command" on the Index tab in the AutoCAD online help system for more information.
Plot Upside-Down: Select this check box if you want to rotate the plot 180 degrees on the paper. (It's a handy option for plotting in the southern hemisphere or for avoiding having to cock your head at an uncomfortable angle as you watch plots come out of the plotter.)
AutoCAD normally generates plots in the foreground — that is, the plotting process takes over the program for the entire time that the program is creating the plot. AutoCAD 2009 includes a background plotting feature that returns control of the program to you more quickly. If you have a reasonably fast computer with adequate memory, turn on this feature in the Options dialog box: Type OPTIONS (OP) and press Enter, click the Plot and Publish tab, and in the Background Processing Options area, select Plotting.
Tip
If you want to automate plotting for a batch of drawings, check out AutoCAD's sheet sets feature. One of the tasks that sheet sets are designed to accomplish is the publishing of a set of drawing sheets at one fell swoop. If this sounds like your ticket to plotting bliss, go to the online help system and look in Contents
No matter how many times you read this chapter or how carefully you study the AutoCAD documentation, you'll occasionally run into plotting problems. You're especially likely to encounter problems when trying to plot other people's drawings because you don't always know what plotting conventions they had in mind. (Plotting conventions aren't where spies meet; they're a standardized approach to plotting issues.) Table 16-1 describes some of the more common plotting problems and solutions.
Table 16-1. Plotting Problems and Solutions
Problem | Possible Solution |
|---|---|
Check whether you can print to the device from other Windows applications. If not, it's not an AutoCAD problem. Try the Windows Print Troubleshooter (Windows XP: Start | |
Nothing comes out of the plotter (non-system printer driver). | Choose Plotter Manager on the Output Ribbon's Plot panel (or File |
Objects don't plot the way they appear on-screen. | Check for a plot style table with weird settings or try plotting without a plot style table. |
Objects appear ghosted or with washed-out colors. | In the plot style table, set Color to Black for all colors. |
Scaled to Fit doesn't work right in paper space. | Change the What to Plot drop-down list from Layout to Extents. |
The HP-enhanced Windows system driver that you downloaded from HP's Web site doesn't have the right paper sizes (for example, no architectural paper sizes). | In the Plot dialog box's Printer/Plotter area, click the Properties button to display the Plotter Configuration Editor dialog box, click the Custom Properties button (near the bottom), and then click the More Sizes button to specify the standard and custom paper sizes. |
Something else is wrong. | Check the plot log: Click the Plot/Publish Details Report Available icon near the right end of the status bar and look for error messages. |