
Drawing Data
Create a new file with the shortcut ⌘N and choose the Cocoa Touch Class template. In the Class text field, type in the name DiagramView and make it a subclass of UIView. Click Next and then click Create.
Xcode creates a subclass of UIView and fills it with some comments to get us started. Remove the lines with the comments and the multiline comment strings such that the class looks like this:
| | class DiagramView: UIView { |
| | override func draw(_ rect: CGRect) { |
| | } |
| | } |
UIKit calls the draw method of a UIView subclass whenever the view is rendered on-screen. We have to put our drawing code into this method. But before we can draw data, we need to have it available in the view class. Add the following property to DiagramView:
| | class DiagramView: UIView { |
| | |
| » | var dataArray: [AccelerationData] = [] |
| | |
| | override func draw(_ rect: CGRect) { |
| | } |
| | } |
Next, add the highlighted code to the draw(_:) method:
| | override func draw(_ rect: CGRect) { |
| | |
| » | let width = frame.size.width |
| » | let height = frame.size.height |
| » | let y0 = height/2.0 |
| » | |
| » | var maximum = 0.0 |
| » | for data in dataArray { |
| » | maximum = max(maximum, abs(data.value)) |
| » | } |
| | } |
The view doesn’t know about acceleration or time frames, but it knows the frame it needs to draw. To be able to scale the acceleration data and the time values to the available space in the view, we assign the width and the height of the view and the maximum of all values to constants. In addition, we store half the height to use it later as the vertical zero line.
The data will be drawn using an instance of UIBezierPath, which is a path consisting of line segments that we can render in our custom views. Add the highlighted code to draw(_:):
| | override func draw(_ rect: CGRect) { |
| | |
| | let width = frame.size.width |
| | let height = frame.size.height |
| | let y0 = height/2.0 |
| | |
| | var maximum = 0.0 |
| | for data in dataArray { |
| | maximum = max(maximum, abs(data.value)) |
| | } |
| | |
| » | let bezierPath = UIBezierPath() |
| » | |
| » | guard let firstPoint = dataArray.first, |
| » | let lastPoint = dataArray.last, |
| » | maximum > 0 else { |
| » | return |
| » | } |
| » | let scale = height / (CGFloat(maximum) * 2.0) |
| » | let y = y0 + CGFloat(firstPoint.value) * scale |
| » | bezierPath.move(to: CGPoint(x: 0, y: y)) |
| | } |
The properties first and last defined on Array return the first and the last element, respectively. If the array is empty, these values are nil; if the array has only one element, first and last both return this element. To scale the values in the diagram for optimal presentation, we’ll divide by maximum. Dividing by zero is mathematically not allowed, so we need to make sure that we proceed only when maximum is greater than zero.
Next we calculate the scale for the acceleration values. Because the zero line is a horizontal line through the center of the view, we have to scale the values to half the height of the view. Then we calculate the first value using the zero value y0 and the scaled value of the data point. We add this value to the Bézier path using the move(to:) method. Think about this like drawing with a pencil. Before we draw the first segment, we have to move the pencil to the location where the segment should start.
Now add the highlighted lines to the end of draw(_:):
| | override func draw(_ rect: CGRect) { |
| | |
| | // ... |
| | // define constrants |
| | // ... |
| | |
| | let bezierPath = UIBezierPath() |
| | |
| | guard let firstPoint = dataArray.first, |
| | let lastPoint = dataArray.last, |
| | maximum > 0 else { |
| | return |
| | } |
| | let scale = height / (CGFloat(maximum) * 2.0) |
| | let y = y0 + CGFloat(firstPoint.value) * scale |
| | bezierPath.move(to: CGPoint(x: 0, y: y)) |
| | |
| » | let totalTime = lastPoint.timestamp - firstPoint.timestamp |
| » | if totalTime == 0 { |
| » | return |
| » | } |
| » | for dataPoint in dataArray { |
| » | let timeDiff = dataPoint.timestamp - firstPoint.timestamp |
| » | let x = CGFloat(timeDiff / totalTime) * width |
| » | let y = y0 + CGFloat(dataPoint.value) * scale |
| » | bezierPath.addLine(to: CGPoint(x: x, y: y)) |
| » | } |
| | } |
In this code we first calculate the total time frame of the collected data. This value will be used to scale the time values on the x-axis such that they span the whole width of the view. Because we’re going to divide by the total time, we need to make sure that the value is not zero.
Then, for each data point, we calculate the x- and y-values for the corresponding point in the Bézier path. The x-value is the time difference to the first data point scaled to the width of the view using the total time frame. We calculate the y-value as we did for the first point. The result is added to the Bézier path using the addLine(to:) method.
The Bézier path is now complete and we can draw it with the highlighted lines in the following code:
| | override func draw(_ rect: CGRect) { |
| | |
| | // ... |
| | // define constrants |
| | // ... |
| | |
| | // ... |
| | // setup bezier path |
| | // ... |
| | |
| » | UIColor.label.setStroke() |
| » | bezierPath.lineWidth = 1 |
| » | bezierPath.stroke() |
| | } |
The code sets the stroke color and the line width for the Bézier path and then draws it by calling stroke. The color label should be used for static text and related elements. We use it here because this way the drawn line is visible in dark and light mode.
Now we can use the diagram view in the storyboard. Open Main.storyboard, select the blank view in the stack view, and open the identity inspector with the shortcut ⌥⌘4. Type DiagramView into the Class text field and hit return.
To update the diagram view when new acceleration data is available, first we need a reference to it in the view controller. If it’s not already open, open the assistant editor using the shortcut ⌃⌥⌘↩. Press and hold control and drag a connection from the view into the code below the xAccelerationData property:
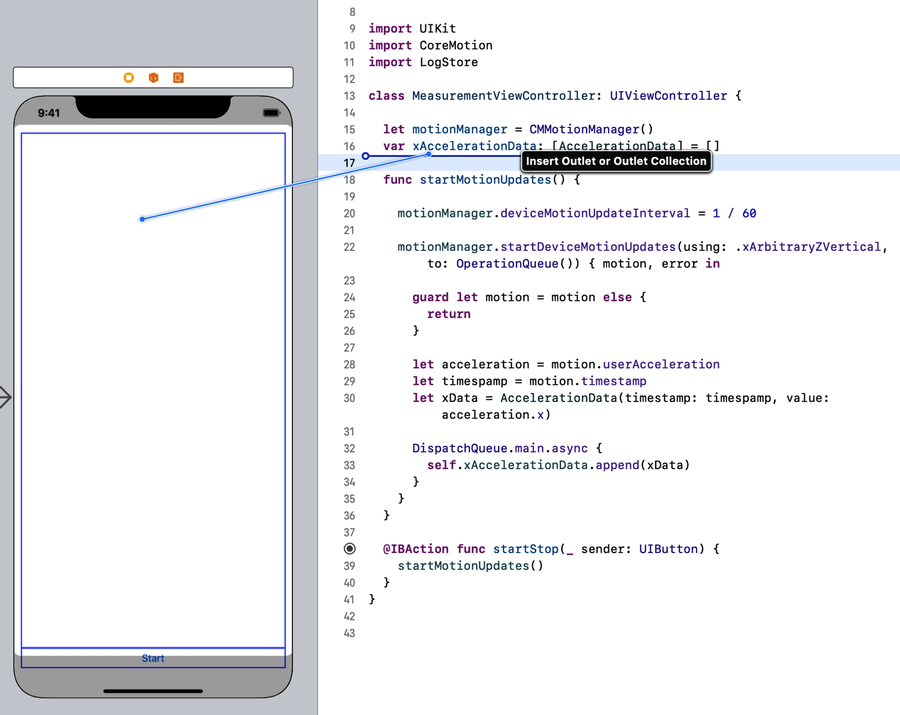
Make sure the connection is set to Outlet, type in the name xDiagramView, and click Connect.
Xcode adds the highlighted property to MeasurementViewController:
| | let motionManager = CMMotionManager() |
| | var xAccelerationData: [AccelerationData] = [] |
| » | @IBOutlet var xDiagramView: DiagramView! |
Next, replace the declaration of xAccelerationData with the following code:
| | var xAccelerationData: [AccelerationData] = [] { |
| | didSet { |
| | xDiagramView.dataArray = xAccelerationData |
| | } |
| | } |
With this code we add a didSet observer to the xAccelerationData property. The didSet observer of a property is called immediately after a new value is assigned. In the observer, we pass the collected acceleration data to the diagram view.
Now we need to trigger the drawing of the data in the diagram view when new data arrives. Open DiagramView and replace the declaration of the dataArray property with the following code:
| | var dataArray: [AccelerationData] = [] { |
| | didSet { |
| | setNeedsDisplay() |
| | } |
| | } |
We use a didSet observer to tell the view that it should draw itself by calling setNeedsDisplay. This triggers a call of the draw(_:) method.
Build and run the application on your iPhone, tap the Start button, and shake your device. The result should look something like the image.

How cool is that? With these few lines of code, we managed to read sensor data from the device and draw it on the view. I’m sure you have lots of ideas for what you can do with these new skills. But before you explore those ideas, let’s finish our fun little app.