
Three Axes of Motion
To measure the length of the swing, the user needs to measure the period of the swing by holding the phone while swinging. Depending on how the user holds the phone, showing only the data for one direction might not be enough to figure out the peaks of the motion. The iPhone can measure acceleration along three perpendicular axes (see the image showing the arbitrary x-axis). To make it easier to measure the length of the swing, we want to display all the acceleration data to the user.
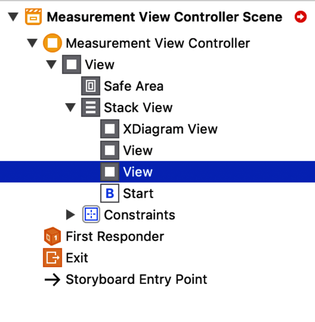
Open Main.storyboard. If the assistant editor is still open, make sure the storyboard is selected by clicking somewhere in it. Use the shortcut ⇧⌘L to open the library, search for UIView, and drag a view between the existing diagram view and the Start button. Open the library again and drag another view below the diagram view. When you are finished with this, the structure of the measurement user interface should look like the following image:
You might have noticed that there’s a red circle with an arrow at the top of the structure overview as well as red lines in the scene of the measurement view controller. The Interface Builder uses these markers to tell us that something is wrong with the layout constraints. Layout constraints are responsible for defining the position and the size of each view in the user interface. You should always fix constraint errors even if the user interface seems to work; otherwise, it could break on some devices or for some users.
The problem right now in the user interface is that there are no constraints that define the height of each of the views in the stack view. To solve the problem, we could simply add those constraints, but there’s an easier solution.
Select the diagram view and the two views we’ve just added by clicking each of them while holding down the command key. Then select the Xcode menu item Editor > Embed In > Stack View. Xcode adds a new vertical stack view and puts the selected views into it, but this doesn’t solve the layout problem yet.
Select the new stack view and open the attribute inspector with the keyboard shortcut ⌥⌘5. In the attribute inspector, select Fill Equally from the Distribution drop-down list. This solves the layout problem because it tells the stack view that the containing views should all be of the same height. As we are already here, type the value 2 into the Spacing text field to improve the layout of the stack view. This adds a space of 2 points between the arranged subviews of the stack view.
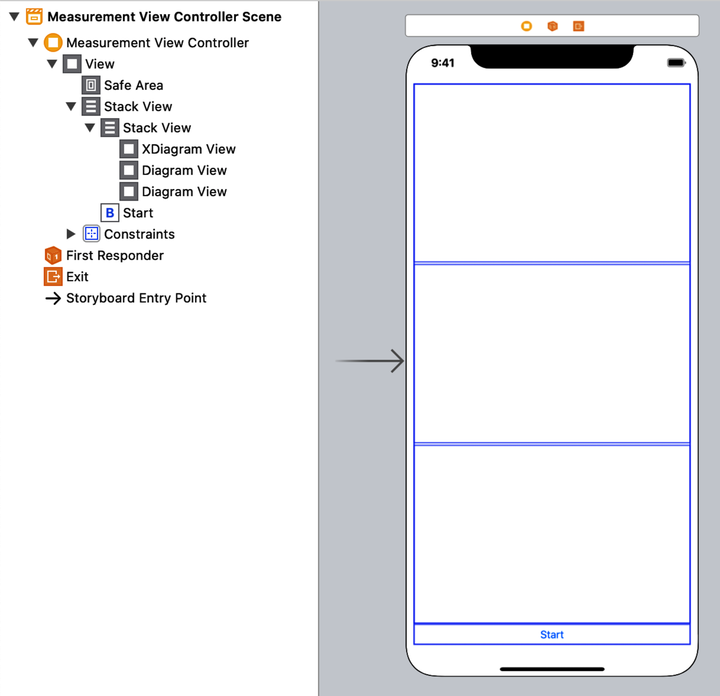
Because the stack view will show the diagrams, its arranged views need to be instances of DiagramView. Select the two plain views while holding down the command key and open the identity inspector with ⌥⌘4. In the Class text field, type the name DiagramView and hit return. The result should look like the following image:
Your button might be much taller than the one in this image. The reason is that we haven’t set the button’s hugging priority. This means the button could have many different heights and the constraints would still be valid. A high hugging priority tells the button that it should try to make its size such that all content remains visible but no larger than that. It’s like the button is pulling its edges inward.
Select the button and use the shortcut ⌥⌘6 to open the size inspector and set the vertical value in the section Content Hugging Priority to 750. It should look like the following image:

The view controller needs to hold references to the views to be able to fill them with the acceleration data. Open the assistant editor with ⌃⌥⌘↩ if it’s not already open. Press and hold control and drag a connection from the first of the new views into the code below the existing xDiagramView property. Type in the name yDiagramView, make sure Connection is set to Outlet, and click Connect. Repeat these steps for the last diagram view and name the property zDiagramView.
Now that we have the diagram views for the y and z acceleration data, let’s use them to draw the data. Open MeasurementViewController.swift and look for all the occurrences of xAccelerationData and xDiagramView. Let’s add the corresponding statements for the y- and z-axes.
We’ll start with the properties. Add the highlighted lines of the two properties right below the xAccelerationData property:
| | class MeasurementViewController: UIViewController { |
| | |
| | let motionManager = CMMotionManager() |
| | var xAccelerationData: [AccelerationData] = [] { |
| | didSet { |
| | xDiagramView.dataArray = xAccelerationData |
| | } |
| | } |
| » | var yAccelerationData: [AccelerationData] = [] { |
| » | didSet { |
| » | yDiagramView.dataArray = yAccelerationData |
| » | } |
| » | } |
| » | var zAccelerationData: [AccelerationData] = [] { |
| » | didSet { |
| » | zDiagramView.dataArray = zAccelerationData |
| » | } |
| » | } |
| | |
| | @IBOutlet var xDiagramView: DiagramView! |
| | @IBOutlet var yDiagramView: DiagramView! |
| | @IBOutlet var zDiagramView: DiagramView! |
| | |
| | // ... |
| | // methods |
| | // ... |
| | } |
This is exactly the code we wrote before for the x data. Next, scroll to the method startMotionUpdates and add the highlighted lines in the following code:
| | func startMotionUpdates() { |
| | |
| | motionManager.deviceMotionUpdateInterval = 1 / 60 |
| | |
| | xAccelerationData = [] |
| » | yAccelerationData = [] |
| » | zAccelerationData = [] |
| | |
| | motionManager.startDeviceMotionUpdates( |
| | using: .xArbitraryZVertical, |
| | to: OperationQueue()) { motion, error in |
| | |
| | guard let motion = motion else { |
| | return |
| | } |
| | print("motion: (motion)") |
| | |
| | let acceleration = motion.userAcceleration |
| | let timestamp = motion.timestamp |
| | let xData = AccelerationData(timestamp: timestamp, |
| | value: acceleration.x) |
| » | let yData = AccelerationData(timestamp: timestamp, |
| » | value: acceleration.y) |
| » | let zData = AccelerationData(timestamp: timestamp, |
| » | value: acceleration.z) |
| | |
| | DispatchQueue.main.async { |
| | self.xAccelerationData.append(xData) |
| » | self.yAccelerationData.append(yData) |
| » | self.zAccelerationData.append(zData) |
| | } |
| | } |
| | } |
This code is again exactly the same as for the x-axis. Build and run the app on your iPhone, and then start the collection of data and shake your device. If one of the diagram views doesn’t show a data curve, make sure that the names are correct. It’s easy to make copy-paste errors with this code.
To figure out the period of the motion, we need to measure the distance of two adjacent maximums or minimums in one of the diagrams. The easiest way to do this is to add movable markers to the diagrams. The user would then move the markers to the maximums.