In this chapter we will expand the scope of our development skills, and begin to leverage the vast resources of the Internet. This will give us an opportunity to take a look at using open source data, how to get that data from the web using NSURLSession and how to handle the JSON, one of the web's most common data formats, and the one in which we will receive the information that we are after.
In addition to that, you will learn to present selected parts of the data in a table, as well as presenting selected data in the form of a Glance, which is available to the user even when the main part of your watch app is not running.
And all of this with no help from the iPhone! We will be connecting to the largest source of information in history, using the smallest smart device ever to have reached the mobile tech scene.
If this sounds a little daunting, rest assured that we will be focusing on the simplest methods that are available, using a very minimal user interface, in an app with a very restricted set of features. This chapter is much more about how to get and use data than how to present it (important though that is). Indeed, you will see that the Weather Watch app involves fewer lines of code than in Chapter 5, On Q – A Productivity App.
By the end of this chapter you will have deepened your knowledge and experience of watchOS programming to a very significant extent, having covered the following topics:
- Data in JSON format
- Open source data on the net
- Apple's App Transport Security
- Passing closures as arguments to functions
- Showing user alerts
- Using tables
So, there is much to be done. Let's plan out first what we are going to need.
As we have done before, we will first get a clear idea of what we want the app to do before we write any code.
We will create an app that will download current weather data for a number of cities around the world, using data from an open source provider. The data will be stored on the device, and only refreshed after a specified period has elapsed, to keep data traffic to a minimum. The rationale here is that weather conditions don't change from one second to the next (except in Auckland), and so displaying data that has been previously downloaded makes more sense up to a certain point.
The data will be displayed in the form of a brief description next to the name of each city, presented in a table. Tapping on one of the table's rows will open a screen that will contain more details of the selected city, such as wind-speed, temperature, and the like.
One city will be singled out for special status, and the current weather summary for this city will be available as a Glance by swiping up from the watch face when the app is not running in the foreground.
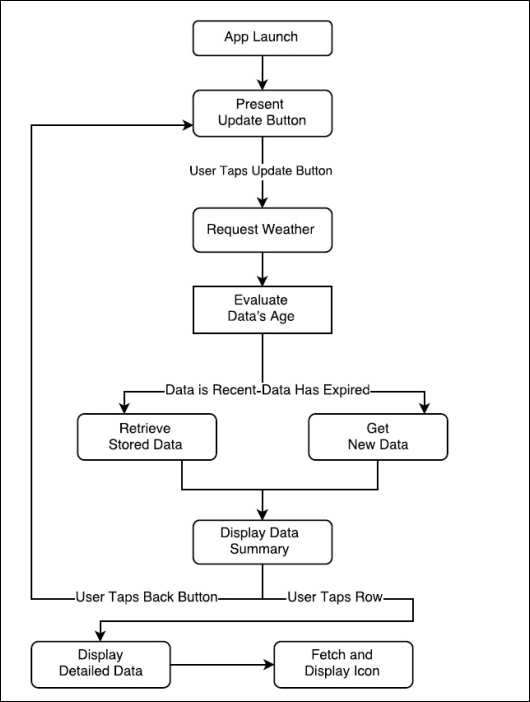
The user will open the app and be offered the opportunity to view the weather, on a screen dedicated exclusively to presenting that information (that is, no buttons or any other UI elements). On this dedicated screen, the user will be able to scroll through the rows of a table, each of which displays the name of a city and a brief textual summary of its current weather conditions. The user can choose to return to the launch screen and update the weather, or may tap a table row to reach a third screen that will contain additional information, as well as display an icon representing the weather conditions of that city.
We can sketch this out into a rough flow diagram as pictured here: