
CHAPTER 11
Data Analysis in Security Monitoring Activities
In this chapter you will learn:
• Best practices for security data analytics using automated methods
• Common sources for system and event logs and methods of analyzing them for security operations.
• Advanced techniques for e-mail analysis
• Processes to help you continually improve your security operations
Experts often possess more data than judgment.
—Colin Powell
Modern corporate networks are incredibly diverse environments, with some generating gigabytes of data every day in just logging and event information. Scripting techniques and early monitoring utilities are quickly approaching the end of their usefulness, because the variety and volume of data now exceed what these techniques and utilities were designed to accommodate. Many organizations take an approach that it’s not a matter of if a security breach will occur, but when. Discovering and preventing malicious behavior is just one of the many reasons organizations create a security operations center (SOC). Although security incidents will not always result in headline-grabbing events, organizations need to be able to introspect continuously into their network and make security-based decisions using accurate and timely data.
Security Data Analytics
Security monitoring requires that relevant data be identified before any sort of useful analysis can be performed. In security monitoring, data from various sources across the network must be collected, normalized, and visualized in a way that is useful for analysts to generate products for the purpose of making security decisions, auditing, and compliance. Managing information about your network environment requires a sound strategy and tactical tools for refining data into information, over to knowledge, and onto actionable wisdom. Figure 11-1 shows the relationship between data provided by tools at the tactical level and your goal of actionable intelligence. Data and information sources on your network are at least as numerous as the devices on the network. Log data comes from network routers and switches, firewalls, vulnerability scanners, intrusion prevention and detection systems (IPS/IDS), unified threat management (UTM) systems, and mobile device management (MDM) providers. Additionally, each node may provide its own structured or unstructured data from the services it provides. Our goal in security data analytics is to see through the noise of all this network data to produce an accurate picture of the network activity, from which we make decisions in the best interest of our organizations.

Figure 11-1 How data, information, knowledge, and wisdom work together to create actionable intelligence
Data Aggregation and Correlation
The process of collecting the correct data to inform business decisions can lead to frustration, particularly if the sources are heterogeneous. After all, data ought to be a benefit rather than an impediment to your security team. To understand why data organization is so critical to security operations, we must remember that no single source of data is going to provide all that is necessary to understand an incident. When detectives investigate a crime, for example, they take input from all manner of sources to compile the most complete picture possible. The video, eyewitness accounts, and forensics that they collect all play important parts in the analysis of the physical event. Before a detective can begin analyzing what happened, she must collect, tag, order, and display evidence in a way that it useful for analysis. A similar practice, called data aggregation, will enable your team to compare similar data types easily, regardless of their source. The first step in this process usually involves a log manager that collects and normalizes data from sources across the network. With the data consolidated and stored, it can then be displayed on a timeline for easy search and display.
Suppose you have gathered a ton of data in the aggregation process. At this point, you may have packet captures, NetFlow records, and log files collected from firewalls, IDSs, and system events. Where do you start? There are at least two schools of thought on this: you can start with the tool you have in front of you, or you can start with an observation. When you start your analysis with a tool (or a set of tools), you may choose to follow a familiar workflow. The tools you use to capture the data often include at least some basic analysis tools. If nothing else, most of them offer filters that enable you to focus on items of interest. These features, however, will typically be helpful only in a pinch, when you don’t have access to anything better. To perform real analysis work, you will need a comprehensive tool with which you can simultaneously look at all the data at your disposal. Broadly speaking, these tools fall into three categories:
• Security information and event management (SIEM) systems These systems collect data from a variety of sensors, perform pattern matching and correlation of events, generate alerts, and provide dashboards that enable analysts to see the state of the network. One of the best-known commercial solutions is Splunk, shown in Figure 11-2, while on the open source side, the Elasticsearch-Logstash-Kibana (ELK) stack is very popular.
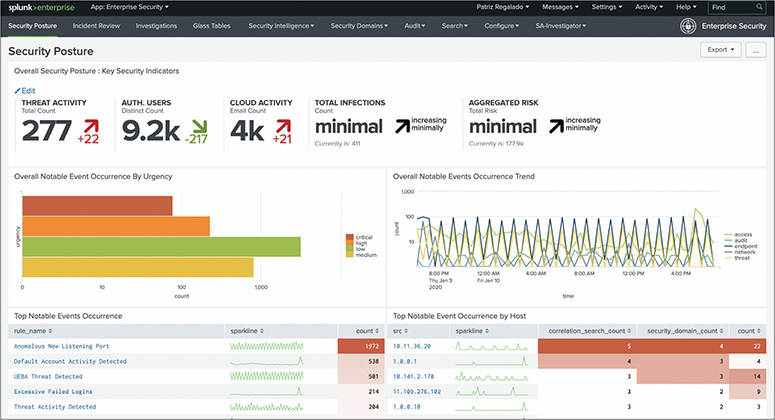
Figure 8-3 A dashboard created using the Splunk Enterprise Security SIEM to display security data
• Big data analytics solutions These solutions are designed to deal with massive data sets that are typically beyond the range of SIEMs. The term big data refers to data sets so big in terms of volume (that is, the number of records), velocity (the rate at which new records are added), and variability (the number of different data formats) that traditional databases cannot handle them. Big data platforms are normally used to complement SIEMs, not replace them.
• Locally developed analytics solutions These solutions are typically scripts developed in-house by security analysts. PowerShell and Python are popular languages used to develop these tools, which are typically built to perform very specific functions in addition to or in lieu of a SIEM.
Another approach to analysis is to start with an observation, regardless of the tool that enabled you to make it. Based on that observation, you make a hypothesis that would explain it. The next step is either to prove or to disprove that hypothesis through additional observations or experiments. If this sounds familiar, that is because we just described the scientific method, which, as you might imagine, has a lot to do with security analytics. This approach forces us to think beyond the tools at our disposal and ask questions whose answers may not be in the data we already have. If we limit ourselves and our questions to the tools and information in front of us, we will probably miss novel and potentially crippling attacks.
Data Analysis
Many security analytics tools provide built-in trend analysis functionality. Determining how the network changes over time is important as you assess whether countermeasures and compensating controls are effective. Many SIEMs can display source data in a time series, which is a method of plotting data points in chronological order. Indexing these points in a successive manner makes it much easier for you to detect anomalies, because you can roughly compare any single point to all other values. With a sufficient baseline, you’ll find it easier to spot new events and unusual download activity.
Trend Analysis
Trend analysis is the study of patterns over time to determine how, when, and why they change. You can use a number of applications to perform trend analysis. Most commonly, trend analysis is applied to security by tracking evolving patterns of adversaries’ behaviors. Every year, a number of well-known security firms will publish their trend analyses and make projections for the next year based on the patterns they discovered. This approach would, for example, prompt you to prioritize distributed-denial-of-service (DDoS) mitigations if these attacks are trending up and/or in the direction of your specific sector.
Trend analysis can be useful in the context of threat management as well as a way to determine the controls that are most appropriate within our architectures to mitigate those threats. The goal in any case, however, remains unchanged: to answer the question, “Given what we’ve been seeing in the past, what should we expect to see in the future?” When we talk about trend analysis, we are typically interested in predictive analytics.
Internal Trends
Internal trends can reveal emerging risk areas. For example, there may be a trend in your organization to store increasing amounts of data in cloud resources such as Dropbox. Although this may make perfect sense from a business perspective, it could entail new or increased risk exposure for confidentiality, availability, forensic investigations, or even regulatory compliance. By noting this trend, you will be better equipped to decide the point at which the risk warrants a policy change or the acquisition of a managed solution.
Temporal Trends
Temporal trends show patterns related to time. There are plenty of examples of an organization’s systems being breached late on a Friday night in hopes that the incident will not be detected until three days later. Paradoxically, because fewer users will be on the network over the weekend, this should better enable alert defenders to detect the attack, since the background traffic would presumably be lower. Another temporal trend could be an uptick in events in the days leading up to the release of a quarterly statement, or an increase in phishing attempts around tax season. These trends can help us better prepare our technical and human assets for likely threats to come.
Spatial Trends
Trends can also exist in specific regions. Though we tend to think of cyberspace as being almost independent of the physical world, in truth every device exists in a very specific place (or series of places for mobile devices). It is a common practice, for instance, to give staff members a “burner” laptop when they travel to certain countries. This device is not allowed to connect to the corporate network, stores a limited set of files, and is digitally wiped immediately upon the user’s return. This practice is the result of observing a trend of sophisticated compromises of devices traveling to particular countries. Another example would be the increasing connection of devices to free Wi-Fi networks at local coffee shops, which could lead to focused security awareness training and the mandated use of virtual private network (VPN) connections.
Historical Analysis
Whereas trend analysis tends to be forward-looking, historical analysis focuses on the past. It can help answer a number of questions, including “Have we seen this before?” and “What is normal behavior for this host?” This kind of analysis provides a reference point (or a line or a curve) against which we can compare other data points.
Historical data analysis is the practice of observing network behavior over a given period. The goal is to refine the network baseline by implementing changes based on observed trends. Through detailed examination of an attacker’s past behavior, analysts can gain perspective on the techniques, tactics, and procedures (TTPs) of an attacker to inform decisions about defensive measures. The information obtained over the course of the process may prove useful in developing a viable defense plan, improving network efficiency, and actively thwarting adversarial behavior. Although it’s useful to have a large body from which to build a predictive model, there is one inherent weakness to this method: the unpredictability of humans. Models are not a certainty, because it’s impossible to predict the future. Using information gathered on past performance means a large assumption that the behavior will continue in a similar way moving forward. Security analysts therefore must consider present context when using historical data to forecast attacker behavior. A simple and obvious example is a threat actor who uses a certain technique to great success until a countermeasure is developed. Up until that point, the model was highly accurate, but with the hole now discovered and patched, the actor is likely to move on to something new, making your model less useful.

EXAM TIP The difference between trend and historical analyses is small; most practitioners use the terms interchangeably. For purposes of the CySA+ exam, trend analysis helps predict future events, and historical analysis helps compare new observations to past ones.
Behavioral Analysis
Behavioral analysis is closely related to anomaly analysis in that it attempts to find anomalous behaviors. In fact, the two terms are oftentimes used interchangeably or in combination with each other, as in network behavior anomaly analysis. The difference, to the extent that there is one in practice, is quite small: behavioral analysis looks at multiple correlated data points to define anomalous behavior. For example, it may be normal behavior for a user to upload large files to an Amazon cloud platform during business hours, but it is abnormal for that user to upload large files to a Google cloud platform after hours. In behavioral analysis, data points relating to size, destination, and time are used together. In a strict interpretation of anomaly analysis, in which data points could be taken in isolation, you may have received two alerts: one for destination and one for time, which you would then have to correlate manually.
EXAM TIP You should not see questions asking you to differentiate between anomaly analysis and behavioral analysis. You could, however, see questions in which you must recall that they are both examples of data correlation and analytics (as opposed to point-in-time data analysis). You should also remember that they both leverage baselines.
Heuristics
A heuristic is a “rule of thumb” or, more precisely, an approach based on experience rather than theory. There are problems in computing that are known to be provably unsolvable, and yet we are able to use heuristics to get results that are close enough to work for us. Heuristic analysis in cybersecurity is the application of heuristics to find threats in practical, if imperfect, ways. This type of analysis is commonly seen in malware detection. We know it is not possible to find malware with 100 percent accuracy, but we also know that the majority of malware samples exhibit certain characteristics or behaviors. These, then, become our heuristics for malware detection.
Next-generation firewalls (NGFs) are devices that, in addition to the usual firewall features, include capabilities such as malware detection. This detection is usually accomplished in NGFs through heuristic analysis of the inbound data. The first approach is to take a suspicious payload and open it in a specially instrumented virtual machine (VM) within or under the control of the NGF. The execution of the payload is then observed, looking for telltale malware actions such as replicating itself, adding user accounts, and scanning resources. Obviously, certain malware families might not attempt any of these actions, which is what makes this approach heuristic: it is practical, but not guaranteed.
Anomaly Analysis
Fundamentally, anomaly analysis attempts to answer the question, “Is this normal?” Obviously, we must have first established what normal means before we can answer the question. The process by which we learn the normal state or flows of a system is called baselining. Though we can create baselines for individual systems, it is sometimes more helpful to do so for collections of them. Anomaly analysis focuses on measuring the deviation from this baseline and determining whether that deviation is statistically significant. This last part is particularly important, because everything changes constantly. The purpose of anomaly analysis is to determine whether the change could be reasonably expected to be there in a normal situation, or whether it is worth investigating.
An example of an application of anomaly analysis would be a sudden increase in network traffic at a user’s workstation. Without a baseline, we would not be able to determine whether or not the traffic spike is normal. Suppose that we have baselined that particular system and this amount of traffic is significantly higher than any other data point. The event could be classified as an outlier and deemed anomalous. But if we took a step back and looked at the baselines for clusters of workstations, we may find out that the event is consistent with workstations being used by a specific type of user (say, in the media team). Once in a while, one of them sends a large burst (say, to upload a finished film clip), but most of the time they are fairly quiet.
Endpoint Security
Focusing on security at the network level isn’t sufficient to prepare for an attacker. While we aim to mitigate the great majority of threats at the network level, the tradeoff between usability and security emerges. We want network-based protection to be able to inspect traffic thoroughly, but not at the expense of network speed. Though keeping an eye on the network is important, it’s impossible to see everything and respond quickly. Additionally, the target of malicious code is often the data that resides on the hosts. It doesn’t make sense to strengthen the foundation of the network if the rest of it doesn’t have a similar level of protection. It’s therefore just as important to ensure that the hosts are fortified to withstand attacks and provide an easy way to give insight into what processes are running.
Malware
Recognizing malicious software and its associated behaviors is critical in protecting endpoints. There are several ways that security teams can detect and respond to malware, from looking for commonly used binaries to deconstructing the software itself. The latter usually requires in-depth understanding of the architecture of the processors on which the software is intended to run. Reversing binaries is significantly different for ARM processors compared to x86 processors, for example. The principles are the same, but the devil, as they say, is in the details.
Fingerprinting/Hashing
Sometimes we can save ourselves a lot of trouble by simply fingerprinting or hashing known-good or known-bad binary executable files. Just like fingerprints have an astronomically small probability of not being unique among humans, the result of running a file through a secure hashing function is extremely unlikely to be the same for any two files. The net result is that, when you compute the SHA-256 value of a known-good file like a Windows dynamic-link library (DLL), the probability of an adversary modifying that file in any way (even by changing a single bit) and having it produce the same hash value is remote. But we are getting ahead of ourselves here.
A hashing function is a one-way function that takes a variable-length sequence of data such as a file and produces a fixed-length result called a hash value, or message digest. For example, if you want to ensure that a given file does not get altered in an unauthorized fashion, you would calculate a hash value for the file and store it in a secure location. When you want to ensure the integrity of that file, you would perform the same hashing function and then compare the new result with the hash value you previously stored. If the two values are the same, you can be sure the file was not altered. If the two values are different, you would know the file was modified, either maliciously or otherwise, so you would then investigate the event.
We can also apply hashes to malware detection by comparing the hash of the suspicious file to a knowledge base of known-bad hashes. One of the indispensable tools in any analyst’s toolkit is VirusTotal.com, a website owned and operated by Google that enables you to upload the hashes (or entire files) and see if anyone has already reported them as malicious or suspicious. Figure 11-3 shows the results of submitting a hash for a suspicious file that has been reported as malicious by 68 out of 73 respondents.

Figure 11-3 VirusTotal showing the given hash corresponds to a malicious file

NOTE Uploading binaries to VirusTotal will enable the entire worldwide community, potentially including the malware authors, to see that someone is suspicious about these files. There are many documented cases of threat actors modifying their code as soon as it shows up on VirusTotal.
Decomposition
We can tell you from personal experience that not every suspicious file is tracked by VirusTotal. Sometimes you have to dig into the code yourself to see what it does. In these situations, it is important to consider that computers and people understand completely different languages. The language of a computer, which is dictated by the architecture of its hardware, consists of patterns of 1’s and 0’s. People, on the other hand, use words that are put together according to syntactical rules. In order for people to tell computers what to do, which is what we call “programming,” there must be some mechanism that translates the words that humans use into the binary digits that computers use. This is the job of the compiler and the assembler. As Figure 11-4 shows, a human programmer writes code in a high-level language like C, which is compiled to assembly language, which is in turn assembled into a binary executable.
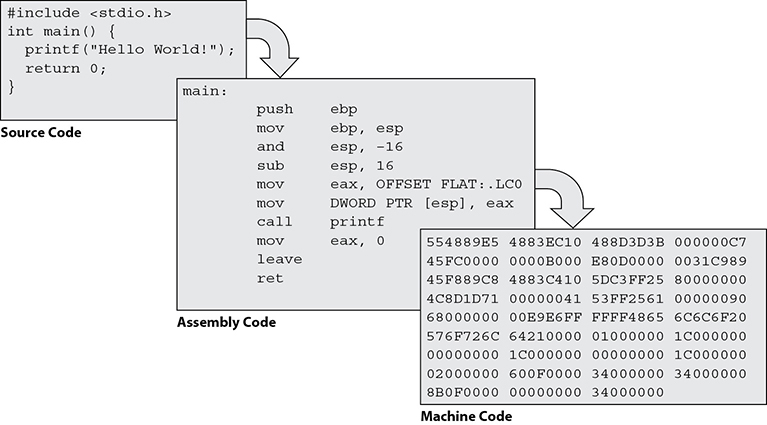
Figure 11-4 Source code being compiled and then assembled
Binary executables are specific to an operating system and processor family, which means that you cannot run a Linux program on a Windows machine. Windows programs are packaged in the Portable Executable (PE) format, in which every file starts with the 2-byte sequence 5A 4D (or 4D 5A, depending on which operating system you are using to inspect the file). By contrast, Linux executables are in the Executable and Linkable Format (ELF), in which every file starts with the 4-byte sequence 7F 45 4C 46. These starting sequences, or “magic numbers,” enable you to determine quickly which operating system is targeted by a given malware sample.
When we are analyzing malware, it is a rare thing to have access to the source code. Instead, all we usually get is a machine language binary file. To reverse-engineer this program, we need a disassembler, such as IDA Pro. The disassembler converts the machine language back into assembly language, which can then be analyzed by a reverse-engineer. Some decompilers also exist, but those are more “hit or miss,” because there are many possible programs that would compile to a given assembly language file. This means that, on average, decompilers are not worth the effort.
Detect and Block
Two general types of malware detection for endpoint solutions appear in this category. The first, signature-based detection, compares hashes of files on the local machine to a list of known malicious files. Should there be a match, the endpoint software can quarantine the file and alert the administrator of its presence. Modern signature-based detection software is also capable of identifying families of malicious code.
But what happens when the malicious file is new to the environment and therefore doesn’t have a signature? This may be where behavior-based malware detection can help. It monitors system processes for telltale signs of malware, which it then compares to known behaviors to generate a decision on the file. Behavior-based detection has become important because malware writers often use polymorphic (constantly changing) code, which makes it very difficult to detect using signature methods only.
There are limitations with both methods. False positives—files incorrectly identified as malware—can cause a range of problems. At best, they can be a nuisance, but if the detection software quarantines critical system files, the operating system may be rendered unusable. Scale this up several hundred or thousand endpoints, and it becomes catastrophic for productivity.
Fileless Malware
Unlike traditional malware, fileless, or in-memory, malware isn’t written to disk but rather directly to memory. The challenge with this method is that it doesn’t leave behind traces that can be used for rapid detecting. Additionally, since nothing is preserved to the file system, most forensics techniques used to reconstruct the series of event will not work. Fileless malware will also use existing software, such a Windows PowerShell, and authorized protocols, like Domain Name System (DNS), to carry out malicious activities.
Sandbox
Creating malware takes a lot of effort, so writers will frequently test their code against the most popular detection software to make sure that it can’t be seen before releasing it to the wild. Endpoint solutions have had to evolve their functionality to cover the blind spots of traditional detection by using a technique called sandboxing. Endpoint sandboxes can take the form of virtual machines that run on the host to provide a realistic but restricted operating system environment. As the file is executed, the sandbox is monitored for unusual behavior or system changes, and only when the file is verified as being safe can it be allowed to run on the host machine.
Historically, sandboxes were used by researchers to understand how malware was executing and evolving, but given the increase in local computing power and the advances in virtualization, sandboxes have become mainstream. Some malware writers have taken note of these trends and have started producing malware that can detect whether it’s operating in a sandbox using built-in logic. In these cases, if the malware detects the sandbox, it will remain dormant to evade detection and will become active at some later point. This highlights the unending battle between malware creators and the professionals who defend our networks.
Cloud-Connected Protection
Like virtualization, the widespread use of cloud computing has allowed for significant advancements in malware detection. Many modern endpoint solutions use cloud computing to enhance protection by providing the foundation for rapid file reputation determination and behavioral analysis. Cloud-based security platforms use automatic sharing of threat details across the network to minimize the overall risk of infection from known and unknown threats. Were this to be done manually, it would take much more time for analysts to prepare, share, and update each zone separately.
User and Entity Behavior Analytics
One increasingly useful place for applied machine learning techniques for better security is through a practice called user and entity behavior analytics (UEBA). Unlike traditional techniques, which alert on suspicious activity based on statistical analysis and predefined rules, UEBA enables analysis to detect anomalous behavior quickly when there are deviations from normal patterns, without the need for predefined rules. To do this, a system would first collect information related to user behavior and trends on a network, usually from network and system logs. Over time, UEBA solutions allow for the creation of reliable baselines of user behavior patterns. From this point, UEBA can then continuously monitor future network behavior and alert upon deviations from the norm. UEBA effectiveness relies on machine learning techniques. As a result, the upfront costs for implementing such a solution may be quite high in terms of money and time to establish a baseline. It does, however, provide insight into suspicious behaviors on a network that traditional monitoring techniques cannot provide, because it does not need predefined rules.
Network
In a well-built information system, there is no shortage of data sources that may assist in providing insight into network activity. It is important that we consider both internal and external data when determining the threats we face. Each source will have its own strengths and limitations, which we can oftentimes balance out by carefully planning our monitoring activities. In the following sections, we consider some common sources of data that are available on almost any network that will help us identify security events faster and more accurately.
Domain Name System Analysis
The DNS architecture is a critical service, but it can add complexity for an analyst when it comes time to research a machine attempting to resolve a bad or suspicious domain. Many companies use an intermediate controller or other server to perform DNS resolution in a recursive manner, meaning that they perform DNS resolution on behalf of clients. The challenge is that this often means that the source IP address in an alert will generally be that of the intermediate server, rather than the originating client. This is problematic, because these servers are often meant to handle a significant number of DNS requests, so an analyst is likely to see the same set of IPs across most alerts of this type. Although it may be possible to tie the outbound traffic to the originating machine using a few pivots, the problem increases in complexity as the network grows.
Fortunately, many modern DNS servers allow for enhanced logging, which in turn can be integrated automatically into SIEM platforms. The tradeoff in performance due to the extra collection may be worth the increased visibility into the network. An alternative to enhanced logging is to re-architect the network so that originating client information is either piped directly to the SIEM or detected by a security device before the request reaches a resolver. This technique may add complexity to the network, but it can be ideal for smaller, geographically consolidated networks. It’s important to note that storing these logs isn’t free. DNS requests on a network are certainties, and enhanced logging on servers may require gigabytes of storage daily just for logs. More daunting than the storage requirements is the sheer volume of individual log entries. For an organization of thousands, this could mean logs on the order of tens or hundreds of millions.
From a detection and blocking point of view, one of the easiest ways to reduce the number of alerts is to compare the domains and IPs resolved against a blacklist and blocking them when there’s a match. This is a comparatively low-cost method that leverages public or commercially vetted sources of known malicious infrastructures. A second technique is to look at the structure of the DNS requests and responses for anomalies. Malformed DNS traffic may be indicative of DNS manipulation, an attack on the DNS infrastructure, or advanced exfiltration techniques.
Domain Generation Algorithms
Domain generation algorithms (DGAs) are used to generate domains rapidly using seemingly random but predictable processes. Malware often depends on a fixed domain or IP addresses for command and control (C2) servers, and when domains are blocked, it is quite disruptive to the malware’s operation. By cutting the link between the malware and the C2 servers, we can prevent infected machines from retrieving new commands, updates, and keys. Malware authors have discovered, however, that they may be able to prevent this countermeasure from being effective by writing their code in such a way that it can quickly switch to new domains rather than rely on a static target. This ensures that they can maintain connectivity even when domains are blocked, and that new domains are more difficult for us to guess for future blocking.
To ensure that the malware can anticipate what the new domains will be, it will need to have some degree of predictability, while remaining difficult to anticipate for the defender. After all, this is the only way this system can work in the case of lost connectivity. To achieve this, the DGA processes will use a seed, or an initial numerical or string input, and an interval for the switch to occur.
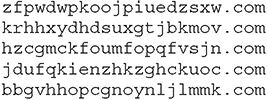
Figure 11-5 shows the Python code for a basic DGA. Line 12 of the code is the implementation of a linear congruential generator used to create pseudorandom numbers. This function, used alongside built-in functions, allows for the creation of domains as necessary. In this example, five randomized 20-character domains in the .com top-level domain (TLD) are created, as defined in line 19.

Figure 11-5 Python example of a DGA that outputs a list of pseudorandom domain names
The output of this short bit of code with an input seed of 4 is listed next. Notice that the length of each of the domain names is 20 characters, and that they all terminate in a .com. Using a similar setup, and attacker can easily achieve the desired composition of C2 URLs.
The adversary will also consider additional conditions when deploying DGAs, such as cost of domain registration, privacy of registration, and reliability of the infrastructure. Identifying the output pattern of the DGA or registrant contact information may be helpful in detecting DGA domains. Modern machine learning techniques have made it easier to classify these types of domains through various methods of quantifying randomness.
Flow Analysis
Another approach to detecting anomalous behaviors on your networks is to look at where the traffic is originating and terminating. If you are monitoring the communications of your nodes in real-time and you suddenly see an odd endpoint, this could be an indicator of a compromise. Admittedly, however, you would end up with many false positives every time someone decided to visit a new website. An approach to mitigating these false alarms is to use automation (for example, scripts) to compare the anomalous endpoints with the IP addresses of known or suspected malicious hosts.
NOTE The website VirusTotal.com is a helpful place to check quickly whether a given URL has been reported as malicious and, if so, by whom.
Traffic analysis can also be done in the aggregate—you keep an eye on the volume of traffic in a given portion of your system. A large increase in traffic coming to or from a given host could indicate a compromise. Like our previous example on monitoring unusual endpoints, this approach will lead to many false positives, absent some mechanism for pruning them. A useful open source tool we’ve used, Etherape, is shown in Figure 11-6. It graphically depicts all known endpoints, both internal and external to your organization, with circles around them to show how their size is proportional to the volume of traffic coming from them at any point in time. A host performing a port scan, for instance, would show up as a very large circle. Then again, so would a server that is streaming high-definition video. The takeaway on traffic analysis is that it is most useful as an early-warning technique that must be backed up or reinforced with additional analysis.
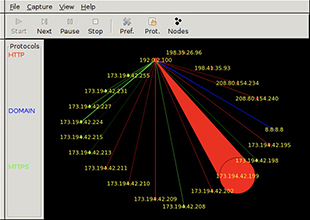
Figure 11-6 Etherape depicting a node transmitting a large amount of HTTP traffic
NetFlow Analysis
NetFlow is a system originally developed by Cisco in the late 1990s as a packet-switching technology. Although it didn’t serve that role for long, it was repurposed to provide statistics on network traffic, which is why it is important to analysts today. It works by grouping into “flows” all packets that share the following characteristics:
• Arrival interface at the network device (for example, switch or router)
• Source and destination IP addresses
• Source and destination port numbers (or the value zero if not TCP or UDP)
• IP protocol
• IP type of service
When a packet arrives at a NetFlow-enabled network device and does not belong to any known flows, the device will create a new flow for it and start tracking any other related packets. After a preset amount of time elapses with no more packets in a flow, that flow is considered to be finished. The NetFlow-enabled device will aggregate statistics about the flow, such as duration, number of packets, and number of bytes, and then export the record. NetFlow collectors will then receive the data, clean it up a bit if necessary, and store it. The final component of the system is the analysis console, which enables analysts to examine the data and turn it into actionable information.
Notice that the flow data is available for analysis only after the flow has ended. This means that this type of analysis is better suited for forensic investigations than for real-time mitigation of attacks. Furthermore, NetFlow captures aggregate statistics and not detailed information about the packets. This type of analysis is helpful in the early stages of an investigation to point the analysts toward the specific packets that should be analyzed in detail (assuming the organization is also doing packet captures).
NOTE CompTIA separates packet, traffic, and NetFlow as three distinct types of analysis for knowledge organization purposes. In reality, packet and NetFlow analyses are, by definition, types of traffic analysis. Depending on the purpose and approach, protocol and wireless analyses could also be considered types of traffic analysis. “Traffic analysis” is the umbrella term used with packet and NetFlow, and sometimes protocol and wireless analyses are considered subordinate types.
Packet Analysis
An analyst can glean a remarkable amount of information from packet capture data. In fact, given enough of it, an analyst can re-create a very precise timeline of events around any network security incident. In an ideal situation, strategically placed sensors throughout the network are doing full packet captures. The resulting data files contain a wealth of information but can consume enormous amounts of storage space. This can be a challenge, particularly for security teams with limited resources. Another challenge can be finding the useful data in a sea of packet captures.
Filters
Filters are commonly used in two ways: for capture and for display. The first use limits the amount of packets that are captured using some set criteria. For instance, an organization may choose to capture only packets whose source or destination address falls within a specific network range. An application of this could be a file server containing the organization’s crown jewels. It may be that limiting packet captures just to those to or from that sensitive server mitigates risks, while minimizing undesirable impacts such as cost of storage or potential violations of privacy. The obvious problem with using capture filters is that packets that might be useful for an investigation may never have been captured.
The other approach is to capture everything but to use filters when looking at the data. Extending the previous example, analysts can choose to look only at the packets to or from the sensitive server, but if they discover that other packets may contain useful clues, they can simply change the display filter and gain visibility over those packets as well. It is almost always better to capture too much information than not enough.
NOTE Performing full packet captures can have legal implications regarding privacy. Ensure that you consult your legal counsel before you start capturing.
TCP Streams
A noteworthy feature of the design of the Internet is that packets may take different routes to their destination and thus arrive at any given time and in any given order. Although this is normally taken care of by the Transport Control Protocol (TCP) at the transport layer, or via different mechanisms at the application layer for the connectionless User Datagram Protocol (UDP) traffic, such mechanisms are not available to an analyst when the packets are captured directly from the network. Packet analysis tools such as Wireshark offer the ability to reconstruct streams of TCP data. This is particularly useful to recover a malicious file that an employee may have inadvertently downloaded, or to see the full contents of web pages visited.
Encryption
One of the biggest problems with packet analysis is that it is of limited utility when dealing with data that has been encrypted. The analyst will have access to the headers, but the contents may be incomprehensible. Threat actors are known to use encryption to hide their deeds from prying eyes. A way to address this issue is the use of HTTPS (or “SSL”) proxies, which are proxy servers that terminate Transport Layer Security (TLS) or Secure Sockets Layer (SSL) connections, effectively acting like a trusted man-in-the-middle that enables the organization to examine or capture the contents of the otherwise encrypted session. If an organization controls the configuration of all clients on its network, it is not difficult to add a certificate authority (CA) to its browsers so that the users will not notice anything odd when they connect to an encrypted site through a decrypting proxy.
NOTE Using HTTPS proxies can have legal implications regarding privacy. Ensure that you consult your legal counsel before leveraging this capability.
Protocol Analysis
Whereas the focal point in packet analysis is the content of the packets under study, protocol analysis deals with the way in which the packets conform to the protocol they are supposed to be implementing. For instance, the Internet Control Message Protocol (ICMP) allows echo request and echo reply packets to have a payload as long as the total packet length is no greater than the network’s maximum transmission unit (MTU). This feature was intended to support diagnostic messages, though in practice this is almost never seen. What we do see, however, are threat actors exploiting this protocol to establish ICMP tunnels in which two hosts create a clandestine communications channel using echo requests and replies. Conducting an analysis of ICMP would reveal these channels.
Another application of protocol analysis is in determining the security or, conversely, vulnerabilities of a given protocol. Suppose you purchase or develop an application for deployment in your organization’s systems. How would you know the risks it would introduce unless you had a clear understanding of exactly how its protocols were expressed on your networks? Performing protocol analyses can be as simple as sniffing network traffic to ensure that all traffic is encrypted, or as complex as mathematical models and simulations to quantify the probabilities of unintended effects.
EXAM TIP For the purposes of the CySA+ exam, you should focus on the sorts of protocol analyses that look at how well packets conform to established protocols.
Malware
One of the most common telltale signs of the presence of malware is anomalous network traffic activity. Security teams routinely monitor for unusual patterns and volumes, in addition to sensitive data leaving the network. While monitoring inbound and outbound activity on your corporate network will enable your team to identify potential attacks in progress, there is another aspect to network monitoring that may prepare the team for an imminent attack. By analyzing network traffic for requests to suspicious domains, security teams may be able to identify behavior associated with the preparation for malware delivery well before malware hits the network. Since modern malware often relies on command and control mechanisms to deliver specific instructions to victim machines, disrupting this communication can vastly improve the team’s chances to avoid infection.
Log Review
Logs can be found everywhere; they are often generated by all manner of hardware and software across the network. The data that populate logs is a rich source of information that may enable us to piece together what may have happened during a security event. Understanding how to interpret this endless stream of information is critical to your determining what may have happened and how to prevent it from occurring in the future. When enabled, logging is frequently captured as a time series, meaning events are written with a timestamp associated with the action. Interpretation of these logs involves gathering, correlating, and analyzing that information in a central location such as a SIEM. Although it’s tempting to believe that machines can do it all, at the end of the day, a security team’s success will be defined by how well its human analysts can piece together the story of an incident. Automated security data analytics may take care of the bulk noise, but the real money is made by the analysts.
Packet Captures
Let’s look back at our previous examples of network scanning to explore how an analyst may quickly piece together what happened during a suspected incident. Figure 11-7 gives a detailed list of specific interactions between two hosts on a network. We can see that, in under a second, the device located at IP address 4.4.4.12 sent numerous probes to two devices on various ports, indicative of a network scan.
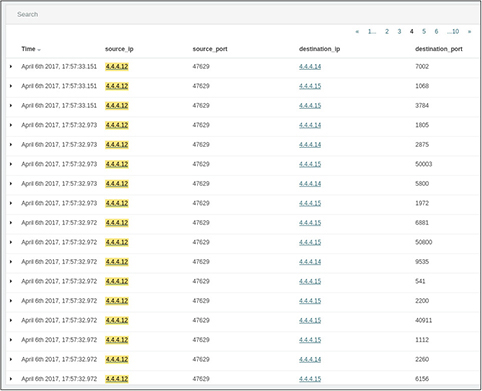
Figure 11-7 SIEM list view of all traffic originating from a single host during a network scan
In addition to source, destination, and port information, each exchange is assigned a unique identifier in this system. After the scan is complete a few minutes later, we can see that the device located at 4.4.4.12 establishes several connections over port 80 to a device with the 4.4.4.15 IP address, as shown in Figure 11-8. It’s probably safe to assume that this is standard HTTP traffic, but it would be great if we were able to take a look. It’s not unheard of for attackers to use well-known ports to hide their traffic.
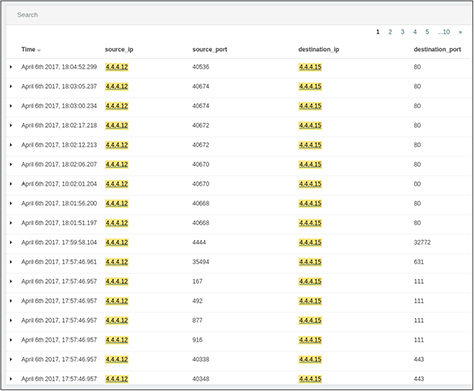
Figure 11-8 Listing of HTTP exchange between 4.4.4.12 and 4.4.4.15 after scan completion
This view enables us to get more information about what happened during that time by linking directly to the packet capture of the exchange. The capture of the first exchange in that series shows a successful request of an HTML page. As we review the details in Figure 11-9, this appears to be the login page for an administrative portal.

Figure 11-9 Packet capture details of first HTTP exchange between 4.4.4.12 and 4.4.4.15
Looking at the very next capture in Figure 11-10, we see evidence of a login bypass using SQL injection. The attacker entered Administrator' or 1=1 # as the username, indicated by the text in the uname field. When a user enters a username and password, a SQL query is created based on the input from the user. In this injection, the username is populated with a string that, when placed in the SQL query, forms an alternate SQL statement that the server will execute. This gets interpreted by the SQL server as follows:

Figure 11-10 Packet capture details of a second HTTP exchange between 4.4.4.12 and 4.4.4.15, showing evidence of a SQL injection
![]()
Because the 1=1 portion will return true, the server doesn’t bother to verify the real password and grants the user access. The note “Welcome to the Basic Administrative Web Console” in Figure 11-10 shows that the attacker has gained access.
Just because the attacker now has access to a protected area of the web server, it doesn’t mean he has full access to the network. Nevertheless, this behavior is clearly malicious, and it’s a lead that we should follow to the end. In the following subsections, we discuss how the approach to manual review we just presented using automation tools and packet captures can be extended to other sources of information.
NOTE Software-defined networking (SDN) addresses several challenges that make correlation difficult. Because the network is centrally controlled to optimize the performance, the SDN provider is also a perfect place to perform data collection. This reduces the need to perform collection, formatting, and normalizing tasks for each device. Rather, these tasks can be performed once across the entire network.
System Logs
Properly configured, end systems can log a much richer set of data than many network devices. This is partly because network traffic can be encrypted or obfuscated, but the actions on the end system are almost always easier to observe. Another reason why event logs matter tremendously is that there are many threat actors who will acquire domain credentials either before or at an early stage of their attack. Once they impersonate a legitimate user account, the data you capture from the network will be much less insightful to your analysis. It is a very common technique to use real credentials (stolen though they may be) to accomplish lateral movement throughout a targeted network.
System logs come in a variety of formats. The two formats with which you should be familiar as a CySA+ certified professional are the Windows Event Logs and the more generalized syslog. Both are intended to standardize the reporting of events that take place on a computing device. Though they are not the only formats in existence, most applications will generate events in the Windows format if they are running on a Microsoft operating system and in syslog format otherwise. Additionally, various products are available that will take input from one or the other (or any other format for that matter) and aggregate it into one event log.
Event Logs
Event logs provide detail about a system and connected components. Administrators can view all of a Windows system’s event logs with the Event Viewer utility. This feature makes it much easier to browse through the thousands of entries related to system activity, as shown in Figure 11-11. It’s an essential tool for understanding the behavior of complex systems like Windows—and particularly important for servers, which aren’t designed to always provide feedback through the user interface.
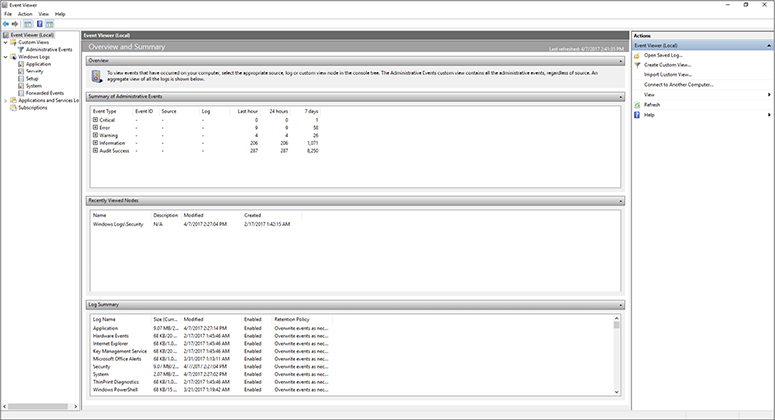
Figure 11-11 The Event Viewer main screen in Windows 10
In recent Windows operating systems, successful login events have an event ID of 4624, whereas login failure events are given an ID of 4625 with error codes to specify the exact reason for the failure. In the Windows 10 Event Viewer, you can specify exactly which types of event you’d like to get more details on using the Filter Current Log option in the side panel. The resulting dialog is shown in Figure 11-12.

Figure 11-12 The Event Viewer prompt for filtering log information
NOTE The default location for the Linux operating system and applications logs is the /var/log directory. In the Windows environment, you can use the Event Viewer to view the event logs. For other network devices, the syslog location may vary.
Syslog
Syslog is a messaging protocol developed at the University of California, Berkeley, to standardize system event reporting. Syslog has become a standard reporting system used by operating systems and includes alerts related to security, applications, and the OS. The local syslog process in UNIX and Linux environments, syslogd, collects messages generated by the device and stores them locally on the file system. This includes embedded systems in routers, switches, and firewalls, which use variants and derivatives of the UNIX system. There is, however, no preinstalled syslog agent in the Windows environment. Syslog is a great way to consolidate logging data from a single machine, but the log files can also be sent to a centralized server for aggregation and analysis. Figure 11-13 shows the structure of a typical syslog hierarchy.

Figure 11-13 Typical hierarchy for syslog messaging
The syslog server will gather syslog data sent over UDP port 514 (or TCP port 514, if message delivery needs to be guaranteed). Analysis of aggregated syslog data is critical for security auditing, because the activities that an attacker will conduct on a system are bound to be reported by the syslog utility. These clues can be used to reconstruct the scene and perform remedial actions on the system. Each syslog message includes a facility code and severity level. The facility code gives information about the originating source of the message, whereas the severity code indicates the level of severity associated with the message. Table 11-1 provides a list of the severity codes as defined by RFC 5424.
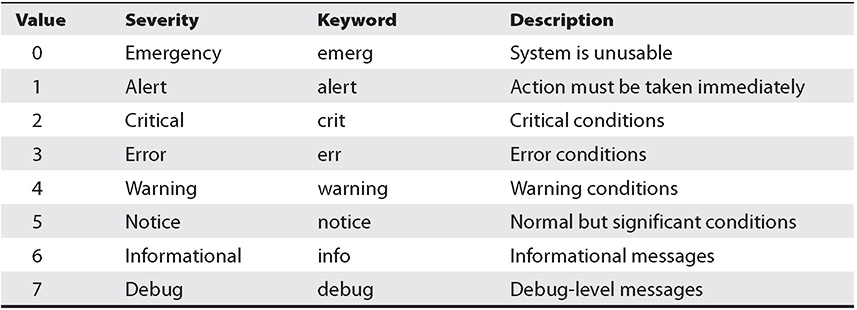
Table 11-1 Syslog Severity Codes, Keywords, and Descriptions
NOTE The syslog protocol for event messaging does not specify how exactly messages should be formatted. As a result, messages from different devices may have slight variations in how they’re presented to the syslog server. The protocol just provides a standardized way to get the message from client to server.
Firewall Logs
It is widely accepted that firewalls alone cannot secure an information system, or even its perimeter. Still, they remain an important part of any security architecture. Fundamentally, a firewall is meant to restrict the flow of data between two or more network interfaces according to some set of rules. This means that it has to examine every packet that arrives at any of the interfaces to ensure compliance with whatever policies are specified in the firewall’s configuration files. Whether the packet is accepted, denied, or dropped, the firewall generates a log entry with details that can help us in preventing or recovering from incidents.
NOTE It is important to pay attention to inbound as well as outbound traffic. Some incidents will be easier to detect in one versus the other.
The amount of information contained in firewall logs is configurable. Some fairly universal parameters logged by most firewalls are described in Table 11-2. By default, most firewalls provide ample logs for any incident response. But it can be frustrating and unhelpful to begin an investigation only to find out that a well-meaning firewall administrator pared down the amount of information that a device would store in its logs. There is no way to recover log data that was never captured.
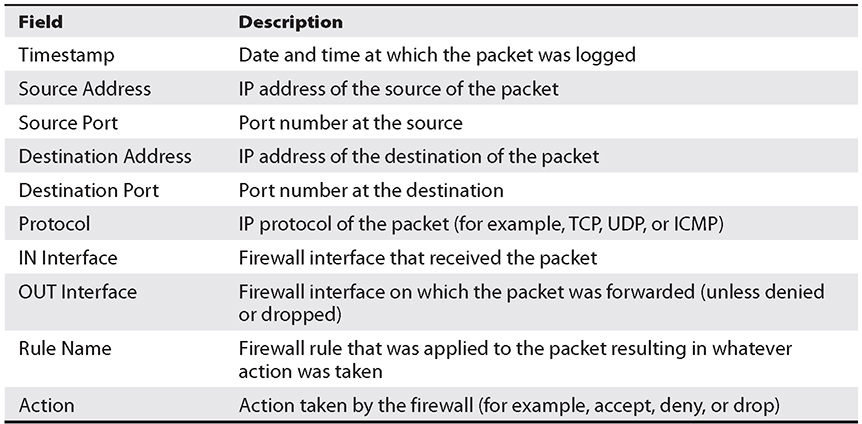
Table 11-2 Typical Firewall Log Fields
Web Application Firewall Logs
Traditional firewalls were not designed to protect web applications and thus do not provide adequate defense against the wide-ranging types of attacks observed against Internet-connected services. Simply blocking traffic based on source and destination port numbers may not be sufficient to protect from attacks such as cross-site scripting (XSS) and SQL injection. Web application firewalls (WAFs) operate at the application layer to monitor and block potentially destructive traffic, usually over HTTP and HTTPS. Though HTTP traffic is stateless, WAFs are typically user, session, and application aware, meaning that they often operate as the first line of defense. Analyzing WAF logs can provide enormous insight into how attackers behave.
Proxy Logs
In comparison to WAFs, which aim to protect applications and the servers they reside on, proxies protect clients. Most often proxies take requests from internal sources, such as those from clients on a local network, and determine how they should be handled based on predetermined rules. The proxy server is in an ideal position to log all web traffic originating from inside the network and can block and filter as necessary. Proxy logs can provide information to identify anomalous browsing behavior such as that associated with C2 connections.
Intrusion Detection/Prevention Systems
A step up from firewall logs in terms of valuable threat data are the logs and alerts of the intrusion detection system (IDS) and the intrusion prevention system (IPS). The difference between the two is that the former simply generates alerts when it detects suspected threats and the latter actively blocks them. What oftentimes makes these systems more helpful in finding threats is that their rule language is typically more powerful than that of a firewall. Whereas a firewall will allow, drop, or alert traffic on a fairly simple set of rules or heuristics, an IDS/IPS can look for very specific signatures or behaviors. Figure 11-14 shows a Snort alert triggered by a port scan originating in a neighboring node.

Figure 11-14 Sample IDS alert
EXAM TIP A next-generation firewall (NGF) incorporates functionality from both traditional firewalls and IPSs. Unless otherwise stated in the exam, assume that an IDS/IPS is not an NGF.
IDSs can be measured along two dimensions: focus and approach. The focus can be on a host, which makes them host-based IDSs (HIDSs); otherwise, they are network-based IDSs (NIDSs). Their approach can be signature or anomaly based. Finally, they can be standalone or integrated into another platform, such as an NGF.
Snort
Snort is probably the best-known NIDS in the open source community. However, it is actually more than a NIDS, because it can operate as a packet analyzer or as a network intrusion prevention system (NIPS). Snort was originally developed by Martin Roesch in the late 1990s and has been under constant development ever since. It is most known for the richness of its rules language and the abundance of rules that exist for it.
Snort rules have two parts: the header and options. The header specifies the action Snort will take (for example, alert or drop) as well as the specific protocol, IP addresses, port numbers, and directionality (directional or bidirectional). The real power of the rules, however, is in the options. In this section of a rule, one can specify where exactly to look for signs of trouble as well as what message to display to the user or record in the logs.
The following rule, for example, shows how to detect a backdoor in the network:
![]()
In this case, we are looking for inbound TCP packets destined for port 7597 containing the text “qazwsx.hsq.” If these are found, Snort will raise an alert that says “MALWARE-BACKDOOR QAZ Worm Client Login access.” Note that many more options could be written into the rule, such as hashes of known malware.
NOTE Threat Intelligence companies will often include Snort signatures for newly discovered threats as part of their subscription services.
Zeek
Zeek, formerly known as Bro, is both signature and anomaly based. Instead of only looking at individual packets and deciding whether or not they match a rule, it creates events that are inherently neither good nor bad; they simply alert you that something happened. An advantage in this approach is that Zeek will track sessions to ensure that they are behaving as you would expect, and it keeps track of their state. All this data is retained, which can help forensic investigations. These events are then compared to policies to see what actions, if any, are warranted, and it is here that Zeek’s power really shines: the policies can do anything from sending an e-mail or a text message, to updating internal metrics, to disabling a user account.
Another powerful feature in Zeek is the ability to extract complete executables from network streams and send them to another system for malware analysis. This download feature is also helpful when you’re performing forensic investigations in which, for example, you need to determine which files may have been exfiltrated by an attacker. Because all the events (which include embedded files) are stored, they are available for future analysis.
Suricata
Suricata can be thought of as a more powerful version of Snort, even though its architecture is quite different. It can use Snort signatures, but it can also do a lot more. Specifically, it is multithreaded (Snort isn’t) and can even take advantage of hardware acceleration (that is, using the graphics accelerator to process packets). Like Zeek, it can also extract files from the packet flows for retention or analysis. Like both Zeek and Snort, Suricata can be used as an IPS.
Authentication Logs
Auditing and analysis of login events is critical for a successful incident investigation. All modern operating systems have a way to log successful and unsuccessful attempts. Figure 11-15 shows the contents of the auth.log file indicating all enabled logging activity on a Linux server. Although it might be tempting to focus on the failed attempts, you should also pay attention to the successful logins, especially in relation to those failed attempts. There’s a reasonable chance that the person logging in from 4.4.4.12 is an administrator who made a mistake the first couple of times. However, when you combine this information with the knowledge that this device has just recently performed a suspicious network scan, the likelihood that this is an innocent mistake goes way down.

Figure 11-15 Snapshot of the auth.log entry in a Linux system
EXAM TIP When dealing with logs, consider the time zone difference for each device. Some may report in the time zone you operate in, some may use GMT, whereas others may be off altogether. This is why using a centralized time source on your network is critical. Be sure to note any time zone differences that may exist when analyzing logs from different sources, as may be the case when answering simulation questions on the exam.
Impact Analysis
A successful attack can affect an organization in many ways. The results of an attack are referred to as impact. Impact will vary depending on the details of the event but can involve many tangible and intangible costs to an organization, its employees, and customers over the short and long terms. We’ll cover a few key concepts of impact analysis that are important to security operations here. To help categorize the types of impact to an organization, we can break them down into phases that align with the response and recovery process. In a triage phase, for example, analysts will work quickly to determine what’s impacted and will then begin to formulate a plan to communicate with stakeholders about what’s occurred. Efforts in this phase are usually focused on stopping an adversary’s ongoing activity and assessing immediate damage. As an analyst, your goals here are often to react to what’s happened, assess the immediate impact, prevent further damage, and take steps that will better inform near-term decisions from leaders.
The localized impact, the immediate effects that the incident has on availability, confidentiality, or integrity of an asset, is often a priority, but there may be broader organizational impacts that are not always apparent. Sometimes the true nature of an impact will not reveal itself until further investigation is performed after the initial discovery of a security event. After initial triage, security teams will move beyond reacting and on to determining the next steps to reduce disruptions to long-term business processes and stakeholder relationships. This phase, characterized by actions taken perhaps weeks and months after then initial event, tends to focus heavily on auditing and determining the total impact to the organization. In some cases, there may be regulatory requirements related to disclosure, or even law enforcement proceedings.
The final phase of impact analysis is all about repairing the damage discovered throughout the previous two phases and installing measures to prevent or reduce the likelihood of a similar event in the future. This could mean pitching the case for investment in a new detection technology or refining security awareness training for employees—both important goals in making the company more resilient as you move forward.
Availability Analysis
Sometimes our focus rests on protecting the confidentiality and integrity of our systems at the expense of preventing threats to their availability. Availability analysis is focused on determining the likelihood that our systems will be available to authorized users in a variety of scenarios. Perhaps the most common of these is the mitigation of DDoS attacks, which is in part accomplished by acquiring the services of an anti-DDoS company such as Akamai. These services can be expensive, so an availability analysis could help make the business case for them by determining at which point the local controls would not be able to keep up with a DDoS attack and how much money the organization would lose per unit of time that it was unavailable to its customers.
Another application of availability analysis is in determining the consequences of the loss of a given asset or set of assets. For example, what would be the effects on the business processes of the loss of a web server, or the data server storing the accounting data, or the CEO’s computer? Obviously, you cannot realistically analyze every asset in your system, but there are key resources whose unavailability could cripple an organization. Performing an availability analysis of those resources can shed light on how to mitigate the risk of their loss.
Resource-Monitoring Tools
There are several tools that will enable you to monitor the performance and uptime of your systems. At a very high level, these tools track the availability of your network devices, including workstations, servers, switches, routers, and indeed anything that can run an agent or send data to a plug-in. For each of those devices, tools can monitor specific metrics such as processor or disk utilization. When things go wrong, the tools will log the event and then either send a notification via e-mail or text or take a specific action by running an event handler that can correct the problem. Many of them are remarkably easy to set up and often scalable enough to handle complex environments and procedures, giving you visibility on anything affecting availability.
Security Information and Event Management Review
SIEM systems are at least as much analytical as they are collective tools. All tools in this category perform four basic functions: collect, store, analyze, and report. Most of the collected information comes from various systems’ logs, which are exported and sent to the SIEM system. The SIEM will then typically normalize the format of the data from these disparate sources so that they can be compared with each other. It then stores everything in a system that is optimized for quick retrieval, which is needed to analyze vast amounts of information. Whether the analysis is the result of a simple user query or the end product of sophisticated processes of correlation, SIEMs also have to produce a variety of reports for different purposes that range from internal lessons learned to regulatory compliance.
Figure 11-16 shows a SIEM dashboard that displays the security events collected over a fixed period of time. This particular SIEM is based on the ELK stack, a popular solution for security analysts who need large-volume data collection, a log parsing engine, and search functions. From the total number of raw logs (more than 3000 in this case), the ELK stack generates a customizable interface with sorted data and provides color-coded charts for each type.

Figure 11-16 SIEM dashboard showing aggregated event data from various network sources
From these charts, you can see the most commonly used protocols and most talkative clients at a glance. Unusual activity is also very easy to identify. Take a look at the “Top Destination Ports” chart shown in Figure 11-17. Given a timeframe of only a few minutes, is there any good reason why one client attempts to contact another over so many ports? Without diving deeply into the raw data, you can see that there is almost certainly scanning activity occurring here.
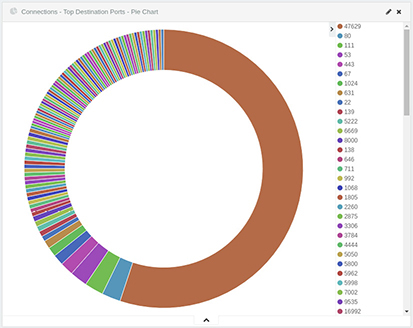
Figure 11-17 SIEM dashboard chart showing all destination ports for the traffic data collected
Many SIEM solutions offer the ability to craft correlation rules to derive more meaningful information from observed patterns across different sources. For example, if you observe traffic to UDP or TCP port 53 that is not directed to an approved DNS server, this could be evidence of a rogue DNS server present in your network. You are taking observations from two or more sources to inform a decision about which activities to investigate further. If these activities are connected to known-bad IP addresses, for example, you will have more confidence in making a determination about blocking or redirecting that traffic.
Query Writing
The ability to search data is a core function of any data aggregation platform. Although the syntax for querying may be specific to a platform, it is often easy for you to understand and migrate from one to the other. After all, the whole point of collecting and normalizing this data is to be able to derive meaning from it at a later point through manual or automated retrieval. The platform’s features and functions are often heavily driven from searches. Search languages such as Splunk Search Processing Language (SPL), Kibana Query Language (KQL), and Apache Lucene are similar in that they all use a high structure and scalable approach, much like the commonly used SQL. Each of these languages enables analysts to perform simple string searches or queries for terms of interest, to more advanced search techniques using Boolean logic.
Depending on the platform used, you may be able to search and then perform automated actions such as alert delivery via scripting. The most commonly supported types include shell, batch, Perl, and Python scripts. Among your most important considerations when creating automation scripts are using the appropriate working directories, configuring the environment correctly, and ensuring that arguments are passed correctly. Splunk provides representational state transfer (REST) endpoints that enable analysts to initiate searches and retrieve results automatically. Splunk also provides supporting for advanced Python scripting via the open source Enterprise SDK for Python. Using the SDK, an analyst could programmatically interact with the Splunk engine using the provided wrapper functionality to leverage the Splunk REST API.
It may also be possible to script at the system level and interact directly with platforms via their APIs, cURL, or other mechanisms. The only limiting factor in this case would be the permissions granted to the account attempting to perform the actions. ELK, for example, enables queries to be performed easily via a built-in console or via cURL. A basic search can be performed on a specific index using this format:
GET /index_name/_search?q=field:search_term
The results of this search using the console is shown in the Figure 11-18. Notice that the output is displayed alongside the search box for ease of testing and troubleshooting.

Figure 11-18 Basic search performed from the built-in Elasticsearch console
Passing data using built-system functionalities such as piping and redirection can be used to test functionality quickly or for low-volume processing. Piping is a useful function in that it enables the standard output (stdout) of a command to be connected to standard in (stdin) of another command. The following example shows how we can perform the same operation we performed from the Elasticsearch console via the command line. We can then pipe the output of the cURL operation directly to the json_pp utility, which is used to “pretty-print” various formats, adding stylistic and spacing changes to make the output easier to read by an analyst.
![]()
Figure 11-19 shows an excerpt of the same search we performed in the Elasticsearch console, but using cURL here instead. Note the neat structure of the response. The key/value pairs of the JSON can be easily identified for follow-on processing.

Figure 11-19 Basic search performed via cURL in the command line
E-mail Analysis
Depending on the size of your organization, you may see thousands or even millions of e-mails traverse your networks. Within that massive set of traffic are malicious messages that threat actors use to target employees of your organization. Hoping to gain access to internal systems or sensitive personal and financial information, these threat actors craft their messages to be as realistic as possible. Phishing remains a top attack vector for threat actors of all sophistication levels. Furthermore, many modern phishing e-mails are made using techniques that make the messages indistinguishable from legitimate e-mail. A scalable and automated e-mail analysis process, therefore, is required to provide the most protection against increasingly convincing phishing attempts.
Malicious Payload
Using a technique as old as e-mail itself, attackers can attach malicious files to e-mail, hoping they are downloaded and executed on a host machine. Modern e-mail systems automatically scan e-mail content and block a significant number of malicious messages, especially those that are obviously so. However, attackers will often conceal malware inside other types of commonly e-mailed files, such as word processing documents, compressed ZIP files, media files, and Adobe PDF documents. In some cases, these exploits take advantage of software vulnerabilities to enable the malicious content to surface on the host machine. Flaws in PDF readers, for example, have been exploited to enable the execution of malicious code without the user’s knowledge.
Attackers may also use social engineering to trick users into enabling functionality that would be harmful to their systems. These attackers embed a malicious script or macro into a legitimate looking document and try to trick the user into enabling functionality to get their malware in the door. In other cases, the document itself may contain URLs to malicious websites, which might bring up a fake prompt for password “verification.” In the latter example, there would be no indication from the attachment that anything unusual was happening, since there may not be malicious content in the document itself.
DomainKeys Identified Mail
The DomainKeys Identified Mail (DKIM) standard was introduced as a way for e-mail senders to provide a method for recipients to verify messages. It specifically offers three services: identity verification, identification of an identity as known or unknown, and determination of an identity as trusted or untrusted. DKIM uses a pair of keys, one private and one public, to verify messages. The organization’s public key is published to DNS records, which will later be queried for and used by recipients. When sending a message using DKIM, the sender includes a special signature header in all outgoing messages. The DKIM header will include a hash of the e-mail header, a hash of some portion of the body, and information about the function used to compute the hash, as shown here:
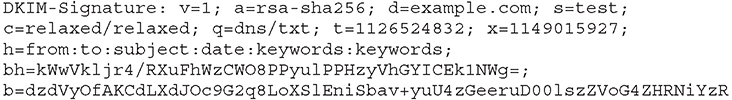
Upon receiving a message, the destination server will look up the previously published public key and use this key to verify the message. With this process, DKIM can effectively protect against spam and spoofing, and it can also alert recipients to the possibility of message tampering. Importantly, DKIM is not intended to give insight into the intent of the sender, protect against tampering after verification, or prescribe any actions for the recipient to take in the event in a verification failure.
Sender Policy Framework
The Simple Mail Transfer Protocol (SMTP) enables users to send e-mails to recipients and explicitly specify the source without any built-in checks. This means that anyone can send a message claiming to be from anyone. This default lack of verification has enabled spammers to send messages claiming to be from legitimate sources for decades. The Sender Policy Framework (SPF) enables domain owners to prevent such e-mail spoofing using their domains by leveraging DNS functionality. An SPF TXT record lists the authorized mail servers associated with a domain. Before a message is fully received by a recipient server, that server will verify the sender’s SPF information in DNS records. Once this is verified, the entirety of the message can be downloaded. If a message is sent from a server that’s not in that TXT record, the recipient’s server can categorize that e-mail as suspicious and mark it for further analysis. SPF TXT information can be manually queried for, as shown in Figure 11-20, which shows the Google public DNS server, 8.8.8.8, reporting several TXT records for the domain comptia.org, including SPF information.

Figure 11-20 TXT records from DNS lookup of comptia.org highlighting SPF entry
Domain-Based Message Authentication, Reporting, and Conformance
Domain-based Message Authentication, Reporting, and Conformance (DMARC) is an e-mail authentication protocol designed to give e-mail domain owners the ability to prevent spoofing and reduce spam that appears to originate from their domain. Like SPF, an entry is created in the domain owner’s DNS record. DMARC can be used to tell receiving servers how to handle messages that appear to be spoofed using a legitimate domain. DMARC uses SPF and DKIM to verify that messages are authentic, so it’s important that both SPF and DKIM are correctly configured for the DMARC policy to work properly. Once the DMARC DNS entry is published, any e-mail server receiving a message that appears to be from the domain can check against DNS records, authenticated via SPF or DKIM. The results are passed to the DMARC module along with message author’s domain. Messages that fail SPF, DKIM, or domain tests may invoke the organization’s DMARC policy. DMARC also makes it possible to record the results of these checks into a daily report, which can be sent to domain owners, usually on a daily basis. This allows for DMARC policies to be improved or other changes in infrastructure to be made. As with SPF, DMARC TXT information can be manually queried for using any number of DNS utilities. Figure 11-21 shows the DMARC entry from a DNS lookup.
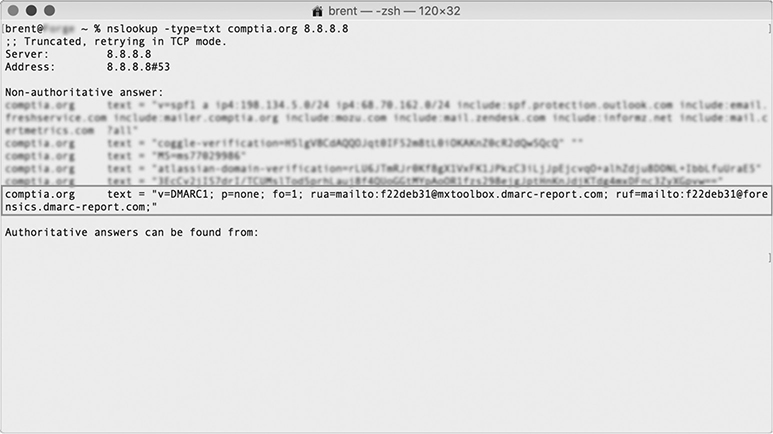
Figure 11-21 TXT records from DNS lookup of comptia.org highlighting DMARC entry
Header
An e-mail header is the portion of a message that contains details about the sender, the route taken, and the recipient. Analysts can use this information to detect spoofed or suspicious e-mails that have made it past filters. These headers are usually hidden from view, but mail clients or web services will allow the message header to be viewed with no more than a few clicks. Figure 11-22 is an excerpt of an e-mail header, featuring several details about the message’s journey from sender to recipient inbox. Note the SPF and DKIM verdicts are captured in the header information along with various server addresses.

Figure 11-22 Sample e-mail header
Phishing
Many attackers know that the best route into a network is through a careless or untrained employee. In a social engineering campaign, an attacker uses deception, often influenced by the profile they’ve built about the target, to manipulate the target into performing an act that may not be in their best interest. These attacks come in many forms—from advanced phishing e-mails that seem to originate from a legitimate source, to phone calls requesting personal information. Phishing attacks continue to be a challenge for network defenders because they are becoming increasingly convincing, fooling recipients into divulging sensitive information with regularity. Despite the most advanced technical countermeasures, the human element remains the most vulnerable part of the network. Handling phishing is no trivial task. Attacker techniques are evolving, and although several best practices have been established for basic protection, the very nature of e-mail is such that there aren’t always visible indicators that you can use to ensure that a message is genuine, especially at scale.
Forwarding
Some larger organizations have dedicated inboxes to review suspicious e-mails that have somehow passed through e-mail filters. Encouraging users who’ve received these kinds of messages to forward them to a special inbox may help analysts determine what changes need to be made to e-mail rules to prevent these e-mails from getting through in the future. It’s also useful to analyze reports in aggregate to assist in identifying large-scale or targeted attacks. This technique is useful not only in helping security teams identify false negatives, or bad e-mails that have marked as good, but false positives as well. It can just be frustrating to have legitimate e-mails continuously sent to a junk folder.

TIP Users provide the most useful information to a security team by forwarding an e-mail in its entirety, with headers and body intact, rather than just copying and pasting the text within it the e-mail. It’s also often possible for users to attach multiple e-mails in a forwarded message.
Digital Signatures and Encryption
A digital signature provides sender verification, message integrity, and nonrepudiation, or the assurance that a sender cannot deny having sent a message. This kind of signature requires the presence of public and private cryptographic keys: When crafting a message, the sender signs the message locally with the sender’s private key. Upon receipt, the recipient verifies it on his device by using the sender’s public key. Digital messages are used today in a similar way that sealing wax was used centuries ago to seal documents. Wax sealant was used to verify that documents were unopened, and when sealed with a custom signet ring, the sealant could also be used to verify the sender’s identity. Because these rings were difficult to replicate, recipients could have reasonable certainty that the message was legitimate if they recognized the seal.
Secure/Multipurpose Internet Mail Extensions (S/MIME) and Pretty Good Privacy (PGP) are the most common protocols used on the Internet for authentication and privacy when sending e-mails. PGP offers cryptographic privacy and authentication for many kinds of transmissions, but it is widely used for signing, encrypting, and decrypting electronic data to protect e-mail content. S/MIME is included in many browsers and e-mail clients and also supports encryption, key exchanges, and message signing. S/MIME and PGP can both provide authentication, message integrity, and nonrepudiation. In practice, S/MIME is often used in commercial setting, while PGP tends to be used by individuals.

CAUTION It’s critical for your users to understand that a digital signature is not the same as the signature block routinely used in outgoing messages. Signature block content is simply additional text that is automatically or manually inserted with messages to enable users to share contact information. It offers no security advantage, whereas a digital signature provides verification of the sender’s authenticity and message integrity.
Embedded Links
Some security devices perform real-time analysis of inbound messages for the presence of URLs and domains and modify the messages so that links are either disabled or redirected to a valid domain. Some Software as a Service (SaaS) e-mail platforms, such as Microsoft Office 365 and Google Gmail, offer functionality to identify links behind standard and short URLs, scan linked images for malicious content, and intercept user clicks to untrusted domains.
Impersonation
It might be easy to think that almost every phishing e-mail contains malicious URLs, a malware attachment, or some other malicious technical content. This is not always the case, however, as we look at how effective impersonation attacks have been over the past few years. Impersonation attacks are highly targeted efforts designed to trick victims into performing actions such as wiring money to attacker accounts. Often these victims are directly connected to key decision-makers, such as members of a finance team and executive assistants. By pretending to be a CEO, for example, an attacker may use tailored language to convince her targets to perform the requested task without thinking twice. Detecting and blocking these types of attacks cannot be done with technical tools alone. Key staff must be aware of current attacker trends and take the required training to resist them.
Chapter Review
Acquiring data through continuous network monitoring is only the beginning. The real work is in analyzing that data and turning it into information. In this chapter, we covered a multitude of approaches and tools that you can use to perform basic security operations and monitoring, along with some security analytics. There is no one-size-fits-all answer for any of this, so it is critical that, as cybersecurity analysts, we have enough familiarity with our options to choose the right one for a particular job. The topics brought up in this chapter are by no means exhaustive, but they should serve you well for the CySA+ exam and, perhaps more importantly, as a starting point for further lifelong exploration.
Questions
1. What method describes efforts to identify malicious activity by looking for suspicious characteristics that can be found in unknown software, for which signatures may not be available?
A. Predictive analysis
B. Trend analysis
C. Point-in-time analysis
D. Heuristic analysis
2. What class of technique includes a means for attackers to rapidly generate domain names using seemingly random ways to circumvent blacklisting?
A. Domain Name System analysis
B. Domain generation algorithm
C. Web application firewall
D. Pseudorandom number generator
3. Your team is looking to aggregate logs from network devices, security appliances, and endpoints across your network so that they can be quickly queried and viewed in a visual manner. What is the most appropriate tool for this task?
A. Event Viewer
B. SIEM
C. Activity Monitor
D. IDS
4. Which of the following provides aggregate statistics for network traffic, suitable for forensic investigations?
A. NetFlow
B. Syslog
C. UEBA
D. Logstash
Use the following scenario to answer Questions 5–8:
A colleague from your organization’s finance team reaches out by phone to get your advice on a suspicious e-mail he just received. The e-mail is marked as urgent and appears to be sent from the company’s chief financial officer herself. In the body of the message are instructions to wire $10 million to an account the analyst has never seen before. Both the CEO and CFO are currently traveling internationally and they are unavailable. Your colleague is worried that his inaction may delay an important project from moving forward, as is stressed in the e-mail, but given the sum of the request, he is concerned about the possibility of the message being a scam.
5. You want to collect details about the message to include any information about e-mail servers involved in its delivery. What must you ask your colleague to include when forwarding the e-mail to you?
A. Syslogs
B. Payload
C. DNS forwarders
D. Header
6. Although the e-mail address used appears to belong to the company’s CFO, the mail server used to send the message is not associated with your organization. What technology would you recommend being put in place moving forward to prevent occurrences like this?
A. DKIM
B. IDS
C. SPF
D. WAF
7. In addition to the previous improvement, you want to leverage the organization’s public keys to ensure that e-mails bearing the company domain are indeed sent and authorized by the organization. What technology would best fit this requirement?
A. SPF
B. SIEM
C. DKIM
D. DMARC
8. A week later, you read an industry report that outlines a surging trend in e-mail messages similar to the one received by your colleague. What is this type of attack most commonly referred to as?
A. Impersonation
B. Malicious payload
C. Embedded links
D. Trojan
Answers
1. D. Heuristic analysis is a method of detecting malicious activity by observing software’s behavior and is often done with the assistance of virtualization and decomposition technologies.
2. B. Domain generation algorithms (DGAs) are sets of instructions designed to generate domain names in rapid, seemingly random fashion to ensure that command and control instructions can be exchanged as defenders block and take down malicious domains.
3. B. Security information and event management (SIEM) systems provide a way to aggregate endpoint, network, and system log data while also offering tools for analytics and visualization.
4. A. NetFlow is a network protocol developed by Cisco for monitoring network traffic and collecting information such as source and destination IP address, IP protocol, and source and destination ports.
5. D. The header is a portion of the e-mail message that contains information about the sender, recipient, route, and authentication details.
6. C. The Sender Policy Framework (SPF) enables domain owners to prevent e-mail spoofing by specifying the authorized mail servers in its DNS records.
7. C. The DomainKeys Identified Mail (DKIM) standard was introduced as a way for e-mail senders to provide a method for recipients to verify messages using a pair of private and public keys to sign and verify messages.
8. A. Impersonation attacks are highly targeted efforts designed to trick victims into performing actions such as wiring money to attacker accounts.