APPENDIX 1
![]()
Vineyards and Wineries
THE INFORMATION concerning vineyards and wineries is poor for most countries, and accurate figures become available only late in the twentieth century. One major problem is that very small holdings were common, and whether these figures are included or not significantly changes the overall picture of landownership. For example, for the Aude department in the Midi in 1913, 42 percent of growers had less than 1 hectare, but these represented only 6 percent of the total area and 5 percent of wine production. The average area was just 3.6 hectares and 197 hectoliters. However, this was not a region of small property as over two-thirds of the vines and 70 percent of output was found on holdings of over 5 hectares (and with almost three-tenths of total output produced on vineyards of more than 30 hectares). Unfortunately the statistics do not allow a distinction to be made between part-time and full-time producers.
Table A.1 summarizes the information for France using the 1924 figures for vineyards and the harvest declared in 1934. The large numbers of smallholders is apparent, but so too the larger holdings found in the Midi. In this region 27.5 percent of the vines were on holdings of 20 hectares or more, compared with just 4.6 percent in the rest of France, and 32.3 percent of production was from farmers that produced in excess of a thousand hectoliters, against 6.8 percent in other regions. In total there were thirty-two wineries that produced more than 10,000 hectoliters in the Midi (and just thirteen more in the rest of the country).
Table A.2 gives the area of vines by county in California in 1891. These figures appear to ignore many of the minuscule plots and are frequently rounded to the nearest acre.
Finally, table A.3 has been calculated using Gervais’s large directory of southern France and Algeria. The figures appear to be winery capacity rather than the production figures of a particular year as in table A.1, which explains the considerably greater number of large wineries in 1903. Comparisons can be made with South Australia (table 10.2) and Argentina (table 11.4).
TABLE A.1
Area of Vines and Output per Winery in France, 1924 and 1934
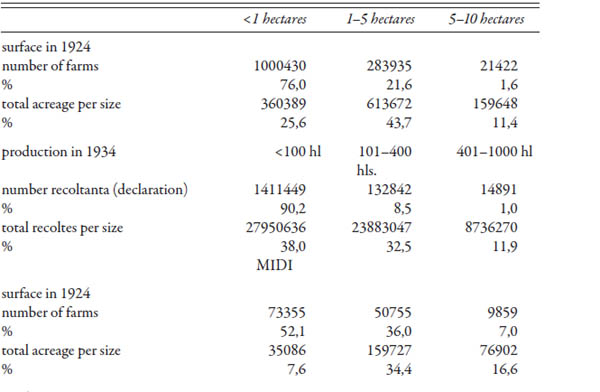
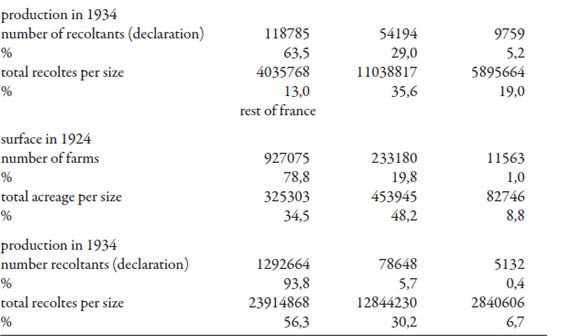
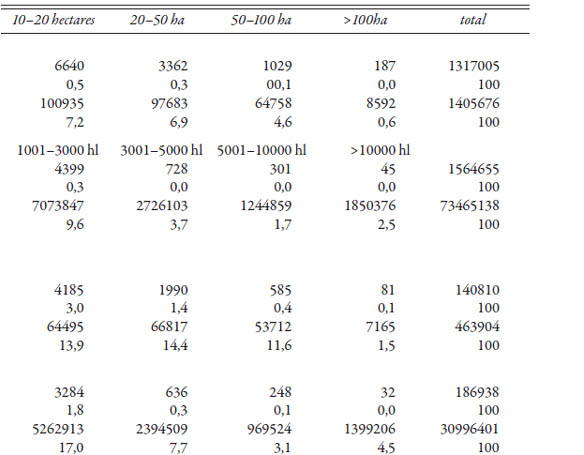
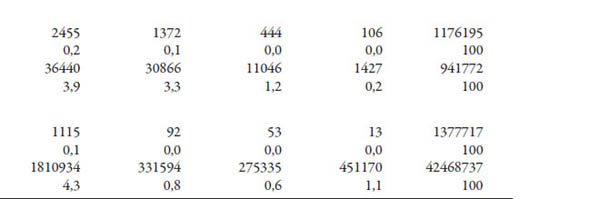
TABLE A.2
Number of Growers and Area of Vines by County in California, 1891
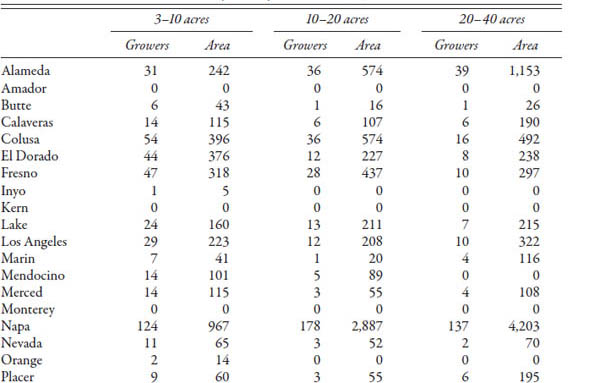
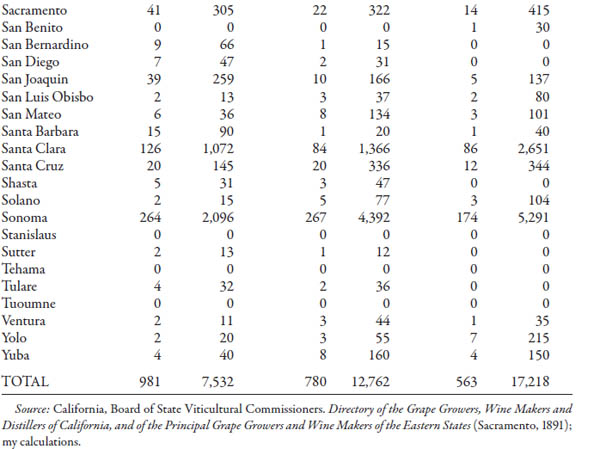
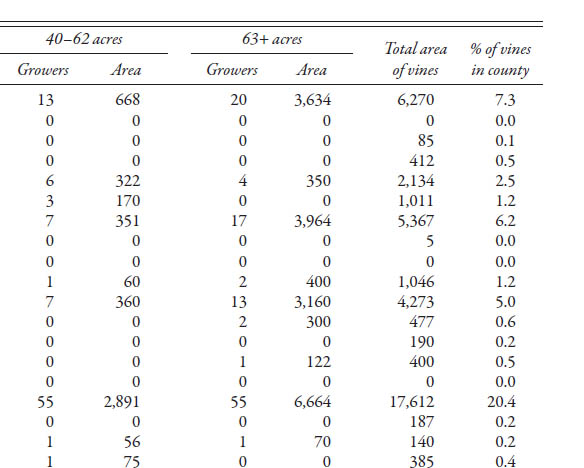
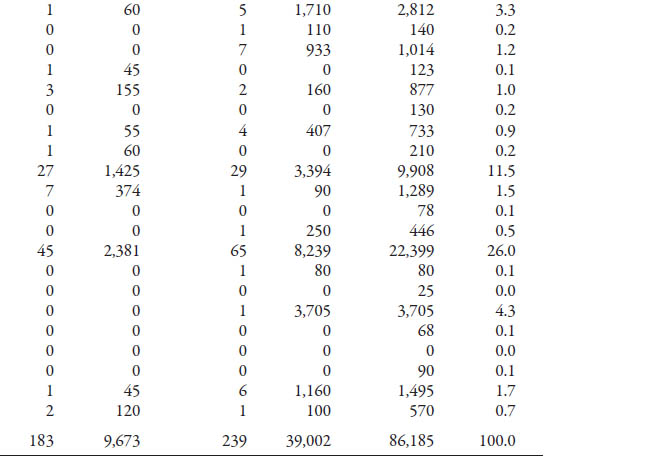
TABLE A.3
Winery Size in the Midi and Algeria, 1903