
3.3. Review: The Piccadilly Organization
Sample Model of Piccadilly
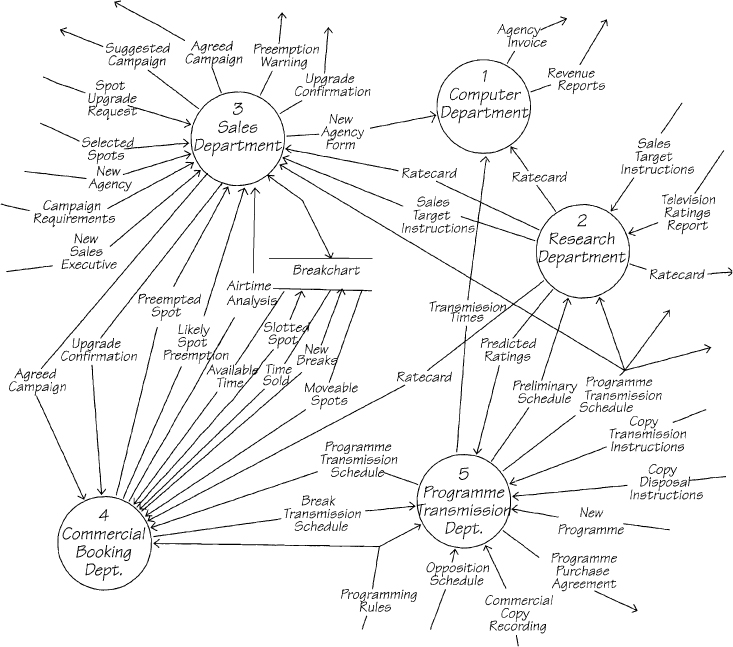
The partitioning of this current physical model mirrors the business that you see when you visit Piccadilly’s offices. The model is useful to you at the moment, as you do not yet have a complete understanding of the television business. The model also highlights some problems. The largest number of interfaces is between the Sales and Commercial Booking departments. This heavy traffic indicates that the work done by these two departments is closely connected. Perhaps there is some functionality being handled in the wrong department, or perhaps there is some overlapping or duplicate processing. It is too early yet to know. These data flows simply tell you that you must analyze both departments before you can see the complete picture.
High-level current physical models such as this one can be used to explain your project to other people. In the real Piccadilly Project, we pinned this model to a prominent wall and used it whenever we discussed the Project with the users or with others on the analysis team. We also found it an extremely good starting point for introducing new people into the Project.
Verifying Your Context
The model you have just built, Diagram 0, is a more detailed version of the context diagram. The functionality of the system is now decomposed into five lower-level bubbles. These five bubbles must interface with each other, which means you must introduce new data flows into the model. Note that the boundary data flows from the context diagram must also appear in the lower-level diagram.
Compare the data flows in your context diagram with the flows that enter or leave your Diagram 0. They should match, with the exception of any new flows that were discovered through the lower-level description. The flows NEW AGENCY, NEW SALES EXECUTIVE, OPPOSITION SCHEDULE, and COPY DISPOSAL INSTRUCTIONS do not appear in the context diagram (Figure 3.1.1). The business description mentions OTHER TV CHANNELS and PERSONNEL DEPARTMENT. Since you have no way of changing other television companies, they are outside your context; show them as a terminator. In a real-world project, you’d have to get a ruling from user management whether the Personnel Department is inside or outside the context before attempting to correct your models. In this Project, let’s say that Piccadilly management has decided that the Personnel Department is outside the context. So we’ll correct the context by adding PERSONNEL DEPARTMENT as a terminator, along with the other new terminator and the new flows. The updated context diagram appears in Figure 3.3.2.

Figure 3.3.2: Updated context diagram. The data flows NEW AGENCY, NEW SALES EXECUTIVE, OPPOSITION SCHEDULE, and COPY DISPOSAL INSTRUCTIONS, plus the terminators PERSONNEL DEPARTMENT and OTHER TV CHANNELS are added to the context diagram to make it balance with Diagram 0.
As you learn about the details of a system, you will usually find that some information has been omitted from the higher-level models. That’s because people forget to tell you something, or they assume that you already know something, or, as happens occasionally, they just don’t know enough to give you the complete picture. People also tend to contradict one another.
These inconsistencies are irritating, but not debilitating. The reason that you are modeling the system is to come up with a precise definition, and it’s far easier and cheaper to find the inconsistencies during analysis than at some later stage.
Adding to Your Data Model
From the business description, you know that Perry Vale in the Programme Transmission Department needs to record the opposition’s programme schedules. He does this so that he can schedule high-rating programmes whenever the opposition is planning a blockbuster. He cannot afford to let Piccadilly give away too big a share of the audience.
Therefore, the system has to remember the opposition’s programming schedules, which means that the data model also changes. Figure 3.3.3 is an updated version of the first-cut data model we showed you in Figure 3.2.8.
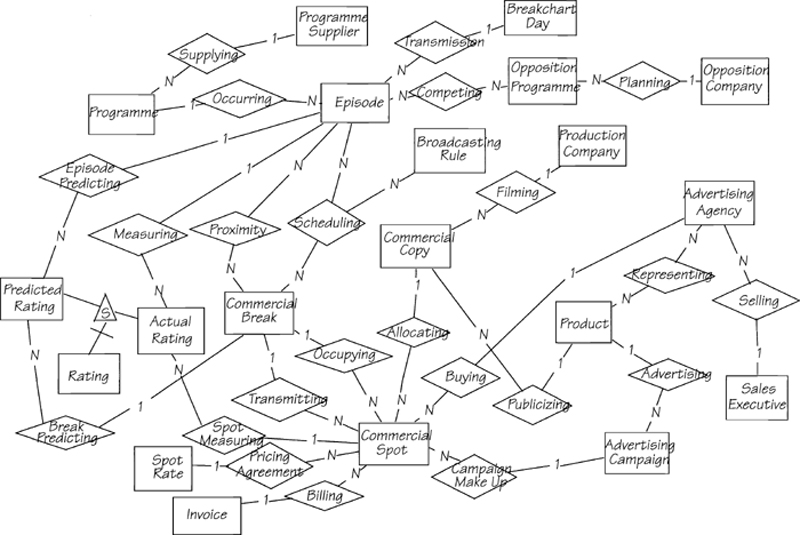
Figure 3.3.3: The first-cut data model is updated to reflect the additional information about the opposition companies and their programming. There are two new entities: OPPOSITION COMPANY and OPPOSITION PROGRAMME. A new relationship keeps track of which company is PLANNING to schedule which opposition programme. Another new relationship keeps track of all the opposition programmes that are COMPETING with a Piccadilly programme.
Some Analysts’ Questions
Suppose I didn’t have a written description of Piccadilly. How would I model the organization?
There are other possible sources of information. As the users describe their work and workplace to you in person, draw data flow diagrams as they talk. They can help if you get stuck. Another source of information is reports and documents used within the company. Start by drawing a bubble for each department in the organization chart, and then treat each report or document as a data flow. Some of these will flow between departments, and some will be boundary data flows to or from terminators. Then, complete the model by asking the users, and looking for data flows that travel by telephone or voice.
Will the Piccadilly users think my model is too complicated?
The users won’t find this picture nearly as complicated as you do. After all, it is a model of something they know very well: their own organization. The data flow names are terms they use every day. You can enhance the model by noting in each bubble the name of the manager or the key people in each department. Your objective is not to deny the complexity, but to control it.
One simplification that we have chosen to use in this model is the single unnamed data flow between the Sales Department and the breakchart. As we are not yet certain of the exact data content in this case, we use this flow as a summary of all the flows. Later, when we study the Sales Department in detail, we will identify the individual flows in the lower-level model. We were much more certain about the communication between the Commercial Booking Department and the breakchart. In this case, we felt confident enough to show separately named flows in the model, and these will be confirmed by our detailed study of the department.
When reviewing your models with the users, don’t try to explain what the symbols mean; they’ll either pick up the meaning from the context or ignore it. Instead, talk about the business you are modeling. Use your models to focus on the topics and areas you need clarified. When you point to a data flow, don’t call it a data flow, call it by its business name. Talk through the model and make it come alive.
For instance, if you were talking to Dagenham Heathway in the Research Department, you could point to the data flow SALES TARGET INSTRUCTIONS and say, “When you get the sales target instructions from management, you use the programme transmission schedule and the television ratings report to do some financial modeling and to set the ratecard for the next quarter. Have I understood that correctly? Are there any other data you use that I don’t know about?” Talking through the diagram leads Dagenham to verify your understanding and tell you about anything that is missing. If he corrects your model, thank him. Remember that it is not an interruption to your work if somebody makes changes to your model—it is the purpose of your work.
How long does it take to build a current physical model?
Sometimes, you can sketch a current physical model on a whiteboard in less than half an hour. In other cases, it can take weeks. We have found the time depends on three factors:
• how well you know the people involved
• how much user knowledge you have yourself
• how available are the people you need to see
Remember that the current physical model is not the specification for your future system. This model’s purpose is to give you an understanding of the business. Instead of asking “How long does it take?” perhaps a better question is “How much time should I spend?” The answer is as much time as you need to understand the business, and no more. Later, after discussing event modeling, we can define more precisely how much knowledge you’ll need. Also, as you progress through the Piccadilly Project, you will see the point at which we suggest that you stop physical modeling and move on to another view.
Are there any dangers in building current physical views of a system?
Yes. Many projects have wasted a great deal of time by building overly detailed current physical models. Some projects have built models that specify every detail right down to the mini specifications. That is not the purpose of the current physical model. Shortly before it was canceled, one project we know of had produced three thousand mini specifications detailing the current system. This was tragic, because the analysts could have captured enough knowledge with one or two levels of data flow diagrams, some data dictionary definitions, and no mini specifications.
The reason this happened was that the people building the models were not sure why they were doing it. Without a clear plan of how much physical modeling is needed, analysts find it is all too easy to continue doing it past the point of being useful.
Physical modeling is also fun to do. Most analysts enjoy the experience of talking to users, modeling what they said, verifying the model, and moving down to the next level of detail. There is also the problem that when analysts are talking to the users, they are providing details of their business. Many analysts feel that they have to model all the details so that they don’t lose any of them and have to ask for the information again. However, at this stage of the Piccadilly Project, you don’t know what details are needed, and what will become superseded by the future system. We urge you to procrastinate. You can always postpone details and then go back to pick up the details when you know what you need. It is much more difficult to get rid of lovingly crafted models even after they have proved to be unnecessary.
Your goal is to specify a system, and to do that, you have to know how to selectively build your physical models.
Why do you recommend starting the Piccadilly Project with a current physical view? We recommend this approach because you had no prior knowledge of Piccadilly’s business, and the current physical model helps you to understand its business. This model is a convenient vehicle to collect information about the system.
A current physical model is not wasted effort, and you’ve used it to accomplish two things. First, the model helps to ensure that you are beginning the project with the correct context. Second, it helps you get to know the key users. You’ve demonstrated your interest in what they told you by building a model of it. You’ve discovered most of the data that flows around and is stored by the company. You also know, at a high level, what processes exist to treat those data. While it is early yet, you have already traveled quite a distance.
Once you have built up enough knowledge of Piccadilly’s business, it will be time to move on to other views of the system.
 Ski Patrol
We have mentioned that a possible pitfall with the current physical model is the temptation to show a bubble for each process mentioned in the text, thus resulting in a model with far too many bubbles. If this happened to you, a quick revisit to Chapter 2.7 Leveled Data Flow Diagrams would be useful for you to redo your model.
The data flow names should be substantially the same as those used in the text. You are free to change names, but you should always have a solid reason for doing so. Remember that you have to confirm this diagram with the users before proceeding, so they must be able to recognize the name.
Your diagram should have balanced with the context. If it didn’t, or if you didn’t do the balancing check, or if you didn’t add the new boundary flows to your context diagram, visit Chapter 2.7 Leveled Data Flow Diagrams to read about keeping the leveled models in balance with each other. Balancing is a critical part of your modeling effort.
You also should have discovered the additions to the data model. You should be happy with your data model at this stage as a reflection of your growing knowledge of the business. It does not have to look exactly like ours. In later modeling efforts in the Project, you will refine your model, and at the same time prove or disprove your ideas. However, we want you to feel comfortable with the idea and notation of data models before proceeding. Look in Chapters 2.4 Data Viewpoint and 2.5 Data Models for help on data models.
Trail Guide
![]() Easiest: The next step in the Piccadilly Project is to define the data flows and stores. To find out how to do this, go to Chapter 2.9 Data Dictionary.
Easiest: The next step in the Piccadilly Project is to define the data flows and stores. To find out how to do this, go to Chapter 2.9 Data Dictionary.
![]() More Difficult: If you already know about data dictionaries, proceed to Chapter 1.5 Building the Data Dictionary. If you need to brush up on some rusty skills, may we suggest a quick detour through Chapter 2.9 Data Dictionary.
More Difficult: If you already know about data dictionaries, proceed to Chapter 1.5 Building the Data Dictionary. If you need to brush up on some rusty skills, may we suggest a quick detour through Chapter 2.9 Data Dictionary.
![]() Most Difficult: Put your skill with data dictionaries into practice by going to Chapter 1.5 Building the Data Dictionary.
Most Difficult: Put your skill with data dictionaries into practice by going to Chapter 1.5 Building the Data Dictionary.
![]() Promenade: This chapter is not required reading for you. Turn to Chapter 2.8 Current Physical Viewpoint, where you can pick up your trail.
Promenade: This chapter is not required reading for you. Turn to Chapter 2.8 Current Physical Viewpoint, where you can pick up your trail.