

4.1 The Coordinate System
An antenna array is described to NEC-2 as a series of straight wires whose locations are specified in terms of their end coordinates. To specify the end coordinates, NEC-2 uses the conventional spherical coordinate system commonly used in mathematics, as sketched in Figure 4-1.
Azimuth displacement (Φ) in the X-Y plane is measured from the +X-axis and increases in the counterclockwise direction. The elevation angle (Θ) is measured from the +Z-axis with the zenith being 0°.
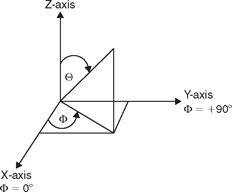
FIGURE 4-1![]()
Conventional spherical coordinate system.
The broadcaster, on the other hand, identifies points in the geographical coordinate system by employing the compass heading and the distance from a given reference point. The compass heading, designated phi (Φ), is measured from true north and increases in the clockwise direction. The broadcaster measures the elevation angle, theta (Θ), referenced to the horizon with the zenith being taken as 90°.
It is plain that the two coordinate systems differ, so those of us who use NEC-2 for broadcast work have to reconcile these differences by defining a coordinate system that is convenient for the broadcaster to use and is also acceptable to NEC-2. Fortunately, that is not a difficult task.
NEC-2 expects to receive XYZ coordinates. The X coordinate and the Z coordinate are specified the same by both NEC-2 and the broadcaster, so no change is required in specifying those two coordinates.
The elevation angles differ only in definition. NEC-2 defines the zenith as 0° and the broadcaster's convention is to define the horizon as 0°. The simplest reconciliation here is for the broadcaster to accept the NEC-2 definition. If a horizontal pattern is desired, just make the NEC-2 calculation at 90° instead of 0°, and so on. That is not difficult and is the convention followed in the remainder of this book.
This leaves only the Y coordinate and the direction of rotation of the angle Φ, to be resolved.
Figure 4-2(a) shows a projection of the X-Y plane used in the NEC-2 coordinate system with the axis rotated to point the +X-axis (Φ = 0°), upward to correspond to the usual north on the compass rose. When this is done, notice that the −Y-axis corresponds to the east direction which, in this coordinate system, corresponds to Φ = 270°, as opposed to the 90° normally shown on the compass rose. This can be corrected simply by reversing the direction of rotation of the angle Φ by reversing the direction of the Yaxis, as shown in Figure 4-2(b).
These changes result in the coordinate system shown in Figure 4-3. It allows the broadcaster to use the familiar spacing/bearing description and at the same time, it provides NEC-2 with an acceptable XYZ Cartesian coordinate system. A tower location having a particular bearing and spacing can be laid out in the coordinate system of Figure 4-3 and the corresponding X-Y coordinates will be compatible with the requirements of NEC-2. The Z coordinates are the same in either system.
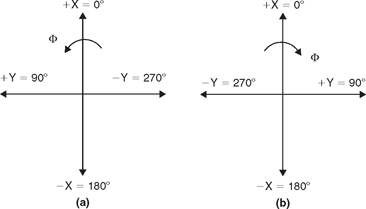
FIGURE 4-2![]()
(a) X-Y projection of spherical coordinates; (b) X-Y projection with Y-axis reversed.
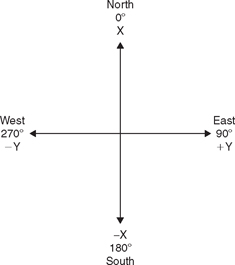
FIGURE 4-3![]()
Coordinate system as used for broadcast applications.
The points to remember about NEC-2's broadcast coordinate system are summarized as follows:
- The horizon is an elevation angle of θ = 90°; the zenith is 0°.
- North corresponds to +X; south corresponds to −X.
- East corresponds to +Y; west corresponds to −Y.
- Height corresponds to +Z; there is no −Z.
Also, keep in mind that the units of length measurement must be meters, not feet and not degrees.
4.2 Array Geometry: An Example
Consider a tower arrangement designed to operate at 1500 kHz and described in Table 4-1. In this example, the spacing and height are given in electrical degrees at the operating frequency and orientation is expressed in degrees of azimuth. Because NEC-2 expects units of length to be expressed in meters, it is necessary to convert the spacing from degrees to meters as follows.
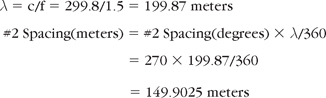
Similarly, #3 spacing is also 149.9025 meters. Also tower 1 height above ground is 49.9675 meters and the height of towers 2 and 3 is 124.9188 meters.
It is now necessary to express each tower location in the X-Y coordinates of Figure 4-3. Notice that Tower 1 has zero spacing at zero angle so it is located at the origin of the coordinate system. The other towers have non-zero coordinates where:
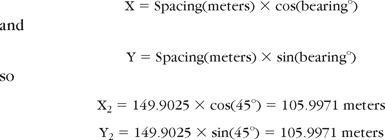
Table 4-1 Three Tower Array Parameters
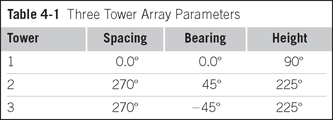
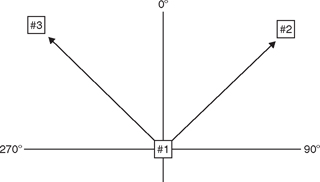
FIGURE 4-4![]()
CALL.NEC tower locations in X-Y plane.
In a like manner, the X-Y coordinates for tower 3 is:
The towers are now located on the ground (in the X-Y plane). They are plotted in the X-Y plane, as shown in Figure 4-4.
The ends of each tower can be expressed in terms of these X and Y coordinates plus the Z coordinate. The bottom ends of the towers are on the ground where Z = 0 meters. The top of tower 1 is (by definition) located at height Z = 49.9675 meters. Therefore, tower 1 is uniquely defined as:
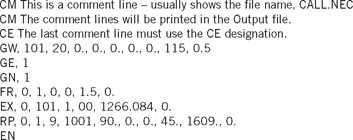
Assuming that this tower has been assigned tag 101, that the tower will be divided into 20 segments, and that it has a radius of 0.1456 meters, this information is entered in the GW command as follows:
There are 20 segments on the wire and segment 1 is at end 1, segment 20 is at end 2. The tops of towers 2 and 3 are both at 124.9188 meters, so for tower 2,
The resulting GW command is
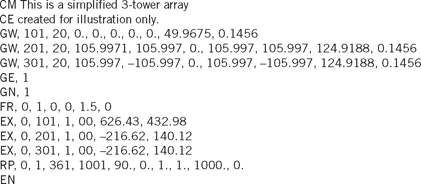
In a like manner, GW commands for tower 3 are written. The complete set of GW commands to describe this array using a one-wire tower model is:
4.3 The Array Input File
It is sometimes easier to modify an existing file than it is to generate a new one because the existing file can be used as a template to remind the user of the need for, and the format of, the various lines of code. The input file shown as Listing 2-1 in Chapter 2 can be used for that purpose in this instance to create an input file for this three-tower array. The input file of Chapter 2 is repeated here as Listing 4.1 for convenience.
To get started, we should first change the comment commands to establish a record of the file.
Next, the existing single GW command is replaced with the three GW commands that describe the towers used in the simplified array.
Finally, replace the voltage drive to the single tower with drive voltages to each of the three towers in the array so as to generate the desired pattern. How these voltages are determined is described in Chapter 6.
There is a drive voltage for each tower. The tag number identifies both the tower and the wire on that tower that receives the drive voltage. Thus tag 101 shows that tower 1 is driven on wire 1 of tower 1. Tag 201 shows that tower 2 is driven on wire 1 of tower 2, and so on.
The digit 1 following the tag indicates the wire segment that receives the drive voltage. Referring back to the GW command, notice that each tower is divided into 20 segments. Thus, the drive voltage is applied to the first of those 20 segments. Remember that segment 1 is next to end 1, which is at ground level as defined by the GW command. This puts the drive voltage at the base of the tower, as is appropriate.
Also, notice that the drive voltage to the tower is a complex number having a magnitude and phase relative to the reference tower. NEC-2 accepts this complex number expressed in terms of its real and imaginary parts, the first entry being the real part and the second being the imaginary part.
Putting these changes together with the unchanged parts of the original input file gives Listing 4-2.
The RP command has been changed to cause a calculation of the far field at every 1° of azimuth (in lieu of 45°) to produce a smoother plot of the horizontal radiation pattern.
The single tower input file of Chapter 2 was modified to create the three-tower input file of Listing 4-2 to emphasize the utility of using a template file. A template file is a pro forma file that can be modified for a particular use. It provides a guide to the types of commands that must be included in the file and it illustrates the format of those commands. Such use saves time by reducing the need to refer to the command descriptions. Therefore, to complete a usable template file from Listing 4-2, we can add some load (LD) commands and we will do this by including loss in the tower model.
The FCC requires that the tower model include a loss of at least 1 ohm at the height of maximum current. We will add 1.5 ohm for good measure. Since the height of tower 1 in the three-tower input file is 90°, maximum current occurs at the base. Therefore, the following command will place 1.5-ohm series resistance in the first segment of tower 1.
Towers 2 and 3 are both taller than 90° so the current maximum occurs above the base. The method used to locate the segment at which the current maximum occurs is explained in Chapter 7. For now it is sufficient to say that the 1.5-ohm resistance will be placed in segment 4 on both towers 2 and 3. The commands placing these loads are:
Please review the description of the LD command as it appears in Appendix. The complete file is shown in Listing 4-3.
Listing 4-3
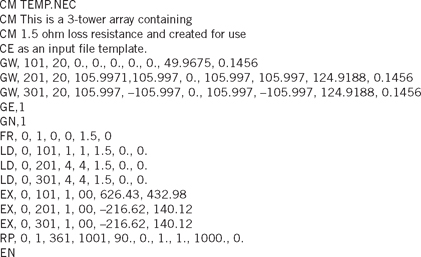
Notice that the comment commands have been changed to properly describe the file and the XQ command has been omitted because the RP command serves to execute the program.
It would be useful to enter the above commands into a file named TEMP.NEC and use it as a template file. Remember that the commands in an input file must begin in column 1 of line 1. Each successive command must also begin in column 1. Do not indent the commands or use spaces at the beginning of the commands and do not use blank lines. Be sure to save the file as a text file.
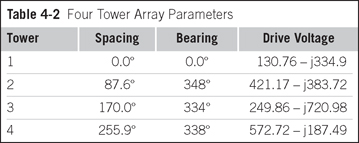
Table 4-2 Four Tower Array Parameters
4.4 Exercises
Conduct a NEC-2 calculation on the four-tower array described in Table 4-2. Make the tower configurations as shown in Chapter 3, Figure 3-1(c), with all tower heights being 121.8786 meters. Drive the first segment of each tower using the drive voltages shown in Table 4-2.
Use 20 segments per tower. The radius of all feed segments is 0.03 meter and the radius of all towers is 0.5 meter. The operating frequency is 550 kHz.
4-1. What is the total power to the array? What is the power assignment to each tower?
4-2. If the antenna monitor sample is taken using a current transformer at the drive point, what will be the antenna monitor indications?
4-3. How many lobes does the horizontal far-field radiation pattern contain?