Chapter 8
HVAC Cooling and Heating Load Analysis
Accurate modeling of a building is essential in designing and sizing an energy-efficient HVAC system for today's market. The majority of time during the mechanical design phase of a project can be spent on correctly modeling the building in a load-simulating program, such as Trane TRACE 700, DOE-2, or Carrier's Hourly Analysis Program (HAP).
Although these programs are essential to you, the mechanical designer, setting up the building accurately for equipment sizing within these programs can often be a tedious task. Each space is set up individually, and typically the physical layout and use of each space will be different. Alterations to the building design or space usage by the architect or building owner during this phase will cause you to return to any previously modeled spaces and coordinate the necessary changes. This is time-consuming and can often be a point of contention between disciplines when changes occur later in the design phase.
Autodesk® Revit® MEP software enables you to model the building spaces accurately as well as quickly and efficiently track any building design and construction changes on the fly, all within the project file. Revit MEP also gives you the option either to model the HVAC loads within the program itself or to export the space load data via a Green Building XML (gbXML) schema file to an external simulation software program. An addition to this workflow is the ability to analyze the mass model.
In this chapter, you will learn to do the following:
- Prepare your Revit MEP model for analysis
- Perform heating and cooling analysis with Revit MEP 2016
- Perform a conceptual energy analysis on your building
- Analyze duct and pipe system pressure with Revit MEP 2016
- Export gbXML data to load-simulating software
Modeling Spaces for Building Load Analysis
The key to any successful building load analysis, as well as energy analysis, lies with accurately modeling the spaces within the building. Components that need to be modeled for each space include, but are not limited to, building construction, such as walls, roofs, and floor slabs; external shading and windows; internal loads, such as the number of people, the activity within the space, the heat gain from lighting, and the equipment operated within the space; and external factors, such as solar heat gain to the space, weather and typical outdoor temperatures, and infiltration. These are but a handful of factors that need to be addressed for each space that is being created. Each of these factors has several significant inputs that can affect the reporting of heating and cooling loads within the space.
Creating Spaces
First things first—spaces need to be created in the project file. Why? It seems redundant to create spaces, seeing as how the architectural model already has rooms created and defined, right?
Not so.
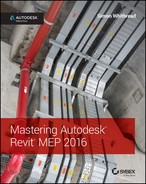
In Revit MEP, spaces are created within room-bounding elements such as walls, floors, ceilings, roofs, and room separation lines that exist in a linked architectural model or from these types of elements within your MEP model. This means that the same elements that define a room in the architectural model define the spaces in your MEP model. Spaces carry the engineering data that is necessary for analysis, whereas rooms contain the information required by the architects. After loading your MEP project and linking in the appropriate architectural model, you want to make sure that the elements that make up a room—walls, doors, ceilings, and so on—will define your MEP space accurately. Figure 8.1 shows a sample building model with rooms.
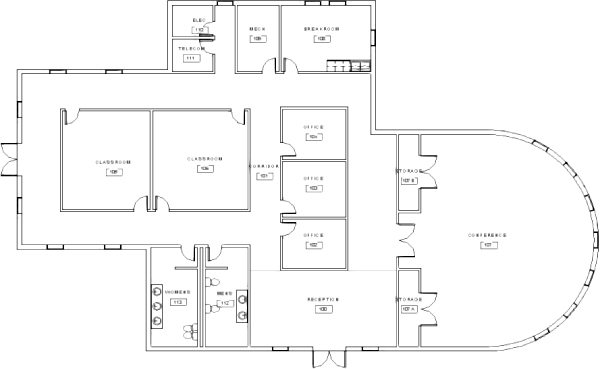
Figure 8.1 Sample building
Selecting the architectural link in your project activates the Edit Type button in the Properties palette. Clicking this button lets you enable the selected link to be room bounding. This option allows the boundaries of the designed rooms, in the link, to define the boundaries of the MEP spaces to be modeled. Figure 8.2 shows the Edit Type button and the Room Bounding type parameter.
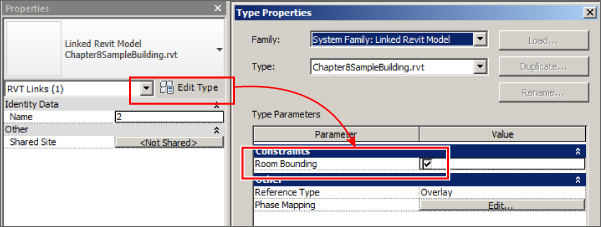
Figure 8.2 Defining boundaries of MEP spaces
When you're placing a space, if the link is not set to Room Bounding, you get a warning that the placed space is not in a properly enclosed region, and subsequently, if HVAC analysis is attempted, Revit will not be able to calculate load data for that space.
Placing Spaces
Revit allows you to create spaces within your model in two ways: by placing spaces manually or by letting Revit locate boundaries and place spaces automatically. If your building has many rooms, allowing the program to place the spaces automatically for you can save time.
When using automatic placement, be sure that all the spaces created are the actual spaces that you intend to model. Check that areas such as utility chases, furrowed columns, and air spaces in wall constructions were not included when spaces were placed. To remove any unwanted spaces from the project file, open the System Browser, which is located on the View tab under User Interface (or you can press F9), and set the view to Zones by choosing Zones from the View drop-down menu at the top of the dialog box.
Select the desired spaces to remove by highlighting the space name, right-clicking, and selecting Delete, as shown in Figure 8.3. Click OK in the pop-up window to remove the spaces and any associated space tags permanently.
Figure 8.3 Deleting unwanted spaces from the project file
If you were just to select a space within an open view and delete it without using the System Browser, the space and its associated tag would be deleted from the model, but the space would still be present in your project and be part of the database. This allows you to place it elsewhere in the model without losing important information you may have already provided. You can also delete a space from a space schedule—it has the same result as deleting from the System Browser. This does have an effect on any building analysis performed as well as any HVAC systems that will be set up in the building. Systems are covered in depth in Chapter 9, “Creating Logical Systems,” and Chapter 10, “Mechanical Systems and Ductwork.”
Creating a Space Properties Schedule
When you're simulating the heating and cooling loads of a building, correctly modeling and accounting for space usage can be time-consuming. Often, design loads have to be revisited because of inaccurate space modeling or design changes, incomplete accounting of space usage, components, or internal loading. Creating a working schedule of the building space properties in Revit MEP will help you account for, and coordinate, these factors.
Typical of all schedules within Revit, a Space schedule provides a choice of several fields to display, to help track and modify data pertaining to each space. A working schedule such as this for space properties is an essential tool that enables you to track how changes in certain properties affect the loads within the spaces. Note that the schedule shown in Figure 8.4 is not intended to be provided to a client on a project sheet but rather to be used as a personal design tool within Revit to help you, the designer, organize the space data to better fit your personal workflow. Create this schedule as you see fit, using the many fields, sorting, and other formatting options available to organize the data you need readily.
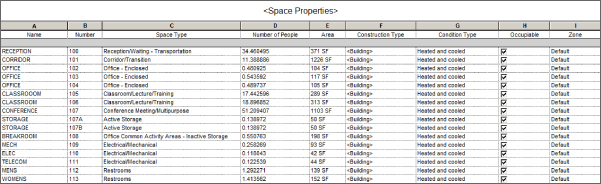
Figure 8.4 Sample Space Properties schedule
In this schedule, you will also see any not placed spaces (which are spaces that exist in the project but not in the model), as well as any redundant and not enclosed spaces. They can also be deleted from the project by deleting them from this schedule. To do this, simply right-click the appropriate row in the schedule and select Delete Row.
During the initial Space Properties schedule creation, you might find the following fields useful:
- Name Designate the space name.
- Number Assign each space a number.
- Space Type Describe how the space will be used.
- Number of People Specify the space occupancy.
- Area List the space area in square feet or meters.
- Construction Type Describe the space's physical construction in this field. We go over the various construction options later in this chapter.
- Condition Type Describe the type of space conditioning (such as Heated And Cooled, Heated, Cooled, or Unconditioned).
- Occupiable This is a Yes/No check box that shows whether this space will be occupied. This is important because you don't want spaces that are not intended to be occupied to be calculated as if they are.
Modifying Space Properties
Notice that the program defaults to a generic space naming and numbering convention when placing spaces. It also sets the Space Type and Construction Type values as <Building>, indicating that the spaces will be modeled generically by relying on default building characteristics that are defined in the Building/Space Type Settings dialog box, shown in Figure 8.5, within the project file.
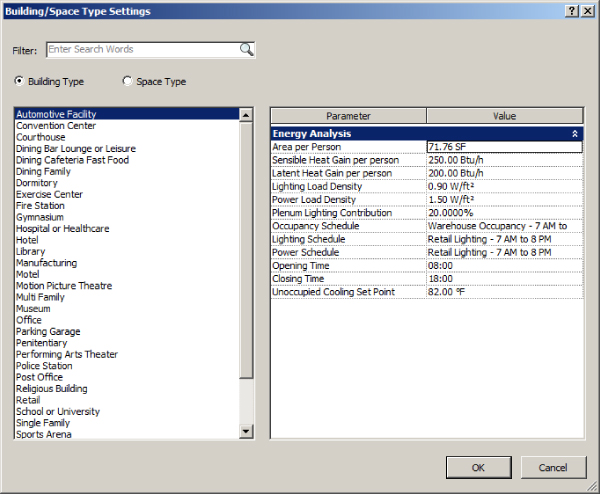
Figure 8.5 Building/Space Type Settings dialog box
How a space will be used is the overall factor driving the internal loads within a space. An enclosed office space is modeled differently from the conference room next door, and an office break room is modeled differently from a typical restaurant dining room. Lighting, population density, activity levels, equipment, and ventilation loads all vary with the space type.
If you open the Manage tab and then choose MEP Settings ⇨ Building/Space Type Settings, you will be able to view and modify the space type options within Revit MEP as well as the global building types (see Figure 8.5).
In the Building/Space Type Settings dialog box, you can choose to define overall building types or individual space usage types. Defining an overall building type can be a good option if you want to do a quick takeoff of a typical building type for the overall model or when performing a preliminary energy analysis, which we touch on later in this chapter. You are given similar parameters to define how you model a building, as well as options to set building operating times (Opening Time and Closing Time) and an Unoccupied Cooling Set Point parameter.
Revit MEP has several predefined options to model how the building, as well as each space, is utilized, and each option has preset parameter and schedule values for the internal loads. Parameters such as Area Per Person, Lighting Load Density, Power Load Density, and Sensible Heat Gain Per Person should all be familiar to you. You can use the preset values within the program, or you can input more accurate design load values based on typical code-driven or industry-standard values.
You can access the Space Type Settings dialog box from the Properties palette when a space is selected in your view. You can also access it from within your Space Properties schedule by locating the cell in the Space Type column (if used in your Space Properties schedule) for the space you would like to modify and then selecting the ellipsis that appears next to the current type name when you click in the field. If you click the People or Electrical Loads button in the Properties palette when a space object is selected, the default values within these windows are the values listed in the Space Type Settings dialog box. Figure 8.6 shows the dialog box for establishing the occupancy and heat gain values, whereas Figure 8.7 shows the schedule settings accessed from the Space Type Settings dialog box.
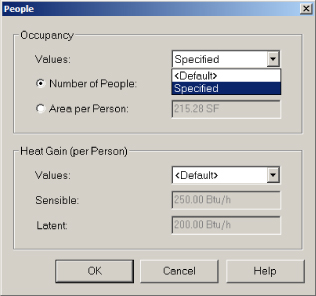
Figure 8.6 Default Occupancy and Heat Gain values
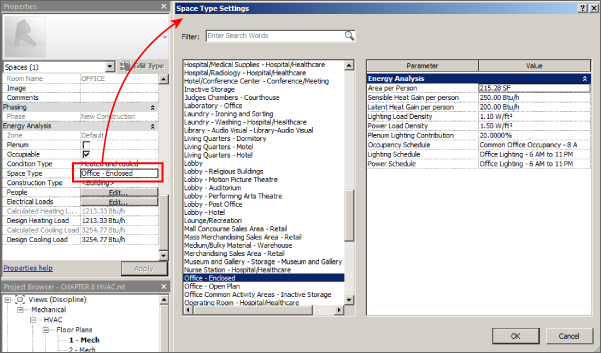
Figure 8.7 Space Type Settings dialog box
Revit MEP also has default Building and Space Properties schedule types that it uses to generate load data. You can modify the default schedules or create new schedules to fit your varying occupancy, power, and lighting needs. You can find the topics Schedules, People Heat Gain, and Building Type Data and Space Type Data in Revit MEP 2016 Help, under Analyze The Design ⇨ Energy Analysis Building & Space Type Imperial Data.
Creating Zones
The next step in generating HVAC loads for your design building is to group similar spaces into zones. The main purpose of zoning spaces in an HVAC system is to provide common controllability of air quality or condition within the zone's spaces. A single point of control by a terminal unit, heat pump, or air-handling unit can set the temperature and air quality of the spaces within its defined zone.
Creating HVAC zones within your building allows you to control the airflow to given spaces, shut off airflow to areas that are not occupied, or increase airflow to spaces when the space load increases via a signal from a temperature sensor or other sensing device within the zone to a central control panel. Zoning also allows certain spaces to be controlled via a different system from that used in the rest of the building, such as having a dedicated server room constant volume system active 24 hours a day, while the rest of the building is controlled by a packaged variable air volume (VAV) rooftop system on a typical office's 8 a.m. to 5 p.m. schedule.
Zoning spaces in Revit MEP is easy. All spaces will be part of a zone called Default, until they are added to a specific one that you create. On the Analyze tab, click Zone. This activates the Zone tool, and you are automatically prompted to add the first space to the zone. Clicking a space adds it to the zone, and then you have the option of adding other spaces to that zone. Click the Finish Editing Zone button on the ribbon to end the editing session.
To edit a zone that has already been created, simply select the required zone in the open view by clicking on the border drawn around the zone, and the Modify | HVAC Zones contextual tab appears. Click the Edit Zone button, and the Edit Zone contextual tab appears. Here, you are able to modify the zone by adding or removing spaces. You can also select a zone by moving your cursor over the center of it until the zone highlights for preselection. This is indicated by a line that appears from the center of each space to the center of the zone.
A second way to create a zone is to select all the spaces you want to be in a zone, and then select the Zone tool on the Analyze tab. Creating a zone this way automatically groups the selected spaces without having to select each space individually with the tool active.
When selecting a zone displayed in an open view, the zone data appears in the Properties palette. From there, you are able to view the calculated heating and cooling loads and zone airflow (after heating and cooling analysis has been run), the physical data of the zone (area, volume, and perimeter), and its characteristic data, which include the following:
- Service Type This drop-down allows you to select the type of system that will be serving the spaces within the zone. Revit MEP offers a variety of service type options based on four main groups of systems: Constant Volume, Variable Air Volume (VAV), Hydronic, and Other. Revit MEP automatically defaults to the service type that is selected in the Project Energy Settings window. See Chapter 25, “Creating a Project Template,” for information on how to establish project settings.
- Coil Bypass This is where you input the manufacturer's coil bypass factor for the unit serving the zone. This value indicates the volume of air that passes through the coil, unaffected by the coil temperature.
- Cooling Information This button allows you to set the zone cooling set point, coil-leaving air temperature, and zone humidity control.
- Heating Information This button allows you to set the zone heating set point, coil-leaving air temperature, and zone humidity control during heating.
- Outdoor Air Information This button allows you to input the ventilation loads for the zone: Outdoor Air Per Person, Outdoor Air Per Area, and Air Changes Per Hour. You may specify individual Outdoor Air options or enter a value in all three options. Revit MEP calculates heating and cooling loads with only the largest calculated outdoor airflow, not a combination of the three values. To obtain the required combined breathing-zone ventilation rate as defined in ASHRAE Standard 62.1, add the ventilation in cubic feet per minute (CFM) needed per occupant to the CFM required per area and divide the result by the zone area. Then enter this value in either of the first two options to force Revit into calculating the code-required ventilation rate.
A more accurate way to ensure that the correct ASHRAE Standard 62.1 (or other code) ventilation rate is modeled in the zone is to calculate the required outdoor air per the appropriate ventilation rate procedure and enter the result as shown previously.
Setting Building Construction Options
You are ready to investigate the physical properties of your building's exterior and interior constructions when all the spaces within your design building are placed, the internal data is identified, and the spaces have been grouped into zones, ready for the heating and cooling data to be analyzed. These elements control how heat leaves or enters your design spaces to or from the surrounding outdoor environment or adjacent spaces. Each element has a specific coefficient of heat transfer, or U-value, that is dependent on the element's material composition and assembly as well as its thickness.
The architect who created the building elements has already defined the wall or roof construction, so that data should already be loaded in with the link, right? Well, no. Although the architectural model can and often will have accurate wall and roof constructions, the U-values will not transfer from the link, unless the building has been modeled directly in the MEP project file. You have to define the building construction parameters. This will set U-values for the elements that bound your design spaces, allowing for heat transfer into and out of the spaces to be calculated and accounted for without depending on the linked model's elements directly.
To set the building construction U-values, open the Manage tab and click Project Information, as shown in Figure 8.8.
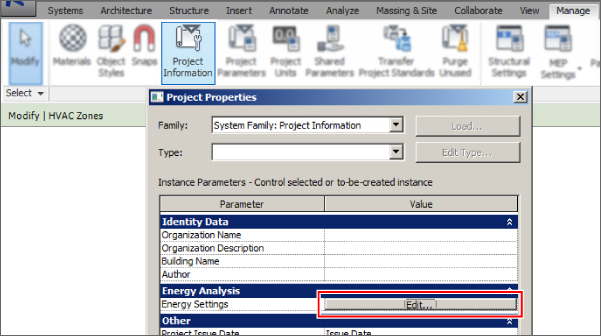
Figure 8.8 Project Information tab
From this window, click the Edit button for Energy Settings, and then click the ellipsis button next to <Building> in the Building Construction parameter. This brings you to the Building Construction dialog box (see Figure 8.9).
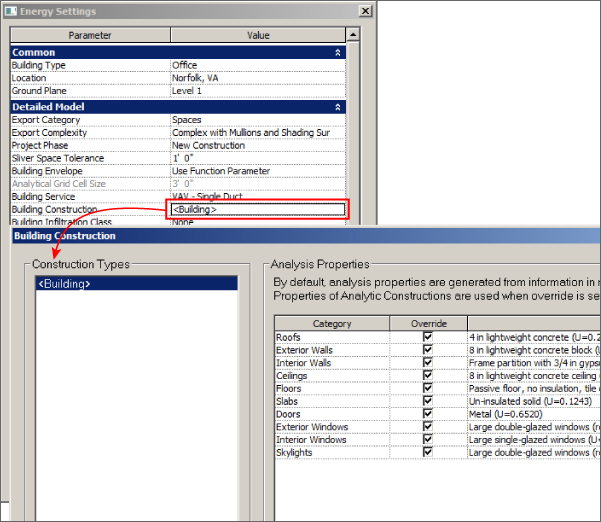
Figure 8.9 Building Construction dialog box
Here, you will be able to define the default construction characteristics for various building components. Clicking the drop-down arrow at each category exposes a wide array of common material constructions and assemblies from which you can choose to represent the walls, slabs, roof, and glazing, each with a unique U-value associated with it. Selecting the Override check box for a category forces the use of the Analytic Construction properties. These are defined when performing an energy simulation via the Energy Analysis tools on the Analyze tab or when information is missing. As stated earlier there really are no walls, roofs, or floors in your MEP model, so the Override boxes are selected by default.
The constructions for each category are customizable. The Constructions.xml file can be edited with any basic text editor, such as Notepad. The file is located here: C:Program FilesAutodeskRevit 2016en-US. This file is a combination of ASHRAE Standard 90.1, Chartered Institution of Building Services Engineers (CIBSE), and manufacturer data for building envelope values. Unfortunately, the only way to determine which material comes from which location is to open the XML file, where a more comprehensive description of the material is found. Figure 8.10 shows the Revit representation and the same material properties in the XML file.
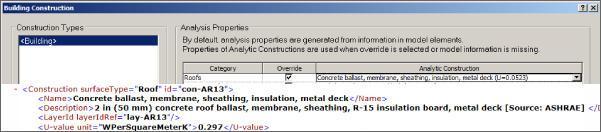
Figure 8.10 Example XML building data
If you look carefully, the U-values of each envelope construction are in W/M2K rather than the IP value of Btu/(h × ft2 × F). To utilize a custom construction, you must convert (if the project uses IP units) the construction U-value in Btu/(h × ft2 × F) to W/M2K by multiplying by the conversion factor 5.68.
As the designer, you can choose the construction option that is closest to the actual U-value that has been calculated through material thermal takeoffs of the architectural design, or you can create your own material in the XML file. Be aware, however, that this file cannot be located on a central server, so changes to this file that affect others would need careful management.
Just as all spaces are not going to be conditioned alike, some spaces have a physical construction that is different from that of the rest of the design building. For example, a utility space, such as a mechanical or electrical room, typically can be seen with exposed block wall construction, a bare floor slab, open-roof trusses or beams, and little or no insulation on the exterior walls. In Revit MEP, just as the individual space types can be defined differently from the overall building type, you have the option to have each individual space define its own construction U-values.
To alter the space construction, select a space in an open view, or if you have created a Space Properties schedule, select the ellipsis next to <Building> in the Construction Type column of the space that you want to edit. The Construction Type dialog box opens, and here you will be able to create individual space construction types as needed (see Figure 8.11).
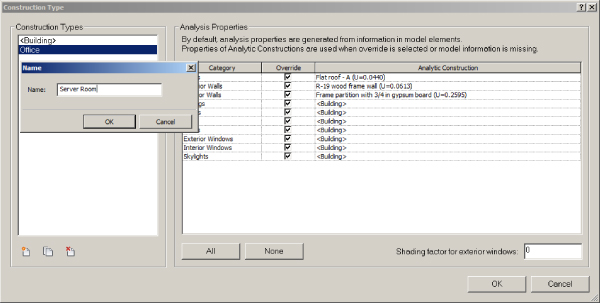
Figure 8.11 Construction Type dialog box
The same construction categories and options exist here as are available in the Building Construction dialog box. Create as many custom constructions as needed, which can now be used throughout the project. Note that you cannot alter the default <Building> construction type in this window. This is accessed from the Building Construction dialog box, mentioned earlier. Once you create a construction type, you cannot rename it. If you duplicate an existing type, it will automatically be given the same name with a sequential suffix number.
Performing Heating and Cooling Load Analysis
Once you have all your design spaces created and the respective parameters, conditioning systems, and space constructions defined, the next step is to pull all this data together into a heating and cooling load analysis report to tell you how this particular building will perform throughout the year. You will then use that data to refine your conditioning systems further as well as size the equipment you will assign to your HVAC zones.
You have already seen how the building and space construction can be modified to suit your building. But how do the different construction options affect the heat transfer into or out of the space? The engine that performs the heating and cooling load analysis in Revit MEP uses a radiant time series (RTS) method to determine the building and space peak heating or cooling loads. This method takes into account the time-delay effect of heat transfer through building envelopes, from the outside, and into spaces. A brief explanation of this method follows, but the RTS method of calculation is defined in detail in Chapter 30 of the 2005 ASHRAE Handbook: Fundamentals, as well as in the Load Calculation Applications Manual, also published by ASHRAE (visit www.ashrae.org for details).
The RTS calculation method determines cooling loads based on an assumption of steady periodic conditions, such as occupancy, design-day weather, and cyclical 24-hour heat gain conditions. Two time-delay effects are addressed during cooling load calculations:
- Delay of conductive heat gain through opaque massive exterior surfaces, such as exterior walls, the building roof, and floor slab on or below grade
- Delay of radiative heat gain conversion to cooling loads
Figure 8.12 shows a flowchart summarizing the RTS calculation method, also found in Revit MEP 2016 Help.
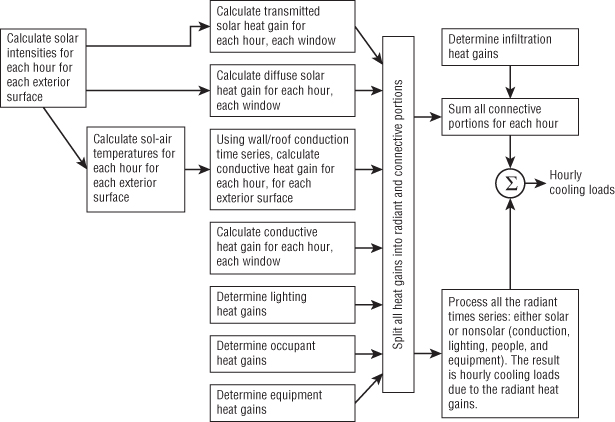
Figure 8.12 Radiant time series (RTS) calculation flowchart
Exterior building elements conduct heat because of a temperature differential between indoor and outdoor air; solar energy is absorbed by exterior surfaces as well. Because each surface has a mass and an associated thermal capacity of the materials that make up its construction, a time delay occurs from when the heat input of the outdoor and solar loads becomes heat gain to the interior space. The majority of energy that is transferred to a space as heat occurs through a combination of convection and radiation. The cooling load immediately picks up the convective part of the energy transfer, and any radiant heat is absorbed into the surrounding space constructions and interior room finishes.
The radiant heat is then transferred via convection from those surfaces to the space at a delayed time. Interior loads contribute to both the sensible heat gain of the space and a latent heat gain that is given off by people's activity within the space. The latent heat gain contributes to the instantaneous cooling load of the space, whereas the sensible heat gain from internals is absorbed and retransmitted by radiation to the space.
The engine sums up the calculated cooling loads to determine a total cooling load per each design hour, and it selects the highest load, or peak, for the design of the air-conditioning system. Note that Revit MEP uses, for the standard calculation, the hours of 6 a.m. to 6 p.m. for the design day, not the full 24 hours, and only the months of April through November (October through May for southern-hemisphere locations), not the full calendar year. The design day is derived from weather data for the location that you set during project establishment. We'll discuss weather data in a moment.
Heating loads are calculated much the same way. The major differences are the obvious lower outdoor air temperatures in the heating design day, ignoring solar heat gains and internal heat gains, and the exclusion of the thermal storage effect of the building construction. Negative heat gains, or heat losses, are considered to be instantaneous; therefore, heat transfer is dealt with as conductive. Latent heat gains are treated as replacing any space humidity that has been lost to the outdoor environment.
The worst-case load, as determined by the Revit MEP engine, is based on the design interior and exterior conditions and loads due to infiltration or ventilation. Although solar effects are ignored, assuming night or cloudy winter day operation, Revit does recognize internal heat gain from people, lights, or miscellaneous equipment to offset the heating load needed. These additional factors can be edited for spaces, as shown in Figure 8.13. The Occupancy and Heat Gain settings and the Electrical Loads settings for lighting and power can be either specified as <Default> values or edited to suit a particular space.
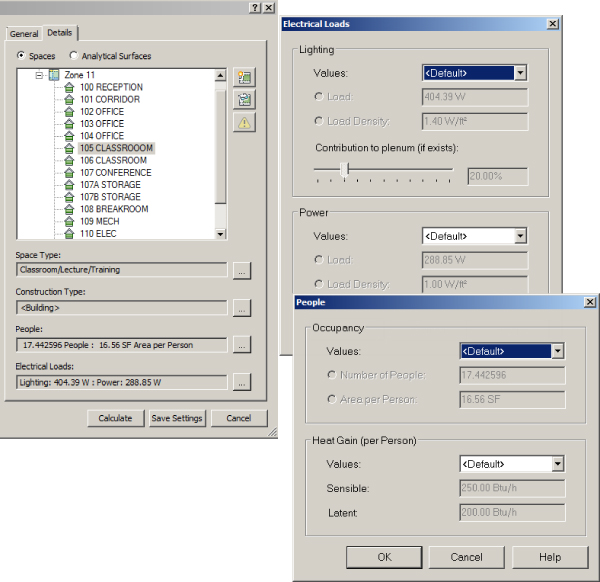
Figure 8.13 Additional loads
Load Analysis
Once you have a building model that is ready to analyze, the next step is to verify and specify, if needed, the building energy parameters by using the Heating And Cooling Loads tool, shown in Figure 8.14. On the Analyze tab, click the Heating And Cooling Loads button. The Heating And Cooling Loads dialog box appears, and on the General tab, you can view the building energy analysis project information that directly affects the heating and cooling analysis. You can also access these parameters through the Manage tab's Project Settings ⇨ Project Information setting.
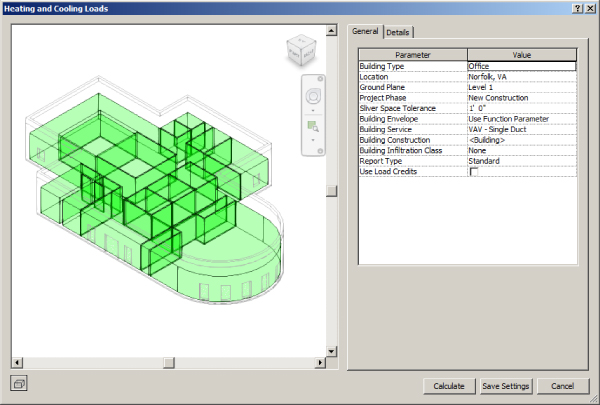
Figure 8.14 Heating And Cooling Loads dialog box
In this dialog box, you can set parameters such as the global building use type, building location, global conditioning system, overall building construction and ground plane, ground-level reference, and building infiltration. You can also define the level of detail you want to see in the load analysis report.
Weather Data
Earlier in the chapter, we discussed building type, service type, and building construction, but another major component of energy analysis is the physical location of the building. The location determines environmental conditions such as outdoor air temperature and humidity and also ASHRAE climate zone data. In the Heating And Cooling Loads dialog box, click the ellipsis button next to the Location parameter value to access the Location Weather And Site dialog box, shown in Figure 8.15.
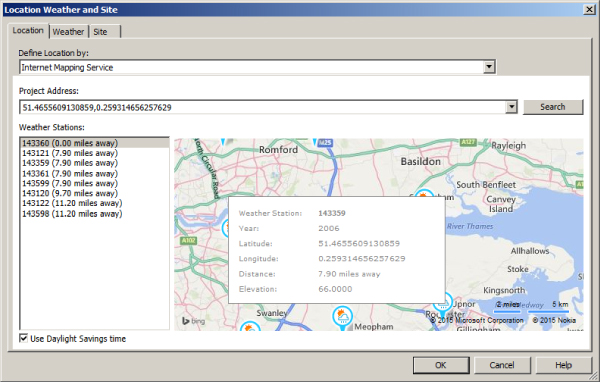
Figure 8.15 Location Weather And Site dialog box
You have two ways to input the project design city: select the location from the default city list, or use the Internet mapping service, as shown in Figure 8.15. If you are connected to the Internet, this option allows you to locate your project by using an interactive map through the Google Maps service. The default list contains major cities from which to select your location. Select the city that is nearest to the project location, or if it is known, you can enter the exact address of your project building, if applicable, or the latitude and longitude GPS coordinates. Select Use Daylight Savings Time if it is appropriate for your project location.
The next step is to modify the cooling and heating design temperatures, if needed. You can use the default values that are associated with the weather station closest to your design city, or by deselecting that option, you can modify the Dry Bulb, Wet Bulb, and Mean Daily Range temperatures as needed to fit your design location. You may specify the Heating Design Temperature value and set the Clearness Number value, which ranges from 0 to 2, with 1.0 being an average clearness. Clearness is defined in section 33.4 of the 2007 ASHRAE Handbook: HVAC Applications in the following way:
- Greater than 1.2: Clear and Dry
- 1.0: Average
- Less than 0.8: Hazy and Humid
Outdoor Air Infiltration
In the Heating And Cooling Loads dialog box, the Building Infiltration Class needs to be set next. When you click the drop-down at the right side of the Building Infiltration Class parameter value, you are given four choices to model the rate of outdoor air that enters the building, typically through leaks in the building envelope created at openings such as windows, doors, and locations where perpendicular building surfaces join. In Revit, infiltration is defined with the following categories:
- Loose: 0.076 CFM/ft2 of outside air
- Medium: 0.038 CFM/ft2 of outside air
- Tight: 0.019 CFM/ft2 of outside air
- None: Infiltration air excluded from the load calculation
Sliver Spaces
The next parameter to define is Sliver Space Tolerance. Sliver spaces in Revit are narrow areas that are bounded by parallel interior room-bounding components (parallel interior walls). These spaces include, but are not limited to, pipe chases, HVAC shafts, furrowed columns, and wall cavities. A sliver space is included in the heating and cooling load analysis only if all three of the following requirements are met:
- Identical parallel room-bounding elements enclose the space.
- The width of the sliver space is equal to or less than the Sliver Space Tolerance parameter.
- A space component has been placed in the tangent spaces on either side of the sliver space.
If any one of these three requirements is not satisfied, Revit does not recognize any effects of the sliver space. If there are different geometries to the same sliver space, only the areas of the space that meet the previous criteria are counted in the load analysis. The sliver space volumes are added to the volume of the larger tangent analytical spaces.
You also need to define the detail level of the heating and cooling analysis report. Three report detail levels are available:
- Simple, which contains summary data for systems, zones, and spaces
- Standard, which expands the simple report to include psychrometric data as well as building-level summaries and load summary data for each space
- Detailed, which further expands the data displayed to include individual component contributions to zone and space loads
Before you finish, you must define the ground plane, the project phase, and whether to include heating or cooling load credits, which are negative load values that come from heat entering or leaving a space through a partition into another zone, for example.
Details
Before you run the analysis, you are given the opportunity to go through your created zones and spaces to make sure your desired settings have not been compromised and that there are no warnings that would produce undesired effects on your loads. Switching to the Details tab, you can view the space and zone data that directly affects the heating and cooling analysis, as shown in Figure 8.16.
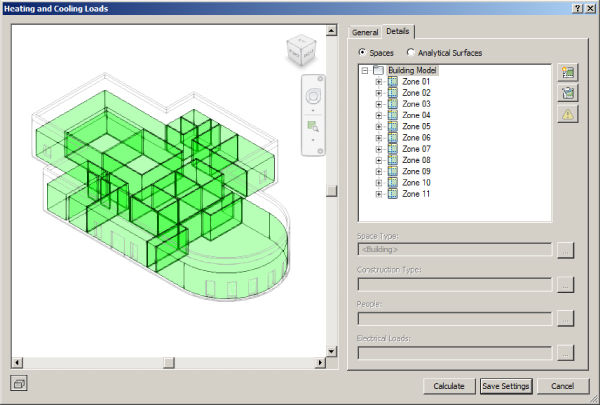
Figure 8.16 Building model details
After selecting a zone, you can expand the tree to view the associated spaces and verify or modify the zone service type, heating, cooling, and outdoor air information as needed. You can see whether a space is an occupied space, unoccupied space, or plenum space by the symbol preceding the space name in the tree, as shown in Figure 8.17.
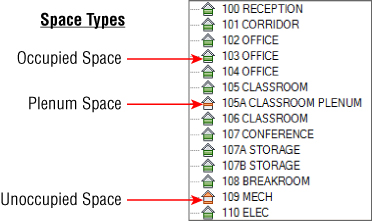
Figure 8.17 Space classification
The buttons at the right of the window allow you to highlight or isolate selected spaces or zones in the 3D view of the analytical model. There is also a button for reviewing any warnings associated with a space.
If a space is selected, you can set the space and construction type as well as internal load information. If, when you expand a zone, a warning symbol appears alongside a space, you can investigate by clicking the Show Related Warnings symbol and then correct or ignore the cause of the warning (see Figure 8.18). You can also zoom, pan, and orbit the 3D view for visual inspection of the spaces.
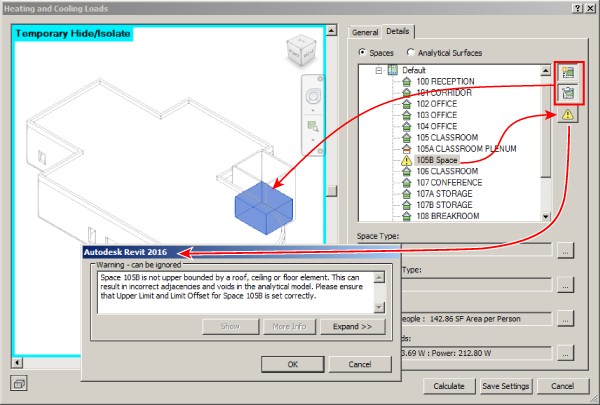
Figure 8.18 Space related warnings
The space warning shown in Figure 8.18 suggests that a space exists without an upper bounding element. Working on a large project, it may be difficult to locate the offending space. You can make use of the Highlight and Isolate buttons, also indicated in Figure 8.18, to reveal the space location. Click the Save Settings button, and you will be directed back to your model. Locate the space in question, and verify that the upper limit of the space is correct through the space's instance properties. You can also inspect the space visually by creating a section view through the space and verifying that the upper limit extends past a bounding element in the linked model.
Opening the Heating And Cooling Loads dialog box and selecting Analytical Surfaces allows you to view and isolate the physical elements that bound the spaces to be analyzed. You can isolate every individual bounding element that has been defined for the space—roofs, exterior and interior walls, ceilings, floors, and any air gaps or sliver spaces—and view them for any modeling errors before the simulation is performed. Figure 8.19 shows how a space can be isolated and the analytical surfaces displayed. This can help you identify where air gaps may exist or if surfaces are improperly categorized as interior or exterior.
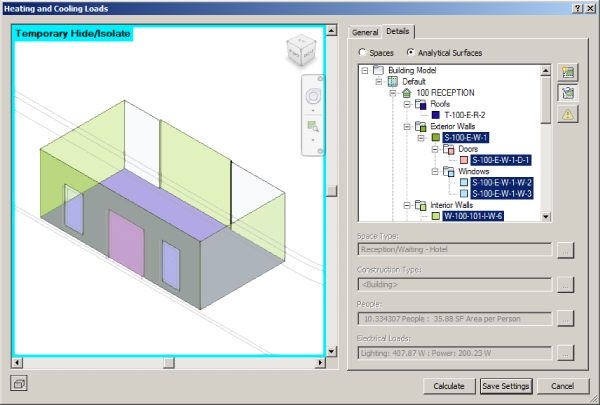
Figure 8.19 Analytical surfaces displayed in the Heating And Cooling Loads dialog box
Heating and Cooling Loads Report
Once all of the settings for spaces and zones meet your requirements, you can run an analysis by clicking the Calculate button.
After the simulation is completed, you are directed to the Heating And Cooling Loads report, shown in Figure 8.20. Depending on the level of report detail you selected prior to running the simulation, the tabulated results will be shown, broken into an overall project summary, a building summary, building-level summaries, individual zone data, and individual space data.
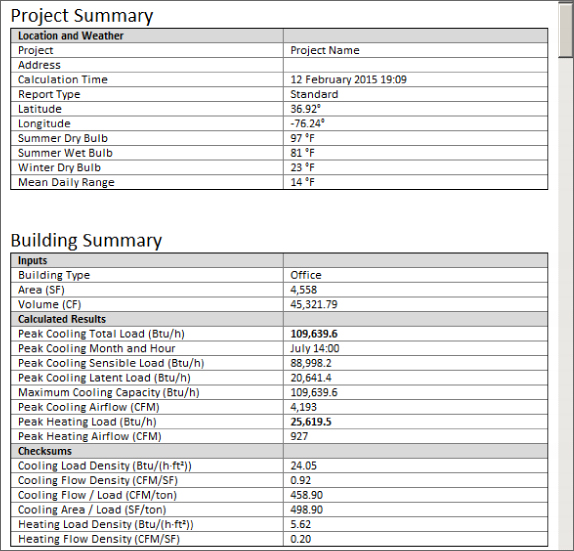
Figure 8.20 Sample Heating And Cooling Loads report showing the Project Summary and Building Summary areas
The Project Summary area lists the project information (name, address, location) as well as calculated design date and time, Summer Dry Bulb and Wet Bulb temperatures, Winter Dry Bulb temperature, and Mean Daily Range—values that should match the inputs you have entered with the weather data. The Building Summary area includes the global building type and its total analytical area and volume as well as the overall calculated performance of the building—peak cooling loads, peak heating loads, airflows, and building checksums.
The Level Summary area includes the analytical area and volume of each level of the design building, if applicable, as well as each level's individual performance values, similar to the Building Summary area. The Zone Summary area lists each analyzed zone along with its inputs, psychrometrics, and the calculated performance results. It also breaks down the various cooling and heating components and displays a list of the spaces that make up the zone along with a brief summary of the space performance. The Space Summary area displays the space analytical areas and space volume, load inputs, and space type as well as the calculated results for the space. It also contains a breakdown of the individual space components and how they contribute to the cooling and heating loads.
Revit MEP allows you to run a heating and cooling load analysis, make changes, and run a subsequent analysis all while retaining the reports run for each analysis. Load reports are individually time-stamped and can be accessed in the Project Browser under Reports. This enables you to easily flip to a previous report and quantify the changes in your design without resorting to printing out each report as it is generated. Each report can grow to several hundred pages, depending on the size of your job and the detail level selected.
Now is a good time to set up and run a sample HVAC load analysis in Revit. Here's how:
- Open the file
Chapter 8 HVAC.rvtavailable atwww.sybex.com/go/masteringrevitmep2016. - Open one of the elevation views, select both the levels, and delete them. Revit will warn you that views are being deleted; this is expected. Click OK.
- Download and link in the Architectural model file
Chapter8SampleBuilding.rvt, which can be found on the same web page. Use Origin To Origin placement when linking the file. - Set the property of the linked file to Room Bounding by selecting the link, editing its type parameters, and selecting the Room Bounding check box. Click OK.
- From the Collaborate tab, select the Copy/Monitor tool ⇨ Select Link and click on the linked file. From the Tools panel, select Copy and click on each of the Levels in the linked file. Ignore the warning message regarding level head types for this exercise. With all the levels copied, you will see a monitor symbol appear in the center of each one as you go, as shown in Figure 8.21. Once the copying is complete, click Finish.
Figure 8.21 Monitor symbol
- From the View tab, select Plan Views ⇨ Floor Plans and highlight First Floor and ROOF.
- Open the First Floor plan to start placing spaces. Click the Analyze tab, and select Spaces to begin placing your spaces in the view. Either select the rooms you want or click Place Spaces Automatically. Confirm the number of spaces created.
- Create a working Space Properties schedule to manage space data. Click the Schedule/Quantities button.
- Select Spaces as the category, and use New Construction as the phase. Click OK.
- From the available fields, select the appropriate categories to match the Space Properties schedule shown earlier in Figure 8.4. Remember, you can also add the Room Name and Room Number fields.
- Adjust the Name and Number fields to match the architectural link, either by manually entering the values or by using a space-naming utility. Sort the rows in descending numerical order.
- Notice that all the space types are set to <Building>, and the condition type is Heated And Cooled. If you examine the building type, you should see that it is set to Office. Choose Manage ⇨ Project Information ⇨ Energy Settings to confirm. Click OK twice.
- In the Space Properties schedule, select the Space Type cell associated with Office 102. Open the Space Type Settings dialog box by clicking the ellipsis in that cell.
- Set the Space Type parameter value to Office – Enclosed. Notice the changes in the space parameter values. Verify that Occupancy Schedule is set to Common Office Occupancy – 8 AM to 5 PM and that the lighting and power schedules are set to Office Lighting – 6 AM to 11 PM. Click OK.
- Notice that the Number Of People value for Office 102 has changed. This reflects the different Area Per Person parameter value for Space Type – Office Vs. Building Type – Office.
- Set the remaining space type values appropriately.
- Notice that the number of people in each space is taken out to six decimal places. Set the field format for this column to use fixed units with a rounding to 0 decimal places. Switch back to the First Floor plan view.
- Click the Heating And Cooling Loads button on the Analyze tab. Switch the view to Details, and expand the Default tree.
- Each space has a warning symbol attached to it. Select a space. As you click the Warning button, you will see that the space is not upper-bounded by a roof, ceiling, or floor element. You need to set the upper limits of each space to ensure accurate building analysis. Click OK and then Cancel.
- In the First Floor plan, select all the spaces. In the Properties palette, set the upper limits of each space to Roof with a 0′-0″ (0 mm for metric projects) offset.
- Open the Heating And Cooling Loads dialog box, and verify that all the warnings have been cleared from the spaces.
- Click Calculate.
- View the building performance report that has been generated.
- Switch back to the First Floor plan and click the Zone button on the Analysis tab.
- Create zones in the First Floor plan. Group the spaces as shown in Figure 8.22, and name the zones per the sample schedule.
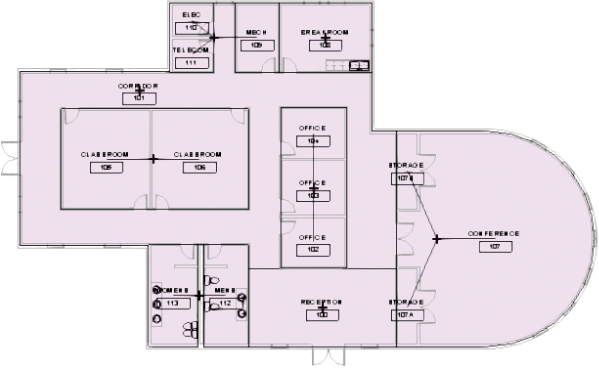
Figure 8.22 Grouping spaces in the floor plan
- Select the zone for the offices in the floor plan. Verify that the service type is VAV – Terminal Reheat, as shown in Figure 8.23.
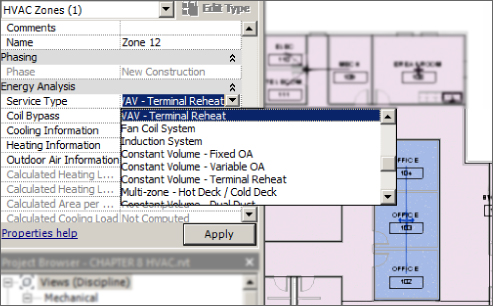
Figure 8.23 Zone service type
- Click Edit for the Outdoor Air Information setting, and for this zone, enter 5 CFM per person, and 0.06 CFM/SF in the appropriate boxes. Set the space occupancies equal to 1 person.
- Run another building analysis.
- As you view the Zone Summary report for the offices zone, you should see that the Peak Ventilation Airflow value is 20 CFM. The Ventilation Density value equals 0.06 CFM/SF—the value you entered. The Ventilation/Person value, however, equals 7 CFM/person, which is not what was entered. Remember, Revit MEP takes the largest ventilation load, not the required combined ventilation load, when calculating the building performance.
- To get the ASHRAE-required ventilation, do the following:
- Calculate the required ventilation from the measured area.
- Calculate the required ventilation from the number of occupants.
- Add the two values, and divide by the total area.
- Enter this value in the Outdoor Air Information window for the office zone.
- Run the analysis again, and observe that the offices zone Ventilation Airflow value has changed to the airflow calculated in the previous step.
- Using the Space Properties schedule, zone properties, and the Heating And Cooling Loads dialog box, adjust various parameters and rerun the heating and cooling analysis.
- Use the different reports generated to compare the effects of your changes to the building.
- Close the file.
Performing Conceptual Energy Analysis on Your Building
Revit MEP has the ability to perform a conceptual energy analysis on the project building directly within Revit. With the increasing requirement for projects to achieve Leadership in Energy and Environmental Design (LEED) certification from the U.S. Green Building Council (USGBC), it proves beneficial to analyze a simplified project building in the concept design phase. Knowing a building's possible energy performance will help you flesh out the design of the building systems. Having an idea of how the building will perform will also help your team with fleshing out the project's LEED checklist.
Setting Up the Model
First, before any energy analysis can be done, the feature has to be activated by clicking the Sign In link on the Information bar to log into the Autodesk® A360 platform, as shown in Figure 8.24. Go to https://360.autodesk.com for information about obtaining an Autodesk 360 account.
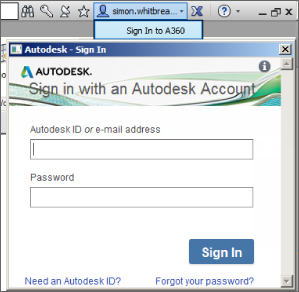
Figure 8.24 Logging in to Autodesk 360
The Energy Analysis panel of the Analyze tab has been updated in Revit MEP 2016 to streamline your conceptual analysis workflow. Figure 8.25 shows the tools, which are described next.
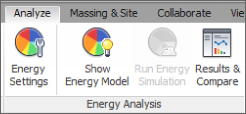
Figure 8.25 Energy Analysis tools
As shown in Figure 8.26 and depending on the settings used, you can choose energy analysis based on building elements, conceptual masses, or a combination. The analytical model will show some gaps and jagged edges—this does not affect the results significantly and is done for performance. Analytical Space Resolution and Analytical Surface Resolution values in Energy Settings can be edited, but they will not necessarily enhance the results. Clicking Show Energy Model will create a 3D view and display the analytical constructions.
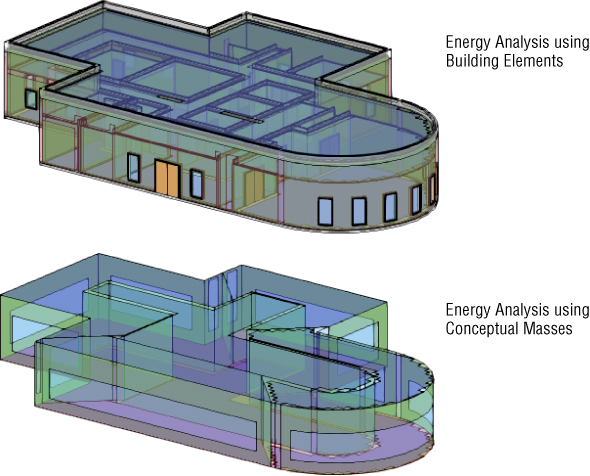
Figure 8.26 Energy Analysis models
The Show Energy Model tool will create the analytical model based on your design selection settings, and if it does not already exist, a new coordination discipline view named 3D Energy Model will be generated. This tool doesn't toggle the analytical model on and off as in previous releases; it actually creates and deletes the analytical geometry. This means you can edit the building model without the analytical model updating in real time.
To use this mode, you can use building elements (whether in your model or linked), or you can set up a mass model that allows you to explore various building design ideas by conceptualizing the building through shapes. Under the Massing & Site tab, set the Show Mass button to Form And Floors via the pull-down menu. This will enable any mass form created to be visible, regardless of view settings.
Click the In-Place Mass button. Name the mass you want to model. Draw a closed sketch around the exterior envelope of the building. You can adjust the sketch to get the shape you need by moving the vertices to the desired location. Once the sketch is complete, click Create Form ⇨ Solid Forms, and then click Finish Mass.
Next, create analytical floors. In a 3D view, select the mass, and adjust the height of the mass so that it encompasses all the building levels you wish to analyze. Under the Modify Mass tab, select Mass Floors. The levels that are intersected by the mass model appear in a pop-up window and are available to be selected for inclusion in the analysis.
Select Energy Settings. New to Revit MEP 2016 is Analysis Mode (in the Energy Model section) as well as optional energy settings that you can define, as shown in Figure 8.27.
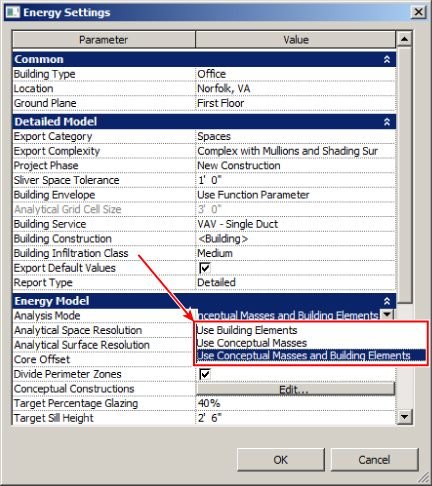
Figure 8.27 Energy settings
The following settings are available:
- Building Type Select the overall building type that will be simulated.
- Location Set the geographic location of the building.
- Ground Plane Verify that the ground level in your model is defined as the ground plane in the simulation; any levels below the ground plane will be treated as underground floors.
- Analysis Mode In this version of Revit MEP you have the option to decide what elements define your analytical model. You can choose from the following:
- Use Building Elements
- Use Conceptual Masses
- Use Conceptual Masses And Building Elements
- Core Offset If a building core is desired but currently not zoned or undefined, set the appropriate analysis distance from the perimeter of the building.
- Divide Perimeter Zones If desired, activating this option will create four equal quadrant-based zones for each mass floor.
- Conceptual Constructions Clicking the Edit button in this category enables you to set how the conceptual construction elements of the building will perform in the analysis. As shown in Figure 8.28, there are several categories to edit, and each category has several construction options to choose from.
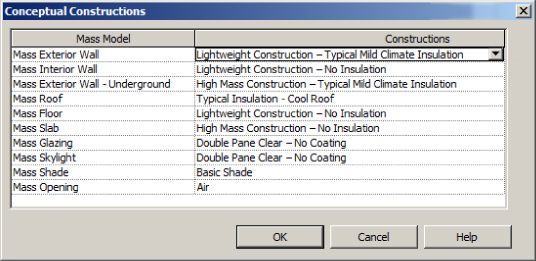
Figure 8.28 Conceptual Constructions options
A detailed explanation of each construction value, including R-value, Unit Density, Heat Capacity, SHGC, and Tvis (for glazing) can be found in Help under Revit Users ⇨ Analyze The Design ⇨ Energy Analysis For Autodesk Revit ⇨ Energy Settings ⇨ Energy Model Settings.
- Target Percentage Glazing This value approximates the preferred window percentage per mass zone (similar for Target Percentage Skylights).
- Target Sill Height This value sets the bottom edge of the glazing.
You may then set a desired operating schedule for the building, approximate HVAC system performances, and determine any outdoor air information desired.
If you choose the Rooms option for the Export Category parameter, the settings options change slightly. The Include Thermal Properties setting becomes available, which enables you to use the thermal properties of the materials assigned to building components in the analysis. If no thermal properties are defined in an element, the analysis is done with the conceptual constructions.
Keeping It Simple
Remember that this is a conceptual energy analysis—not a full-blown LEED or EPACT energy analysis. You will use this tool to ensure that energy use and natural resources factor into the building layout, orientation, and system design. In Revit MEP, greater modeling complexity will not always result in greater analysis accuracy.
There are maximum limits that Revit can analyze to produce a successful conceptual energy report. For a complex building, you may have to disable the Divide Perimeter Zones option, reduce the Core Offset value to 0, and create custom zones to simplify the model. You need to model only major zones or spaces and combine smaller spaces into large zones. Spaces such as restrooms, closets, and stairwells do not need to be defined. If the model is kept complex, errors may be introduced in the simulation, and simulation performance may decrease without an appreciable increase in the accuracy of the results.
With a simplified mass model, Revit MEP allows for easy analysis and comparison of design options. Experiment with different mass forms, orientations, envelopes, schedules, occupancy, and zoning to determine which building changes will have the greatest impact on energy performance.
Performing Energy Simulation
When you are ready, switch to a 3D view of your project—Revit analyzes either the mass displayed in the 3D view or the building elements or a combination of the two, depending on the setting you used in Energy Settings. Click the Show Energy Model button and Revit will display a warning box, as shown in Figure 8.29, telling you that this process may take “considerable” time and that Revit will be inaccessible. The warning message will largely depend on what type of elements you are creating your energy model from.
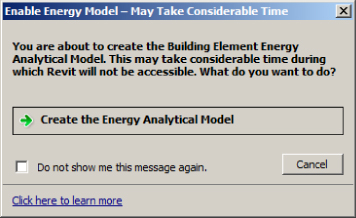
Figure 8.29 Enable Energy Model
Click to create the energy model, and Revit creates and opens the new coordination view described earlier in this chapter. You then have the option to run the energy simulation or continue working. To run the simulation, you must be a subscription customer and be logged into Autodesk A360. You will then see the dialog box shown in Figure 8.30. Use a unique name for each run so that you will be able to easily identify and compare designs. Click Continue to run the analysis.
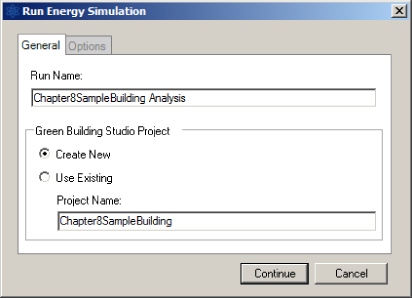
Figure 8.30 Run Energy Simulation dialog box
Analysis occurs “in the cloud,” so you will be able to navigate through your project while the simulation runs. When the simulation ends, you will be prompted with an alert that the results are ready to view. Click the alert to view the results, or you can click the Results And Compare button on the Energy Analysis panel. Figure 8.31 shows a sample report dialog box.
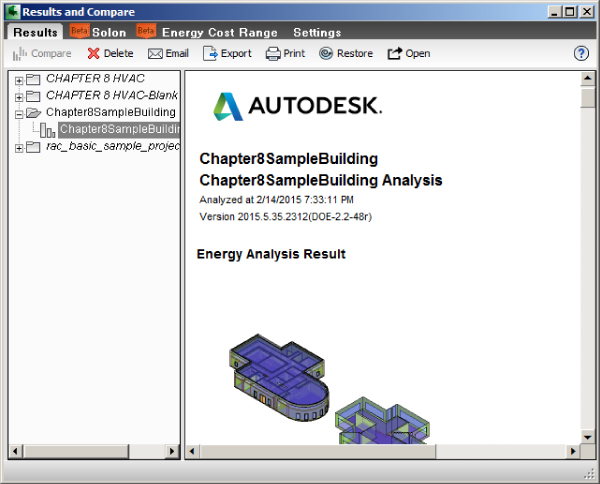
Figure 8.31 Sample report
Based on the inputs entered and how all the mass model variables were defined, the results displayed include conceptual Energy Use Intensity (EUI), Life Cycle Energy Use/Cost, and Renewable Energy Potential (PV and wind power) values and various graphs showing carbon emissions, heating and cooling loads, weather data, and fuel consumption and demand.
The Settings tab of the dialog box allows you to choose which results are to be displayed in the report. The report can be exported to PDF, gbXML (.xml), DOE-2 (.inp), or an EnergyPlus file (.idf) or gbXML Geometry (.dwfx). You can compare the results of multiple analyses by selecting the reports in the tree at the left of the dialog box and then clicking the Compare button. The reports will be shown side by side for easy comparison of each result category.
Analyzing Duct and Pipe System Pressure
Along with heating and cooling analysis and energy analysis, Revit MEP has the ability to generate pressure loss reports of correctly modeled duct and piping systems. Note that you must first have your duct or pipe systems routed and sized by using the duct and piping sizing tools. The procedures to do so are outlined in Chapters 10 and 11, respectively. We cover generating a duct pressure loss report in this chapter—the process is the same for piping systems.
To generate the duct loss report, use the Duct Pressure Loss Report tool found on the Reports & Schedules panel of the Analyze tab. You will see the Duct Pressure Loss Report – System Selector dialog box, which enables you to select the duct systems you want to include in the report from a list of available systems that have been correctly defined. You may also select the duct systems within the appropriate views and then click the Duct Pressure Loss Report button, or you may select the systems within the System Browser and then right-click and select Pressure Loss Report.
Note that pressure loss reports cannot be generated for fire protection or gravity flow (that is, sanitary) systems.
Click OK to generate the report. The Duct Pressure Loss Report Settings window appears and is where you will define the detail level of the report generated, as shown in Figure 8.32. The level of detail and the information reported is up to you. You can save the settings for the report in your project so that multiple types of reports can be generated.
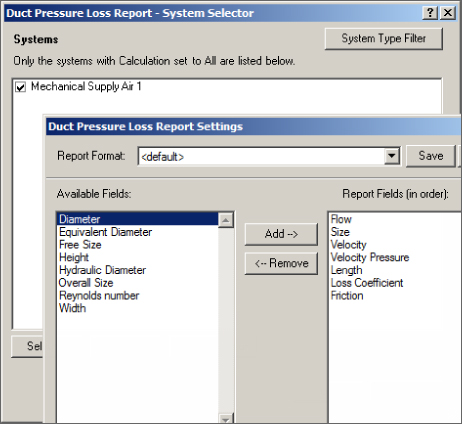
Figure 8.32 Duct Pressure Loss Report Settings dialog box
These generated reports, along with the System Inspector, provide a quick and useful way to double-check the designed systems with other third-party static pressure or flow calculations to ensure that the critical path and pressure loss in the Revit model match up to your intended design and equipment selections. The reports are also a way to break down complicated systems by components, identifying any sizing, flow, or friction anomalies that may be throwing off your design.
Exporting gbXML Data to Load-simulating Software
Now you've explored how to set up a building for heating and cooling load analysis and how to perform the analysis in Revit MEP. That's it, right? You're finished? You have an accurate energy analysis of every component in the building's heating and cooling systems?
The engine built into Revit MEP does not currently have the programming needed to perform a complete energy analysis of your building. Increasing LEED certification requirements means that you need an equally increasing level of detail in the building analysis, the comparison to the baseline building design, and the documentation to obtain the desired design certification. The solution to this dilemma is to export your Revit MEP model via Green Building XML (gbXML) format to a third-party simulation program, such as Trane TRACE 700 or Carrier's HAP.
gbXML was developed in the late 1990s to enable interoperability between building design models and engineering analysis tools. Its use by major CAD vendors and several major engineering simulation vendors helps to streamline time-consuming building takeoffs—helping to remove some of the cost associated with the design of energy-efficient buildings. Go to http://gbxml.org for more details on the purpose and origin of gbXML.
To export your Revit MEP model, click the Application menu button and then choose Export ⇨ gbXML. You will be directed to the Export gbXML dialog box, shown in Figure 8.33. Even though the architectural model is linked into your project, the geometry will be exported to your analysis program.
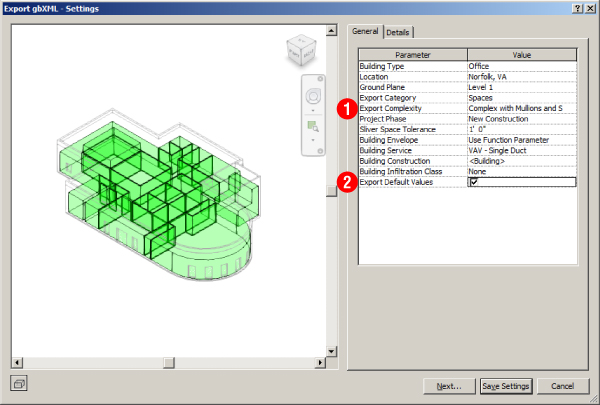
Figure 8.33 Export gbXML dialog box
This window looks nearly identical to the Heating And Cooling Loads dialog box (shown earlier in Figure 8.14). If a heating and cooling load analysis has already been performed, the majority of the parameters in the General tab should already be defined per your design requirements. If not, adjust the parameter values as needed; these parameters were discussed earlier in this chapter.
Two settings that exist in the export window, but not in the analysis window, are the Export Complexity and Export Default Values settings. If the Export Default Values box is selected, the default values for people, electrical loads, occupancy, lighting, schedules, and constructions will be exported, regardless of any user-overridden values. If this box is deselected, then only user-entered values will be exported.
Export Complexity is simply that: the level of complexity of the information contained within the exported gbXML file. Five levels of complexity exist and are described here:
- Simple Curtain walls and curtain systems are exported as a single opening. Simple complexity is used for the heating and cooling analysis and is most suited for exporting.
- Simple With Shading Surfaces This is the same as Simple but with shading surface information included.
- Complex Curtain walls and panels are exported as multiple openings, with each panel as a separate opening.
- Complex With Shading Surfaces This is the same as Complex but with shading surface information included; however, the shading surfaces (roof overhangs, free-standing walls, and so on) are not associated with any room/space.
- Complex With Mullions And Shading Surfaces This is the same as Complex With Shading Surfaces but with mullions and curtain walls exported as simple analytical shading surfaces based on centerline, thickness, and offset.
The Details tab is identical to the analysis window, and as before, you are able to set or verify space energy parameters such as the building and space construction types, internal loads, and zone information such as the service type and temperature set points. You are able to view and verify that all the analytical surfaces are correct and address any construction or space modeling warnings that are present before exporting.
Click Next, and you are prompted to save the gbXML file. Browse to your project directory, and name the file accordingly. Your gbXML file is now ready to use.
Now you have complete model information set up to be read by a simulation program without issue and without any further manipulation, right? Unfortunately, that is not the case.
A major issue with the exported data deals with the building construction. Revit breaks larger elements, such as a floor slab in large or complex-shaped spaces, into smaller polygonal elements for computation. This means that a single floor element is broken into several individually tagged and defined floor elements in the same space. Revit MEP also has a tendency, depending on how the architectural link is modeled, to assign exterior wall values to interior walls that are not bounded by a space, or roof values to ceilings that are not bounded by a space.
If your design space has an unusual or atypical geometry, such as a curved wall, the number of individual elements within a single type can grow to the hundreds. This is a prevalent issue when trying to import your gbXML file into an outside simulation program. There simply is not enough capacity in the third-party programs to handle large numbers of building surfaces—sometimes stopping at the first eight surfaces and causing you, the designer, to have to examine each space individually to delete and remodel any surfaces in error.
Also, importing errors may occur when parameters such as the construction data U-values fall outside a common range predefined by your simulation software. Often it will prompt a warning message, but at other times the gbXML data will fail to import completely. Most of the time, the remedy, again, is to check each individual building element construction or assembly to make sure that the appropriate U-values are modeled. Otherwise, you are forced to create the assemblies manually from scratch. In addition to checking the construction, make sure your simulation program has properly read the internal load data—manually adjust or enter the data as required.
Do not be discouraged. Yes, you may experience some drawbacks when exporting and importing gbXML data from Revit. As a designer, any effort you make to reduce the time-consuming process of modeling each space of the building in your simulation program will be worth the effort. Although there are some shortcomings, with Revit MEP 2016 you have the ability to examine the model geometry and data within the space prior to analysis, which can save time on your projects and improve coordination.
The Bottom Line
- Prepare your Revit MEP model for analysis. The key element to a successful building performance analysis is the proper accounting of all variables that will influence the results.
- Master It Describe the relationship between rooms and spaces—are they the same element? Describe an essential tool that can be created to maintain and track space input data and building construction for a heating and cooling load analysis.
- Perform heating and cooling analysis with Revit MEP 2016. Before a piece of equipment can be sized or duct systems designed, the building heating and cooling performance must be known in order to condition your spaces accurately.
- Master It How does project location affect building heating and cooling loads? Describe methods to determine project location in Revit MEP 2016.
What is a sliver space, and how does it affect the building performance?
- Master It How does project location affect building heating and cooling loads? Describe methods to determine project location in Revit MEP 2016.
- Perform a conceptual energy analysis on your building. Revit MEP 2016 gives you the ability to run an analysis on a project while it is in its conceptual design phase. This allows for quick testing of various options.
- Master It What is the purpose of a conceptual energy analysis?
Will increasing the complexity of your concept building model produce the most accurate energy analysis?
- Master It What is the purpose of a conceptual energy analysis?
- Analyze duct and pipe system pressure with Revit MEP 2016. Pressure loss reports can be easily generated from your model. These can help with important design decisions and can show the differences between design variations.
- Master It How is the pressure-loss report a useful addition to Revit MEP?
- Export gbXML data to load-simulating software. Often, to complete the building analysis, the Revit MEP model has to be analyzed in greater detail by a third-party simulation program.
- Master It What is gbXML? Why is it necessary to export your Revit MEP project?